
| Company | Oct 25 | Nov 25 | Dec 25 | Jan 26 | Feb 26 | Mar 26 | Apr 26 | May 26 | Jun 26 | Jul 26 | Aug 26 | Sep 26 | 12-Mo |
|---|---|---|---|---|---|---|---|---|---|---|---|---|---|
| BKNG | -6% | -3% | +9% | -7% | -15% | -0% | -0% | -1% | +7% | +8% | +3% | -18% | -24% |
| EXPE | +3% | +16% | +11% | -7% | -19% | +7% | +8% | -9% | +13% | +15% | +8% | -17% | +24% |
| ABNB | +4% | -8% | +16% | -5% | +4% | -7% | +11% | -5% | +7% | +6% | +21% | -12% | +32% |
| TCOM | -6% | -1% | +3% | -15% | -14% | -5% | +9% | -13% | -16% | +18% | -5% | -12% | -48% |
| MMYT | -15% | -11% | +15% | -24% | -9% | -34% | +27% | -1% | +14% | +7% | +2% | -19% | -50% |
| HTHT | -1% | +19% | +2% | +1% | +15% | -8% | +3% | -11% | -7% | +2% | +11% | -8% | +14% |
Source: Yahoo Finance monthly adjusted close.
Quick Thesis
- Rated hold because valuation is fair, not cheap, against strong cash generation.
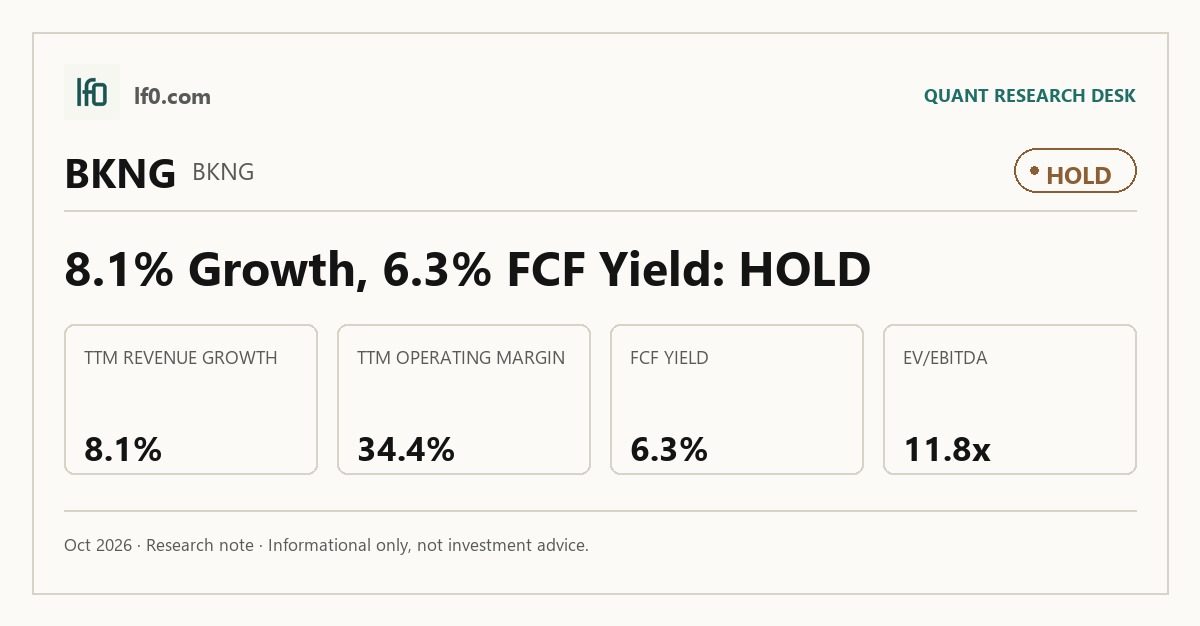
- TTM operating margin was 34.4%, with 6.3% FCF yield and 0.4x net debt/EBITDA.
- Main risk is insider selling: 179 open-market sales and no purchases.
- BKNG trades at 11.8x EV/EBITDA, above EXPE’s 10.9x but below ABNB’s 31.2x.
- I would turn more cautious if Q3 2026 room-night growth falls below 5%, meaning demand is slowing.
Executive Summary
Rating: HOLD | BKNG
We’ll begin tracking this call’s performance since publication once sufficient adjusted-close data is available.
I would put my rating as a hold because Booking Holdings is still converting scale into cash, but the current multiple already reflects much of that quality. The business posted 34.4% TTM operating margin, 6.3% FCF yield, and 0.4x net debt/EBITDA, which is a strong combination for a travel platform, yet the shares still trade at 11.8x EV/EBITDA and 12.9x forward P/E. In my view, that is a fair price for a durable franchise, not an obvious bargain. I would become more constructive if Q3 2026 room-night growth stays above 5% and EBITDA margin holds near 36.9%, because that would show the company can keep compounding earnings without stretching the balance sheet.
Company Profile
Booking Holdings Inc. runs online travel reservation services through Booking.com, Priceline, Agoda, KAYAK, and OpenTable. It earns most of its revenue from merchant bookings, agency commissions, and advertising and other fees. Booking.com is the core asset: it serves about 4.4 million properties in over 220 countries and territories, while KAYAK operates in over 60 countries and OpenTable focuses on restaurant reservations in the United States. The company employed about 24,300 people at December 31, 2025, and its operations are supported by data centers in Europe, Asia, and North America.
Economic Moat
Business Model
The moat is built around Booking.com’s scale in online accommodation. With about 4.4 million properties in over 220 countries and territories and support in more than 40 languages, I feel that a competitor would struggle to rebuild that supply breadth and demand density quickly. That scale also reinforces the company’s brand as a leading booking platform for online accommodation reservations, so the network effect is not just theoretical. Adjacent products such as payments, Genius, and Gen AI reduce friction and deepen partner value, but the accommodation core remains the main source of structural advantage.
Business & Operating Risks
The most important disclosed risk is dependence on travel demand. Lower average daily rates, weaker consumer spending, and geopolitical or currency shocks can all hit bookings and take rates at the same time. Competition is the other major pressure point: Google’s travel integration and AI-native search tools could divert traffic, weaken direct relationships, and force more discounting. Booking also depends on third-party channels such as search, app stores, and mapping services, which can change ranking or access terms without warning. Regulatory risk is more concrete now too, especially in Europe, where the Digital Markets Act, the Digital Services Act, and parity-related investigations can force changes to pricing, ranking, and partner terms. I do not think these risks break the moat, but they do test how much of Booking’s scale advantage can survive if traffic acquisition gets more expensive and regulation keeps tightening.
Management Discussion & Analysis
Management is responding to those risks by pushing harder on efficiency, direct engagement, and capital discipline. The Transformation Program has already produced about $250 million in annual run-rate savings by year-end 2025, which helps offset the higher marketing and technology spend needed to defend traffic. At the same time, the company spent $6.4B on buybacks and $1.2B in dividends in 2025 while still issuing $3.7B of long-term debt, so management is clearly willing to use the balance sheet to support shareholder returns. That mix tells me the company is not retreating from the risk set; it is trying to outspend it selectively while keeping the cost base under control.
Recent Events
The most relevant recent event was the appointment of Caroline Sullivan as Senior Vice President, Chief Accounting Officer, and Controller, effective April 29, 2026. Her background at Moody’s and Bank of America strengthens the finance bench, which matters because Booking’s moat depends on disciplined execution as much as product breadth. The company also completed a two-step euro debt raise in May 2026, extending maturities while adding fixed obligations. In my view, that is a sensible liquidity move, but it only helps the moat if cash generation stays strong enough to keep leverage low.
Financial Analysis
Growth
BKNG — Financial Growth (Quarterly, USD Mil)
| Metric | 2025-03-31 | 2025-06-30 | 2025-09-30 | 2025-12-31 | 2026-03-31 | 2026-06-30 |
|---|---|---|---|---|---|---|
| REVENUE (USD Mil) | — | 6,798 | 9,008 | 6,349 | 5,532 | 7,352 |
| EBIT (USD Mil) | — | 1,522 | 3,770 | 2,112 | 1,652 | 2,860 |
| EBITDA (USD Mil) | — | 1,716 | 3,969 | 2,303 | 1,815 | 3,022 |
| NET INCOME (USD Mil) | — | 895 | 2,748 | 1,428 | 1,083 | 1,950 |
| DILUTED EPS | 0.4 | 1.1 | 3.4 | — | 1.4 | 2.5 |
Source: Yahoo Finance — Quarterly Financial Statements
Revenue was $7.35e+03M in Q2 2026, up 8.1% year over year, after a seasonal dip to $5.53e+03M in Q1 2026. EBITDA rose to $3.02e+03M and net income reached $1.95e+03M in the same quarter, so earnings are growing faster than sales. That is important because the moat only matters if it still converts into incremental profit, and Booking is doing that even while travel demand remains uneven. The Q1 softness looks seasonal rather than structural, which is consistent with the company’s travel exposure and the rebound in the following quarter.
Profitability
BKNG — Profitability (TTM)
| Metric | TTM |
|---|---|
| Operating Margin (TTM) | 34.4% |
| Net Margin (TTM) | 25.5% |
| Return on Assets (TTM) | 20.4% |
| Gross Margin (TTM) | 87.2% |
| EBITDA Margin (TTM) | 36.9% |
Source: Yahoo Finance — Trailing Twelve Months (TTM)
TTM gross margin was 87.2%, operating margin was 34.4%, EBITDA margin was 36.9%, and net margin was 25.5%. The 52.8-point spread between gross and operating margin shows that Booking keeps a large share of each booking dollar after direct costs, but it still spends heavily on marketing, technology, and overhead to defend its position. Return on assets was 20.4% TTM, which tells me the company is generating strong profit from a relatively light asset base. That combination supports the moat thesis: the platform is not just large, it is efficient.
Valuation
BKNG — Valuation Multiples
| Metric | Value |
|---|---|
| Current Share Price (USD) | 159 |
| Market Cap (USD Mil) | 123,221 |
| Enterprise Value (USD Mil) | 123,195 |
| Trailing P/E | 17.7 |
| Forward P/E | 12.9 |
| Price/Sales (TTM) | 4.4 |
| Price/Book (mrq) | -11.2 |
| EV/Revenue | 4.4 |
| EV/EBITDA | 11.8 |
| FCF Yield % (TTM) | 6.3% |
| Forward EPS (USD) | 12.4 |
| Analyst Target Price – Low (USD) | 188 |
| Analyst Target Price – Mean (USD) | 238 |
| Analyst Target Price – High (USD) | 301 |
| # Analyst Opinions | 36 |
Source: Yahoo Finance
Booking trades at 17.7x trailing earnings, 12.9x forward earnings, 4.4x sales, and 11.8x EV/EBITDA, with a 6.3% FCF yield. On the analysis here, I would put fair value in a range of about $170-$220 per share, which is above the current $159 price but still below the $238 analyst mean target. That range sits inside the broader analyst consensus band of $188-$$301, and I think the market is discounting some travel cyclicality while still giving credit for the company’s cash generation. Forward EPS is 12.4, and that looks richer than EXPE’s 24.5 only on an absolute basis; on a like-for-like basis, BKNG’s lower share price and stronger cash conversion make the earnings stream look more efficient than the raw EPS number suggests. I would not call the stock cheap, but I do think the current price understates the quality of the cash flow relative to the balance-sheet risk.
Leverage
BKNG — Leverage & Coverage (Quarterly)
| Metric | Value |
|---|---|
| Current Ratio (mrq) | 1.1 |
| Operating Cash Flow (TTM, USD Mil) | 9,859 |
| Levered Free Cash Flow (TTM, USD Mil) | 7,725.9 |
| Net Debt/EBITDA (TTM) | 0.4 |
| FCF Margin % (TTM) | 27.4% |
Source: Yahoo Finance — Quarterly Financial Statements
Total debt was $20.9B, but net debt/EBITDA was only 0.4x and the current ratio was 1.1x. Operating cash flow was $9.9B TTM and levered free cash flow was $7.7B, so the company has enough cash generation to service debt, fund buybacks, and still absorb a softer travel backdrop. That is why I am not worried about refinancing risk in the near term. The leverage profile is a support, not a constraint, and it gives management room to keep returning capital while the business works through the cycle.
Insider Activity
The insider tape is a negative signal. There were 0 open-market purchases and 179 open-market sales from 2025-02-24 to 2026-05-30, with sales concentrated among Peter J. Millones and Glenn D. Fogel. I do not read that as a thesis breaker, but it does tell me management is not signaling conviction through buying. In a stock that already trades on a fair multiple, that matters.
Comparable Analysis
Growth
| Company | Revenue TTM (USD Mil) | Revenue Growth YoY % | EBITDA TTM (USD Mil) | Diluted EPS TTM |
|---|---|---|---|---|
| BKNG | 28,241 | 8.1% | 10,413 | 9 |
| EXPE | 15,700 | 14.0% | 2,890 | 15.9 |
| ABNB | 13,159 | 16.5% | 2,761 | 4.4 |
| TCOM | 65,607 | 5.5% | 11,428.5 | 5.2 |
| MMYT | 1,060.7 | 6.2% | 175.6 | 0.2 |
| HTHT | 26,603 | 10.8% | 8,887 | 1.4 |
Source: Yahoo Finance
BKNG’s revenue growth of 8.1% TTM trails EXPE at 14.0% and ABNB at 16.5%, but it is ahead of TCOM at 5.5% and MMYT at 6.2%, and it is close to HTHT at 10.8%. I view that as a middle-of-the-pack growth profile for a much larger platform, which is exactly why the market should not pay a hyper-growth multiple for it. The key point is that BKNG still produced $28.2B of TTM revenue and $10.4B of EBITDA, so the scale is already there even if growth is more moderate.
Valuation
| Company | Current Share Price (USD) | Trailing P/E | Forward P/E | EV/Revenue | EV/EBITDA | Price/Sales (TTM) | Price/Book (mrq) | Market Cap (USD Mil) | Enterprise Value (USD Mil) | FCF Yield % (TTM) | Forward EPS | Analyst Target Price – Low | Analyst Target Price – Mean | Analyst Target Price – High | # Analyst Opinions |
|---|---|---|---|---|---|---|---|---|---|---|---|---|---|---|---|
| BKNG | 159 | 17.7 | 12.9 | 4.4 | 11.8 | 4.4 | -11.2 | 123,221 | 123,195 | 6.3% | 12.4 | 188 | 238 | 301 | 36 |
| EXPE | 265 | 16.7 | 10.8 | 2 | 10.9 | 2 | 26.3 | 31,805 | 31,630 | 10.8% | 24.5 | 235 | 338.2 | 430 | 36 |
| ABNB | 162.4 | 37 | 26.2 | 6.5 | 31.2 | 7.4 | 12.3 | 97,261 | 86,193 | 3.3% | 6.2 | 135 | 183.6 | 220 | 40 |
| TCOM | 38.1 | 7.4 | 9.3 | -0.4 | -2.3 | 0.4 | 1 | 23,985 | -26,851 | — | 4.1 | 42 | 58.4 | 68.1 | 29 |
| MMYT | 44.6 | 194 | 18 | 4.7 | 28.4 | 4 | -62.3 | 4,197 | 4,992 | 1.0% | 2.5 | 60 | 74.3 | 85 | 10 |
| HTHT | 41.8 | 29.8 | 13.1 | 1.2 | 3.6 | 0.5 | 6.1 | 13,178 | 31,658 | 56.0% | 3.2 | 44 | 60.5 | 65.9 | 17 |
Source: Yahoo Finance
BKNG trades at 11.8x EV/EBITDA, 4.36x EV/revenue, and 12.9x forward P/E, versus EXPE at 10.9x, 2.0x, and 10.8x, ABNB at 31.2x, 6.5x, and 26.2x, TCOM at -2.3x, -0.4x, and 9.3x, MMYT at 28.4x, 4.7x, and 18.0x, and HTHT at 3.6x, 1.2x, and 13.1x. On a growth-adjusted basis, BKNG looks more expensive than EXPE but far less demanding than ABNB, and I think that is reasonable given BKNG’s stronger cash conversion and lower leverage. The stock’s -26.6% 1-year total return also matters: the market has already de-rated the shares, so the current multiple is not asking investors to pay up for momentum.
Profitability
| Company | Operating Margin (TTM) | Net Margin (TTM) | Return on Assets (TTM) | Return on Equity (TTM) | Gross Margin (TTM) | EBITDA Margin (TTM) |
|---|---|---|---|---|---|---|
| BKNG | 34.4% | 25.5% | 20.4% | — | 87.2% | 36.9% |
| EXPE | 19.0% | 13.0% | 6.1% | 89.5% | 90.4% | 18.4% |
| ABNB | 21.0% | 20.4% | 6.1% | 34.5% | 82.9% | 21.0% |
| TCOM | -9.3% | 36.9% | 2.6% | 15.6% | 80.0% | 17.4% |
| MMYT | 15.3% | 3.2% | 3.0% | 2,868.7% | 58.6% | 16.6% |
| HTHT | 31.1% | 18.9% | 7.5% | 38.1% | 41.1% | 33.4% |
Source: Yahoo Finance
BKNG’s 34.4% operating margin and 36.9% EBITDA margin are well above EXPE’s 19.0% and 18.4%, ABNB’s 21.0% and 21.0%, MMYT’s 15.3% and 16.6%, and HTHT’s 31.1% and 33.4%. Its 20.4% ROA is also the best in the group. That is the cleanest reason I am not bearish on the stock despite the insider selling: BKNG is still the most efficient operator in the set, and the market is not ignoring that.
Leverage
| Company | Total Debt/Equity % (mrq) | Current Ratio (mrq) | Total Debt (mrq, USD Mil) | Operating Cash Flow TTM (USD Mil) | Free Cash Flow TTM (USD Mil) | Net Debt/EBITDA (TTM) | FCF Margin % (TTM) |
|---|---|---|---|---|---|---|---|
| BKNG | — | 1.1 | 20,924 | 9,859 | 7,725.9 | 0.4 | 27.4% |
| EXPE | 230.3 | 0.8 | 5,690 | 5,216 | 3,434.4 | -0.5 | 21.9% |
| ABNB | 32 | 1.4 | 2,496 | 4,860 | 3,206.9 | -3.5 | 24.4% |
| TCOM | 16.8 | 1.3 | 26,964 | — | — | -4.6 | — |
| MMYT | — | 3.1 | 1,436.1 | 167.4 | 41.2 | 3.8 | 3.9% |
| HTHT | 240.5 | 1.2 | 34,234 | 8,781 | 7,372.6 | 2.1 | 27.7% |
Source: Yahoo Finance
BKNG’s 0.4x net debt/EBITDA and 27.4% FCF margin compare favorably with EXPE’s -0.5x and 21.9%, ABNB’s -3.5x and 24.4%, MMYT’s 3.8x and 3.9%, and HTHT’s 2.1x and 27.7%. The debt balance is large in absolute dollars, but the cash flow base is larger still, which is why BKNG can support buybacks without looking stretched. That balance-sheet strength helps explain why the stock deserves a premium to weaker peers, even if it does not justify a full rerating.
Conclusion
I would put my rating as a hold because the core tension is between a high-quality cash generator and a valuation that already reflects much of that quality. BKNG’s 34.4% operating margin, 6.3% FCF yield, and 0.4x net debt/EBITDA are strong enough to keep the thesis intact, but the shares are not cheap enough to call a buy when the market is already paying 11.8x EV/EBITDA and 12.9x forward earnings.
I would raise my rating toward a buy if room-night growth stays above 5% in Q3 2026 and Q4 2026 while EBITDA margin remains near 36.9%, because that would show the company can keep turning travel demand into earnings without sacrificing discipline. A move in FCF yield toward 7.5% would also matter, because that would mean roughly $9.3B of levered free cash flow on the current market cap and would make the stock look materially cheaper for a business with this balance-sheet flexibility.
The main downside case is a travel slowdown that pushes revenue growth back toward the low single digits and drags operating margin into the high 20s. If that happens for two consecutive quarters, I would move from hold to sell, because the market would then be paying a fair multiple for a business whose earnings power is no longer expanding fast enough to justify it. The insider selling is a warning sign, but it is not yet enough on its own to override the cash-flow strength.
What to Watch Next
- Q3 2026 room-night growth above 5% — would support a move toward Buy.
- EBITDA margin near 36.9% — would confirm earnings are still scaling well.
- FCF yield near 7.5% — would make the stock look materially cheaper.
- Operating margin in the high 20s for two quarters — would support a move toward Sell.
- Net debt/EBITDA staying near 0.4x — would keep the balance-sheet case intact.
What’s your take? I rated Booking Holdings (BKNG) HOLD above — but the goal here is to get this right, not just to publish an opinion. What would you add to this analysis, or which risk or catalyst do you think I’m under- or over-weighting? Tell me in the comments.
Sources
- SEC 10-K Annual Report — filed 2026-02-18
- SEC 8-K Filing (2026-06-02)
- SEC 8-K Filing (2026-05-11)
- SEC 8-K Filing (2026-05-07)
- SEC 8-K Filing (2026-04-28)
- SEC 8-K Filing (2026-04-02)
- SEC 8-K Filing (2026-04-02)
- SEC Form 4 Insider Transaction (2026-06-02)
- SEC Form 4 Insider Transaction (2026-06-02)
- SEC Form 4 Insider Transaction (2026-06-02)
- SEC 10-K Annual Report — FY2026
- SEC 10-K Annual Report — FY2025
- SEC 10-K Annual Report — FY2024
- SEC 10-K Annual Report — FY2023
- SEC 10-K Annual Report — FY2022
Data sourced from Yahoo Finance and SEC EDGAR. Not investment advice.
Leave a Comment