
| Company | Oct 25 | Nov 25 | Dec 25 | Jan 26 | Feb 26 | Mar 26 | Apr 26 | May 26 | Jun 26 | Jul 26 | Aug 26 | Sep 26 | 12-Mo |
|---|---|---|---|---|---|---|---|---|---|---|---|---|---|
| VISN | +12% | +14% | -8% | -1% | -2% | +4% | +44% | -2% | +2% | -8% | -6% | -5% | +39% |
| HLIT | +5% | -11% | +3% | -2% | +9% | -16% | +27% | +32% | +8% | -29% | +4% | -12% | +4% |
| ITRN | +8% | +4% | +9% | +4% | +8% | +5% | +18% | +14% | -6% | -10% | -8% | +1% | +52% |
| GILT | +11% | -20% | +11% | +49% | -18% | -6% | +23% | -7% | -22% | -17% | -10% | -0% | -24% |
| CALX | +11% | -19% | -4% | -16% | +16% | -5% | -11% | -9% | -6% | -4% | +6% | -10% | -44% |
| NTGR | +7% | -24% | -7% | -15% | -1% | +6% | +16% | +3% | -10% | +3% | -12% | +5% | -31% |
Source: Yahoo Finance monthly adjusted close.
Quick Thesis
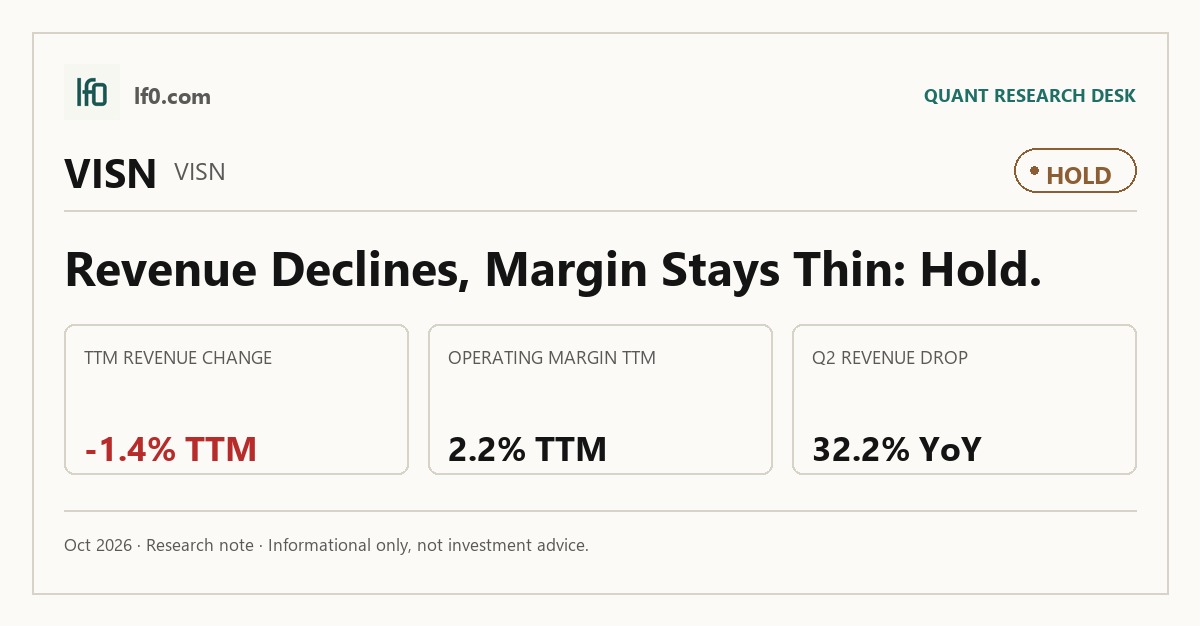
- Rated Hold — balance-sheet support is real, but operating margin is still only 2.2% TTM.
- Strongest strength: net debt/EBITDA was -0.2x TTM, so leverage is not the constraint.
- Biggest risk: revenue fell 1.4% TTM, and Q2 2026 revenue dropped 32.2% year over year to $319.6M.
- Valuation is cheap on headline multiples at 0.7x EV/Revenue and 8.9x forward P/E, but not on execution.
- I would raise my rating if operating margin moves above 5.0%, meaning the core business clears fixed costs durably.
Executive Summary
Rating: HOLD | VISN
Measured from adjusted close on n/a to 2026-10-02. Sell ratings are correct when the stock falls; Hold is tracked as a +/-10% range. Daily-close data, not intraday. Calls are tracked for 182 days from publication, then frozen as a final record.
I would put my rating as a Hold because Vistance has enough liquidity and balance-sheet flexibility to keep working through the portfolio reset, but the operating line still does not justify a more aggressive call. The stock trades at 0.7x EV/Revenue and 8.9x forward P/E, while net debt is negative at 0.2x EBITDA and free cash flow is positive at $5.2M TTM, so the downside is not coming from leverage; the issue is that revenue fell 1.4% TTM and operating margin was only 2.2% TTM, which tells me the core business is still under-earning its asset base.
I would raise my rating more towards a Buy if operating margin moved above 5.0%, meaning the core business is earning a real profit before unusual items, and if that improvement came with at least one more quarter of positive revenue growth after the 2026 portfolio reset. On the current $2B revenue base, a move from 2.2% to 5.0% operating margin would add roughly $56M of annual operating profit, which would materially improve the deleveraging timeline and make the current 8.9x forward P/E easier to justify.
I would move from Hold to Sell if revenue stays negative through the next two quarters and operating margin slips back toward a positive margin, because that would show the 2025 gross margin improvement is not flowing through to the bottom line. The more damaging version of that bear case is a customer concentration shock: if the top customer’s 35.0% share of 2025 sales translates into even a partial order cut, the company would likely lose both revenue and cash collection at the same time, which would quickly erase the current free-cash-flow cushion.
Company Profile
Vistance Networks is a global provider of communications infrastructure that sells hardware, software, and services used to deliver media, voice, Internet Protocol data, and Wi-Fi to homes, enterprises, cable operators, and telecom carriers. Its 2025 revenue was $1.93B, with about $0.7B from RUCKUS, which supplies enterprise wireless networks and software, and about $1.2B from Aurora, which supplies cable modem termination systems, video infrastructure, and broadband access equipment.
The company was founded as an independent business in 1976, incorporated in Delaware in 2010, and went public in 2013. It changed its legal name from CommScope Holding Company, Inc. to Vistance Networks, Inc. on January 14, 2026. As of December 31, 2025, it employed about 4,500 people and served customers in over 70 countries. The stock is listed on the New York Stock Exchange under COMM. The business is financed with a mix of operating cash flow and debt, and it has been reshaped since 2021 through divestitures, the Casa Systems asset acquisition in 2024, and the January 2026 CCS segment sale.
Economic Moat
Business Model
The direct relationships with substantially all the leading global telecommunications operators, data center managers, cable television providers or MSOs, and thousands of enterprise customers are the hardest part of this model to replicate within 3 years, in my view, because the current 10-K shows long-standing customer ties, a direct sales force, and a global network of channel partners already embedded in the buying process. That reach is reinforced by global manufacturing and distribution scale, which lets Vistance serve customers in over 70 countries with about 4,500 people and a broad mix of in-house and contract manufacturing.
I also see a secondary advantage in the portfolio depth around RUCKUS and Aurora, since the company is a leader in digital video and IP television distribution systems, broadband access infrastructure platforms, and enterprise wireless networks, and it spent $283.5M on research and development in 2025 to keep those products current. The patent base is meaningful too, with over 2,700 patents and patent applications and over 590 registered trademarks and trademark applications worldwide, although 228 issued patents, or 12%, expire over the next five years, so the intellectual property edge is real but not permanent.
In my view, the moat is not a single technology lock-in; it is the combination of customer access, channel reach, and product breadth, which is harder to copy quickly than any one product line.
Business & Operating Risks
A limited customer base is the most immediate risk here. According to the risk factors in their SEC 10-K, Vistance derived approximately 35.0% of consolidated net sales from its top customer in 2025, and it also relies on channel partners that have experienced financial difficulties in the past and can delay payment or default. That concentration can cut both revenue and cash collection at the same time, so the financial data in this article already shows the risk is material: a 35.0% customer share means even a partial order reduction would hit reported sales and working capital quickly.
Competitive pressure is the second major risk, and the filing is specific about where it comes from. Vistance faces a substantial number of foreign and domestic companies, including rivals that can bundle products, use price-driven auctions, and exploit the shift toward virtualization, distributed access architecture, DOCSIS 4.0, PON, and Wi-Fi. That matters because the company itself says some operators may not align on distributed access architecture implementations and that new software-based competitors could subsume product functionality, which means the risk is not generic competition but technology displacement.
Supply chain and manufacturing execution are the third risk cluster, and they are tightly linked. The 10-K says Vistance depends on commodity-linked inputs such as aluminum, copper, steel, optical fiber, capacitors, memory devices and silicon chips, plus a limited number of logistics suppliers and contract manufacturers, and it warns that shortages, shipping delays, or capacity constraints could limit its ability to meet demand. The company also disclosed that it experienced lost sales opportunities in the past due to lack of capacity, which makes this an operating risk rather than boilerplate.
Taken together, these risks pressure the customer-access moat more than the product moat: the franchise still looks differentiated, but concentration and technology shifts can weaken the pricing power that the channel network was supposed to protect.
Management Discussion & Analysis
Management is still treating the portfolio reset as the central capital-allocation priority, and the 2025 numbers show why that stance makes sense. Vistance recorded $19.7M of net restructuring costs in 2025 and expects more such charges in 2026, while also saying those cash requirements could be material, which tells me the transformation is not finished and still consumes cash.
The balance-sheet signal is more constructive because long-term debt fell to $7.3B at December 31, 2025 from $9.2B at December 31, 2024, and cash and cash equivalents rose to $922.8M from $663.3M, so management has clearly used divestiture proceeds to de-risk the capital structure rather than fund a new acquisition binge. That said, the company also says it may seek to amend, refinance, restructure, exchange or repurchase debt and may raise equity if needed, which means the current liquidity improvement is real but not yet a clean end-state.
The operating narrative is better supported by the numbers than in prior years: net sales rose 39.7% to $1.9B in 2025, gross profit margin expanded to 49.5% from 43.8%, and Core adjusted EBITDA reached $379.4M, so the claim that cost actions and portfolio optimization are helping is backed by the 2025 results. Even so, the company still expects the CCS-related corporate costs to be reallocated to the remaining segments in the first quarter of 2026, which means part of the margin benefit from the 2025 portfolio cleanup will be tested again next year.
Management’s message is therefore consistent with the risk profile: it is actively addressing leverage and portfolio complexity, but the concentration and execution risks are still live.
Recent Events
The most significant development I see here is the April 29, 2026 agreement to sell the RUCKUS reporting segment to Belden for $1.846B in cash, with closing expected in the second half of 2026. That is a major portfolio reset, and it strengthens the thesis if the remaining business is the higher-quality core because it turns a complex telecom hardware group into a more focused company with a large cash inflow and fewer moving parts.
On April 7, 2026, Vistance also put in place a new $300M senior secured revolving credit facility with Citibank, expandable by $150M, maturing in April 2031. I view that as a liquidity backstop rather than a growth signal. The springing Covenant Fixed Charge Coverage Ratio of 1.00x only bites when availability falls below the stated threshold, so the facility gives the company flexibility while the RUCKUS sale is pending, but it also shows lenders are still demanding tight asset-based discipline.
The April 30, 2026 board authorization to repurchase up to $100M of stock, doubled from the prior $50M program, is a clear capital-allocation signal. In my view, that supports the equity case only if the post-divestiture balance sheet remains strong enough to fund buybacks without weakening the core business.
Taken together, these disclosures strengthen the investment case because the company is monetizing a major asset, securing liquidity, and signaling willingness to return capital.
Financial Analysis
Growth
VISN — Financial Growth (Quarterly, USD Mil)
| Metric | 2025-06-30 | 2025-09-30 | 2025-12-31 | 2026-03-31 | 2026-06-30 |
|---|---|---|---|---|---|
| REVENUE (USD Mil) | 324.1 | 1,629.7 | -2,198.4 | 471.8 | 319.6 |
| EBIT (USD Mil) | 8.4 | 304.1 | -628.5 | 32.2 | -1.8 |
| EBITDA (USD Mil) | 83.6 | 378.8 | -579.4 | 71.3 | 21.6 |
| NET INCOME (USD Mil) | 31.8 | 108.4 | 1,359.5 | 5,508 | 295.2 |
| DILUTED EPS | 0.1 | 0.4 | 6 | 23.1 | 1.2 |
Source: Yahoo Finance — Quarterly Financial Statements
Revenue is lumpy rather than steadily compounding. Q2 2025 revenue was $324.1M, Q3 2025 jumped to $1.6B, then Q4 2025 swung to $-2.2B before rebounding to $471.8M in Q1 2026 and $319.6M in Q2 2026. The Q2 2026 figure was down 32.2% year over year versus $471.8M in Q2 2025, while EBITDA moved from $83.6M in Q2 2025 to $21.6M in Q2 2026, so earnings are weakening faster than sales.
The MD&A points to transformation costs and divestitures, so the swing looks event-driven rather than seasonal. I would not read the latest quarter as a clean demand signal; it is better understood as a business still being reshaped.
Profitability
VISN — Profitability (TTM)
| Metric | TTM |
|---|---|
| Operating Margin (TTM) | 2.2% |
| Net Margin (TTM) | 365.4% |
| Return on Assets (TTM) | 1.4% |
| Return on Equity (TTM) | 4.3% |
| Gross Margin (TTM) | 47.0% |
| EBITDA Margin (TTM) | 15.5% |
Source: Yahoo Finance — Trailing Twelve Months (TTM)
TTM gross margin of 47.0% and EBITDA margin of 15.5% show that Vistance still keeps nearly half of revenue after direct costs, but the 31.5-point gap to EBITDA margin points to heavy operating expense and restructuring drag rather than a pricing problem. TTM operating margin of 2.2% is barely positive, so the business is only just clearing fixed costs after years of transformation spending.
TTM return on assets of 1.4% and TTM return on equity of 4.3% are both low, and the ROE premium over ROA suggests returns are being amplified by leverage rather than by strong underlying asset productivity. I would weight the move in operating margin above 5.0%, meaning the core business is earning a real profit before unusual items, more heavily than the net margin, because that is the level that would show the operating model is finally scaling.
The profitability profile is still early-stage, but the gross margin and operating margin combination is consistent with a business that can improve if volume stabilizes and restructuring costs fade.
Valuation
VISN — Valuation Multiples
| Metric | Value |
|---|---|
| Current Share Price (USD) | 6.2 |
| Market Cap (USD Mil) | 1,432 |
| Enterprise Value (USD Mil) | 1,358 |
| Trailing P/E | — |
| Forward P/E | 8.9 |
| Price/Sales (TTM) | 0.7 |
| Price/Book (mrq) | 0.6 |
| EV/Revenue | 0.7 |
| EV/EBITDA | 4.4 |
| Beta (5Y Monthly) | 1.92 |
| FCF Yield % (TTM) | 0.4% |
| Forward EPS (USD) | 0.7 |
| Analyst Target Price – Low (USD) | 12 |
| Analyst Target Price – Mean (USD) | 14.7 |
| Analyst Target Price – High (USD) | 17 |
| # Analyst Opinions | 3 |
Source: Yahoo Finance
Vistance Networks trades at 0.7x EV/Revenue and 0.7x price to sales on TTM results, with a 4.4x EV/EBITDA multiple and an 8.9x forward P/E. At a current share price of $6.21, the market is pricing in a business that stays cash generative but does not need much growth to justify the quote, which fits a transformation name still working through restructuring and portfolio changes.
The 0.4% FCF yield is modest, but it is positive, so the equity is not being valued as a cash burner. The 2.9 PEG ratio points to a valuation that is not cheap relative to expected growth, while the 1.9 beta and 59.3% 52-week decline show the stock has already been de-rated hard. Analyst targets of $12 to $17 across 3 opinions sit well above the current price, which tells me the market is still discounting the reset more heavily than the sell-side consensus does.
On the analysis here, I would put fair value in a range of roughly $4.7-$21.8 per share using peer EV/Revenue as a starting point, then adjusting for the company’s weaker growth and thin operating margin. That range sits below the $14.7 analyst mean target, which makes sense to me because I weight the 2.2% operating margin and 1.4% revenue decline more heavily than the consensus appears to. The implied EPS range is narrower: with forward EPS at $0.696 and peers ranging from $0.5 at NTGR to $3.8 at ITRN, I think Vistance belongs toward the lower end of the peer earnings band until the margin structure improves. On a like-for-like basis, that leaves the stock cheaper than the higher-quality growers on raw earnings, but not obviously cheap once the weak growth and leverage-adjusted cash conversion are included.
Overall, the valuation picture is a hold case rather than a clear bargain. The market is paying for the balance sheet and the reset, but not yet for durable earnings power.
Leverage
VISN — Leverage & Coverage (Quarterly)
| Metric | Value |
|---|---|
| Total Debt/Equity % (mrq) | 1.6 |
| Current Ratio (mrq) | 2.6 |
| Total Debt (mrq, USD Mil) | 39.4 |
| Net Debt/EBITDA (TTM) | -0.2 |
| FCF Margin % (TTM) | 0.3% |
Source: Yahoo Finance — Quarterly Financial Statements
Vistance Networks has a modest debt load and solid near-term liquidity. Total Debt/Equity was 1.6, Current Ratio was 2.6, and Total Debt was $39.4M, so the balance sheet is not stretched.
Operating Cash Flow was $133.3M TTM and Levered Free Cash Flow was $5.2M TTM, which means EBITDA is converting to cash, but most of it is being absorbed by restructuring, transformation, and integration costs rather than dropping through to equity holders. Net Debt/EBITDA was -0.2x, so cash exceeds debt on a net basis, and FCF Margin was 0.3%, a thin margin that leaves little cushion if demand softens or transformation spending stays elevated.
In my view, this is low refinancing risk today because cash and operating cash flow cover the debt stack comfortably, but the cash buffer could tighten if the 2026 transformation charges remain material. Leverage is a support for the thesis, not the thesis itself.
Insider Activity
| Date | Insider | Role | Type | Shares | Price |
|---|---|---|---|---|---|
| No open-market insider transactions recorded in the available filing window. |
The insider transaction record I see here shows no open-market purchases or sales in the 2025-02-24 to 2026-06-01 window, so the sample is limited to awards and tax withholding activity. In aggregate, that leaves me with no directional read on insider conviction from market-price transactions, and it suggests alignment is being maintained through compensation rather than voluntary buying or selling.
Comparable Analysis
Growth
| Company | Revenue TTM (USD Mil) | Revenue Growth YoY % | EBITDA TTM (USD Mil) | Diluted EPS TTM |
|---|---|---|---|---|
| VISN | 1,989.9 | -1.4% | 307.8 | -0.1 |
| HLIT | 443.9 | 53.5% | 64.1 | 0.2 |
| ITRN | 393.2 | 20.7% | 105.1 | 3.2 |
| GILT | 487.8 | 16.9% | 56.1 | 0.4 |
| CALX | 1,111.2 | 21.3% | 79.1 | 0.8 |
| NTGR | 694.4 | -1.2% | -13.7 | -0.9 |
Source: Yahoo Finance
VISN’s revenue fell 1.4% TTM to $2B, while HLIT grew 53.5%, ITRN 20.7%, GILT 16.9%, and CALX 21.3%, with NTGR down 1.2%. That puts VISN at the weak end of the set on top-line direction, so its 0.7x EV/Revenue is a discount that looks justified rather than excessive, especially against HLIT’s 2.5x and ITRN’s 2.4x.
Valuation
| Company | Current Share Price (USD) | Trailing P/E | Forward P/E | EV/Revenue | EV/EBITDA | Price/Sales (TTM) | Price/Book (mrq) | Market Cap (USD Mil) | Enterprise Value (USD Mil) | Beta (5Y Monthly) | FCF Yield % (TTM) | Forward EPS | Analyst Target Price – Low | Analyst Target Price – Mean | Analyst Target Price – High | # Analyst Opinions |
|---|---|---|---|---|---|---|---|---|---|---|---|---|---|---|---|---|
| VISN | 6.2 | — | 8.9 | 0.7 | 4.4 | 0.7 | 0.6 | 1,432 | 1,358 | 1.92 | 0.4% | 0.7 | 12 | 14.7 | 17 | 3 |
| HLIT | 11.2 | 48.6 | 13.8 | 2.5 | 17.4 | 2.7 | 3.4 | 1,218 | 1,117 | 1.32 | 5.8% | 0.8 | 8 | 16.1 | 20 | 7 |
| ITRN | 52.5 | 16.3 | 13.9 | 2.4 | 9 | 2.6 | 4.8 | 1,042 | 946 | 0.79 | 6.0% | 3.8 | 69 | 74.5 | 80 | 2 |
| GILT | 10 | 22.8 | 13.1 | 1.3 | 11.1 | 1.6 | 1.4 | 773 | 623 | 1.06 | 2.5% | 0.8 | 18.4 | 19.2 | 20 | 2 |
| CALX | 34.8 | 45.8 | 15.1 | 1.8 | 25.4 | 2 | 3.1 | 2,192 | 2,011 | 1.25 | 2.8% | 2.3 | 52 | 62.3 | 85 | 6 |
| NTGR | 23.6 | — | 43.9 | 0.6 | -30.6 | 0.9 | 1.4 | 640 | 418 | 1.18 | -1.4% | 0.5 | 34 | 35 | 36 | 3 |
Source: Yahoo Finance
VISN’s 0.4% FCF yield TTM is far below HLIT’s 5.8%, ITRN’s 6.0%, GILT’s 2.5%, CALX’s 2.8%, and NTGR’s -1.4%, so the stock is not being rewarded for cash conversion the way ITRN and HLIT are. On forward earnings, VISN trades at 8.9x versus HLIT at 13.8x, ITRN at 13.9x, GILT at 13.1x, CALX at 15.1x, and NTGR at 43.9x, while its $0.696 forward EPS is well below ITRN’s $3.8 and CALX’s $2.3, which tells me the market is paying less for VISN because it has less earnings power today.
Using peer EV/Revenue of 0.6x to 2.5x on VISN’s $2B revenue gives an illustrative enterprise value of about $1.2B to $5B, or roughly $4.7 to $21.8 per share after netting $39.4M of debt and $113.6M of cash and dividing by 230.6M shares; that range brackets the $6.21 current price and says the stock is not obviously mispriced on revenue alone. The lower multiple is easier to defend because VISN’s growth is weaker than the peer set, while the upper end would require a cleaner margin profile than the company has shown so far.
Profitability
| Company | Operating Margin (TTM) | Net Margin (TTM) | Return on Assets (TTM) | Return on Equity (TTM) | Gross Margin (TTM) | EBITDA Margin (TTM) |
|---|---|---|---|---|---|---|
| VISN | 2.2% | 365.4% | 1.4% | 4.3% | 47.0% | 15.5% |
| HLIT | 18.0% | -10.6% | 4.7% | 6.5% | 50.0% | 14.4% |
| ITRN | 22.7% | 16.3% | 13.9% | 30.2% | 50.0% | 26.7% |
| GILT | 9.5% | 6.2% | 3.0% | 7.0% | 30.3% | 11.5% |
| CALX | 7.4% | 4.6% | 4.1% | 6.9% | 56.6% | 7.1% |
| NTGR | -4.4% | -3.7% | -2.0% | -5.3% | 40.0% | -2.0% |
Source: Yahoo Finance
Profitability is the main reason VISN deserves a discount. Its gross margin of 47.0% is below ITRN’s 50.0% and CALX’s 56.6%, but above GILT’s 30.3% and NTGR’s 40.0%, so VISN sits mid-pack on product economics. The bigger issue is operating margin: VISN at 2.2% is far below HLIT’s 18.0%, ITRN’s 22.7%, and GILT’s 9.5%, which points to an opex and scale gap rather than a pure cost-of-revenue problem.
EBITDA margin of 15.5% is closer to HLIT’s 14.4% and above GILT’s 11.5%, so the business is not broken, but the thin operating margin says overhead is still absorbing too much of the gross profit. That gap between gross margin and operating margin is the key reason the market should not pay a premium multiple yet.
Leverage
| Company | Total Debt/Equity % (mrq) | Current Ratio (mrq) | Total Debt (mrq, USD Mil) | Operating Cash Flow TTM (USD Mil) | Free Cash Flow TTM (USD Mil) | Net Debt/EBITDA (TTM) | FCF Margin % (TTM) |
|---|---|---|---|---|---|---|---|
| VISN | 1.6 | 2.6 | 39.4 | 133.3 | 5.2 | -0.2 | 0.3% |
| HLIT | 36.1 | 3 | 130.1 | 62.3 | 71 | -1.6 | 16.0% |
| ITRN | 1.8 | 2 | 4.2 | 101.2 | 62.3 | -0.9 | 15.8% |
| GILT | 1.8 | 2 | 9.6 | 8.1 | 19.6 | -2.7 | 4.0% |
| CALX | 2 | 2.8 | 14 | 109.5 | 61.5 | -2.3 | 5.5% |
| NTGR | 10 | 2.5 | 45.8 | 3.6 | -9.2 | 16.3 | -1.3% |
Source: Yahoo Finance
Leverage is a clear strength. VISN’s net debt/EBITDA is -0.2x, better than NTGR’s 16.3x and comfortably ahead of the rest of the group on balance-sheet risk, even if HLIT, ITRN, GILT, and CALX are all also net cash positions. VISN’s debt/equity of 1.6 and current ratio of 2.6x are conservative, and its $5.2M of free cash flow TTM is modest but positive, which means the balance sheet is not the constraint on the equity story.
That lower leverage helps explain why VISN can trade at a lower EV/Revenue multiple than peers without looking distressed. The market is not paying for financial risk here; it is paying for a slower growth and lower-margin profile.
Conclusion
I would put my rating as a Hold because the balance sheet gives Vistance time, but the earnings base still needs proof that the 2026 reset can hold. The market has already given the stock credit for a recovery, and I do not want to pay ahead of a margin inflection that has not yet shown up in the reported numbers.
The bull case is straightforward. If operating margin moves above 5.0%, meaning the core business is clearing fixed costs on a durable basis, and if that improvement comes with at least one more quarter of positive revenue growth after the portfolio reset, I would move more towards a Buy. On the current $2B revenue base, that margin step-up would add roughly $56M of annual operating profit, which would materially improve the deleveraging timeline and make the current 8.9x forward P/E easier to justify. I would also want to see the RUCKUS sale close cleanly and the remaining portfolio hold its gross margin near the current 47.0%, because that would show the reset is improving quality rather than just shrinking the company.
The bear case is equally clear. If revenue stays negative through the next two quarters and operating margin slips back toward a positive margin, I would move from Hold toward Sell because that would show the 2025 gross margin improvement is not flowing through to the bottom line. The more damaging version of that bear case is a customer concentration shock: if the top customer’s 35.0% share of 2025 sales translates into even a partial order cut, the company would likely lose both revenue and cash collection at the same time, which would quickly erase the current free-cash-flow cushion. I would also watch whether the 2026 restructuring charges stay material, because persistent charges would tell me the reset is still consuming too much of the operating gain.
Weighing both sides, I lean to Hold rather than Buy because the balance sheet gives Vistance time, but the operating recovery still has to prove itself in the numbers. The stock already reflects a fair amount of optimism, and the next leg higher depends on margin improvement that is visible, sustained, and not just the result of asset sales.
What to Watch Next
- Operating margin above 5.0% — would support moving the rating toward Buy.
- At least one more quarter of positive revenue growth — would show the reset is translating into demand stability.
- RUCKUS sale closing cleanly — would confirm the portfolio simplification thesis.
- Top-customer concentration easing below 35.0% of sales — would reduce the biggest single revenue risk.
- Restructuring charges falling from 2025’s $19.7M level — would show cash conversion is improving.
What’s your take? I rated Vistance Networks (VISN) HOLD above — but the goal here is to get this right, not just to publish an opinion. What would you add to this analysis, or which risk or catalyst do you think I’m under- or over-weighting? Tell me in the comments.
Sources
- SEC 10-K Annual Report — filed 2026-02-26
- SEC 8-K Filing (2026-05-08)
- SEC 8-K Filing (2026-05-05)
- SEC 8-K Filing (2026-04-30)
- SEC 8-K Filing (2026-04-30)
- SEC 8-K Filing (2026-04-08)
- SEC 8-K Filing (2026-04-08)
- SEC Form 4 Insider Transaction (2026-06-03)
- SEC Form 4 Insider Transaction (2026-06-03)
- SEC Form 4 Insider Transaction (2026-06-03)
- SEC 10-K Annual Report — FY2026
- SEC 10-K Annual Report — FY2025
- SEC 10-K Annual Report — FY2024
- SEC 10-K Annual Report — FY2023
- SEC 10-K Annual Report — FY2022
Data sourced from Yahoo Finance and SEC EDGAR. Not investment advice.
Leave a Comment