
| Company | Jul 25 | Aug 25 | Sep 25 | Oct 25 | Nov 25 | Dec 25 | Jan 26 | Feb 26 | Mar 26 | Apr 26 | May 26 | Jun 26 | 12-Mo |
|---|---|---|---|---|---|---|---|---|---|---|---|---|---|
| FLNC | +21% | -9% | +46% | +94% | -6% | +1% | +56% | -49% | -11% | -11% | +55% | +5% | +196% |
| STEM | +109% | +16% | +16% | +12% | -12% | -13% | +4% | -33% | -16% | +21% | -9% | -20% | +25% |
| ESS | -8% | +4% | +0% | -6% | +5% | -1% | -3% | +1% | -4% | +9% | +4% | +8% | +7% |
| ENVX | +30% | -28% | +4% | +20% | -35% | -6% | -9% | -20% | -2% | +29% | +20% | -24% | -41% |
| BE | +56% | +42% | +60% | +56% | -17% | -20% | +74% | +3% | -13% | +109% | +1% | +6% | +1165% |
Source: Yahoo Finance monthly adjusted close.
Quick Thesis
This Fluence Energy stock analysis reviews FLNC cash burn, backlog quality, short interest, valuation, gross margins, liquidity, and execution risk.
Quick thesis: FLNC has a large energy-storage opportunity, but the stock depends on backlog quality, margin execution, liquidity, and whether short interest is correctly pricing operational risk.
| Factor | Why it matters |
|---|---|
| Backlog quality | Shows whether demand can become profitable revenue. |
| Cash burn | Measures liquidity pressure. |
| Short interest | Frames market skepticism and squeeze risk. |
| Gross margin | Shows project execution quality. |
| Valuation | Determines whether growth offsets execution risk. |
Executive Summary
Rating: SELL | FLNC
Measured from adjusted close on 2026-07-23 to 2026-10-21. Sell ratings are correct when the stock falls; Hold is tracked as a +/-10% range. Daily-close data, not intraday. Calls are tracked for 182 days from publication, then frozen as a final record.
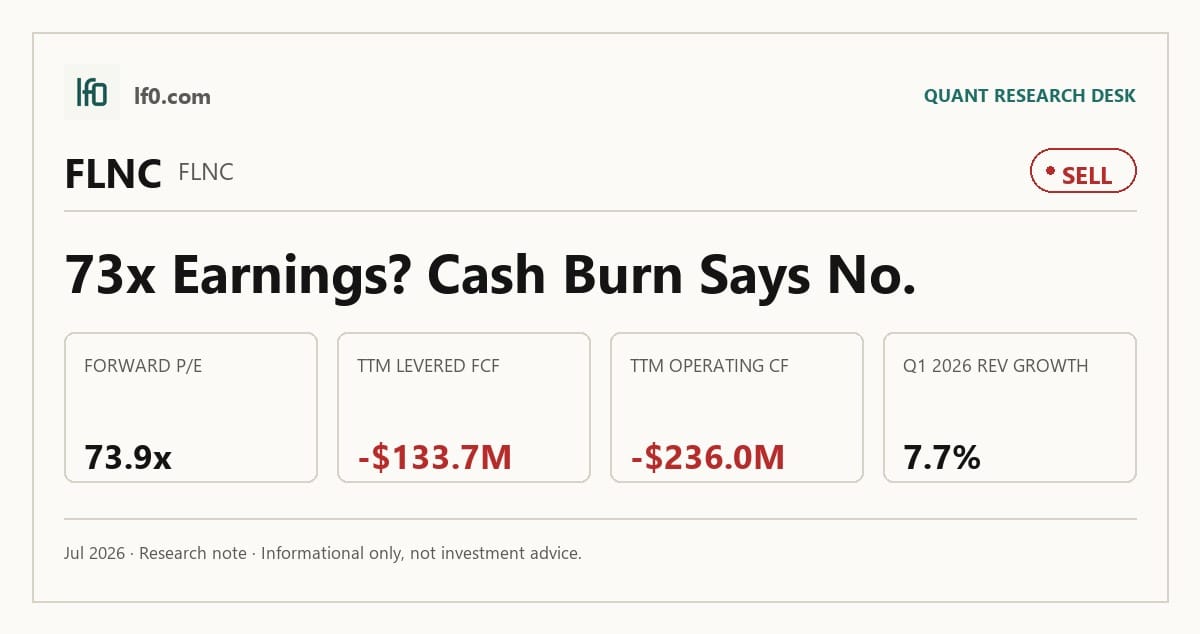
I would put my rating as a Sell because Fluence Energy is still growing without proving that growth can convert into durable cash, and the market is already discounting a recovery that has not shown up in the latest twelve months. Revenue was $464.9M in Q1 2026, up 7.7% from $431.6M in Q1 2025, but EBITDA was still -$28.5M and levered free cash flow was -$133.7M TTM, so the equity case still depends on financing rather than self-funding operations. I feel the software stack and installed base are real strengths, yet they are not enough on their own to offset negative cash generation and a 39.0% short interest on float. I would move more toward a Buy only if backlog conversion lifts operating margin into positive territory and free cash flow turns positive, because that would show the model is finally scaling rather than merely expanding.
Company Profile
Fluence Energy, Inc. was formed on June 21, 2021 and listed on Nasdaq under FLNC after its IPO on November 1, 2021. It operates through Fluence Energy, LLC, a joint venture formed on June 30, 2017 by Siemens Industry, Inc. and AES Grid Stability, LLC that began operations on January 1, 2018. The company designs and sells utility-scale battery energy storage systems, delivery services, recurring operations and maintenance services, and cloud software, including Fluence Mosaic and Fluence Nispera. As of September 30, 2024, it had 5.0 GW deployed, 7.5 GW of contracted backlog, and a 115.9 GW global pipeline across 33 markets in 25 countries. It also had 1,595 employees across 14 countries. Fluence is financed through Fluence Energy, LLC, with Class A common stock publicly traded and Class B common stock held by the continuing equity owners.
Economic Moat
Business Model
The integrated software and hardware stack around Fluence OS, the company’s energy management system, is the most defensible part of the model because it is embedded across the storage system and tied to operating data. In my view, that makes it harder for a well-funded competitor to copy quickly than a standalone hardware offering. Fluence also had over 179 granted patents worldwide, over 82 patent applications pending, and over 108 registered trademarks as of September 2024, while holding a perpetual license to certain AES and Siemens intellectual property covering cooling inverters, overvoltage protections, and large data transfer methods. That combination supports product performance, safety, and customer lock-in at the system level, not just at the component level. A second advantage is domestic content manufacturing: Fluence initiated domestic production of battery modules in Utah in September 2024, which should help it qualify for Inflation Reduction Act incentives and reduce tariff exposure, although I view that layer as more execution-dependent than the software stack.
Business & Operating Risks
Customer concentration is the clearest disclosed risk. According to the risk factors in their SEC 10-K, the two largest customers accounted for approximately 50.0% of fiscal 2024 revenue and AES and its affiliates alone were approximately 41.0%. The amended and restated storage core frame purchase agreement with AES Grid Stability runs until the earlier of October 27, 2028 or when AES Grid Stability falls below 10.0% of voting power, so the loss of that preferred channel would remove a meaningful source of order volume just as the company is trying to scale. Manufacturing scale and supplier dependence are the next pressure point because Fluence depends on two major contract manufacturers and, for domestic content offerings, a single U.S. battery cell supplier. That can delay deliveries, raise unit costs, and force prepayments that absorb working capital. Project execution is another risk: projects typically run approximately twelve to eighteen months from contract execution to substantial completion, and amounts in pipeline and contracted backlog may not translate into revenue or profit. The Barrick-style dispute risk is not the issue here; the disclosed risks are more about concentration, supply chain, and execution than about a direct threat to the software moat itself.
Management Discussion & Analysis
Management is responding to the disclosed risks by preserving liquidity and widening the manufacturing base, but the concentration issue remains. The 2024 Revolver was expanded to $400.0 million on August 6, 2024, with $74.9 million of letters of credit outstanding and $425.1 million of remaining availability as of September 30, 2024, which tells me the priority is contract support and working-capital flexibility rather than balance-sheet repair. That reading is reinforced by the $71.5 million of receivables sold under the Master Receivables Purchase Agreement in fiscal 2024 and the $81.3 million of payables still subject to supply chain financing as of September 30, 2024. Management also expects R&D expenses to generally increase, intends to expand sales presence into additional countries, and is investing in additional product testing labs in Pennsylvania, Erlangen, Germany, Long Beach, California, and Bangalore, India. I see that as a deliberate attempt to deepen the platform, but it also means the company is still leaning on external financing while it scales. The operating plan is therefore constructive on growth, yet it does not fully neutralize the customer concentration and project-timing risks surfaced above.
Recent Events
The most important recent development is the 38 Form 4 filings showing net selling, with $478.4M of open-market sales versus $869,470 of open-market purchases across 38 filings. The selling is concentrated in two very large transactions on 2026-05-15, while the buying was broader but much smaller and clustered in early 2025, so alignment looks weaker at the margin. I read that as a caution flag rather than a thesis breaker, but it does not help the case when the company is still dependent on external financing.
Financial Analysis
Growth
FLNC — Financial Growth (Quarterly, USD Mil)
| Metric | 2025-03-31 | 2025-06-30 | 2025-09-30 | 2025-12-31 | 2026-03-31 |
|---|---|---|---|---|---|
| REVENUE (USD Mil) | 431.6 | 602.5 | 1,041.9 | 475.2 | 464.9 |
| EBIT (USD Mil) | -45.1 | 4 | 48.4 | -63.1 | -39.2 |
| EBITDA (USD Mil) | -38.9 | 12.3 | 58.8 | -54.3 | -28.5 |
| NET INCOME (USD Mil) | -31 | 6.3 | 17.9 | -45.1 | -20.9 |
| DILUTED EPS | -0.2 | 0 | 0.1 | -0.3 | -0.2 |
Source: Yahoo Finance — Quarterly Financial Statements
Revenue was $464.9M in Q1 2026, down from $1.04e+03M in Q3 2025 and slightly below $475M in Q4 2025, so the top line is volatile rather than steadily compounding. The clean YoY comparison is Q1 2026 versus Q1 2025, and revenue was up 7.7% from $431.6M, which is respectable but not enough to justify a growth premium. EBITDA improved to -$28.5M from -$38.9M a year earlier, yet the business is still not converting scale into durable earnings. That pattern fits a project-based storage platform: growth can be lumpy quarter to quarter, but the thesis only works if backlog conversion becomes more consistent.
Profitability
FLNC — Profitability (TTM)
| Metric | TTM |
|---|---|
| Operating Margin (TTM) | -8.4% |
| Net Margin (TTM) | -1.6% |
| Return on Assets (TTM) | -1.3% |
| Return on Equity (TTM) | -12.7% |
| Gross Margin (TTM) | 11.7% |
| EBITDA Margin (TTM) | -0.7% |
Source: Yahoo Finance — Trailing Twelve Months (TTM)
TTM operating margin was -8.4%, net margin was -1.6%, gross margin was 11.7%, EBITDA margin was -0.7%, ROA was -1.3%, and ROE was -12.7%. The gross margin is still positive, but the gap to negative operating and EBITDA margins shows overhead is consuming nearly all product profit, so this is a scale and execution problem rather than a broken cost-of-revenue model. The move from gross profit to operating loss also tells me SG&A and project costs are still too heavy for the current revenue base. Negative ROA and especially the -12.7% ROE show capital is not earning a return yet, and the weaker ROE than ROA suggests leverage is amplifying losses rather than creating value. I would watch for operating margin turning positive first, because that would show the business is finally covering its fixed cost base.
Valuation
FLNC — Valuation Multiples
| Metric | Value |
|---|---|
| Market Cap (USD Mil) | 2,662 |
| Enterprise Value (USD Mil) | 2,052 |
| Trailing P/E | — |
| Forward P/E | 73.9 |
| Price/Sales (TTM) | 1 |
| Price/Book (mrq) | 5.2 |
| EV/Revenue | 0.8 |
| EV/EBITDA | -111.2 |
| Beta (5Y Monthly) | 2.75 |
| FCF Yield % (TTM) | -5.0% |
| Forward EPS (USD) | 0.2 |
| Analyst Target Price – Low (USD) | 9 |
| Analyst Target Price – Mean (USD) | 18.7 |
| Analyst Target Price – High (USD) | 28 |
| # Analyst Opinions | 18 |
Source: Yahoo Finance
Fluence trades on a revenue multiple because earnings are still unstable. The stock is at 0.8x enterprise value to revenue and 1.0x price to sales TTM, which tells me the market is paying less than one year of sales for a business that is still not converting revenue into durable profit. That is a cautious valuation, but not a cheap one given the current cash burn. The earnings-based multiples are not useful as cheapness signals here: forward P/E is 73.9x on forward EPS of 0.2, and EV/EBITDA is -111x because EBITDA is still negative. FCF Yield is -5.0% TTM, which means levered free cash flow was -$133.7M in the latest twelve months. On 132.8M shares outstanding, that is about -$1.0 per share of cash burn, so today’s implied share price is still being asked to fund losses rather than harvest cash. Beta is 2.8, PEG is 3.2x, and book value is $2.8 per share versus a 5.2x price-to-book ratio. On the analysis here, I would put fair value in a range of roughly $12-$18 per share, which sits below the $18.7 analyst mean target and well below the $28 high. That gap makes sense to me because I weight cash conversion and leverage more heavily than the consensus appears to. The market is also paying for an EPS path that still looks thin: forward EPS of 0.2 is modest, and I would want to see that move closer to $0.5-$0.7 before I thought the current multiple was justified. Relative to peers, that EPS trajectory is still expensive on a like-for-like basis because the company is not yet producing the kind of earnings power that would support a premium multiple.
Leverage
FLNC — Leverage & Coverage (Quarterly)
| Metric | Value |
|---|---|
| Total Debt/Equity % (mrq) | 87.7 |
| Current Ratio (mrq) | 1.4 |
| Total Debt (mrq, USD Mil) | 402 |
| Operating Cash Flow (TTM, USD Mil) | -236 |
| Levered Free Cash Flow (TTM, USD Mil) | -133.7 |
| Net Debt/EBITDA (TTM) | -0.8 |
| FCF Margin % (TTM) | -5.2% |
Source: Yahoo Finance — Quarterly Financial Statements
Fluence’s leverage is manageable but not a strength. Total Debt/Equity was 87.7%, Current Ratio was 1.4, and Total Debt was $402M, so the balance sheet is not stretched, but it also does not give much room for error. The cash flow profile is the weaker part: Operating Cash Flow was -$236M TTM, Levered Free Cash Flow was -$133.7M, Net Debt/EBITDA was -0.8x, and FCF Margin was -5.2%. I view that as moderate refinancing risk because the current ratio provides near-term liquidity, but negative operating cash flow and negative free cash flow mean that cushion erodes if working capital stays heavy or project timing slips. EBITDA is not converting into cash yet, so financial flexibility is limited even before any refinancing date becomes a live issue. The leverage profile therefore reinforces the valuation case: the stock is not expensive because debt is high, but because the business is still burning cash while carrying enough leverage to matter.
Insider Activity
The insider transaction record is clearly net selling, with $478.4M of open-market sales versus $869,470 of open-market purchases across 38 Form 4 filings. The selling is concentrated in two very large transactions on 2026-05-15, while the buying was broader but much smaller and clustered in early 2025, so alignment looks weaker at the margin. I read that as a caution flag rather than a thesis breaker, but it does not help the case when the company is still dependent on external financing.
Comparable Analysis
Growth
| Company | Revenue TTM (USD Mil) | Revenue Growth YoY % | EBITDA TTM (USD Mil) | Diluted EPS TTM |
|---|---|---|---|---|
| FLNC | 2,584.6 | 7.7% | -18.4 | -0.3 |
| STEM | 152.8 | -10.8% | -0.3 | -8.3 |
| ESS | 1,966 | 6.4% | 1,278.6 | 8.9 |
| ENVX | 34.3 | 49.1% | -141.9 | -0.8 |
| BE | 2,449 | 130.4% | 231.6 | 0 |
Source: Yahoo Finance
FLNC’s 7.7% revenue growth TTM sits between ESS at 6.4% and BE at 130.4%, while STEM is down 10.8% and ENVX is up 49.1%. That middle position does not justify a growth premium, especially because FLNC’s EBITDA was -$18.4M TTM and diluted EPS was -0.3, so the market is paying for a recovery that still has to show up in earnings rather than rewarding current operating strength.
Valuation
| Company | Trailing P/E | Forward P/E | EV/Revenue | EV/EBITDA | Price/Sales (TTM) | Price/Book (mrq) | Market Cap (USD Mil) | Enterprise Value (USD Mil) | Beta (5Y Monthly) | FCF Yield % (TTM) | Forward EPS | Analyst Target Price – Low | Analyst Target Price – Mean | Analyst Target Price – High | # Analyst Opinions |
|---|---|---|---|---|---|---|---|---|---|---|---|---|---|---|---|
| FLNC | — | 73.9 | 0.8 | -111.2 | 1 | 5.2 | 2,662 | 2,052 | 2.75 | -5.0% | 0.2 | 9 | 18.7 | 28 | 18 |
| STEM | — | -1 | 2.5 | -1,453.2 | 0.3 | -0.2 | 52 | 387 | 1.46 | 0.3% | -5.8 | 7.5 | 12 | 18 | 6 |
| ESS | 33.1 | 47.7 | 13.1 | 20.2 | 10.3 | 3.5 | 20,246 | 25,840 | 0.71 | 4.9% | 6.2 | 239 | 299.3 | 352 | 24 |
| ENVX | — | -7.7 | 29.5 | -7.1 | 28 | 3.9 | 961 | 1,013 | 2.25 | -7.5% | -0.6 | 6 | 13.1 | 25 | 10 |
| BE | — | 48.5 | 25.5 | 270.1 | 25.6 | 67.9 | 62,660 | 62,559 | 3.74 | 0.4% | 4.5 | 70 | 286.2 | 390 | 26 |
Source: Yahoo Finance
FLNC’s EV/Revenue of 0.8x is below ESS at 13.1x and BE at 25.5x, but that discount is not a bargain signal because FLNC also has negative EBITDA and negative FCF, so the lower sales multiple reflects weaker conversion rather than a clear mispricing. ESS also trades at 47.7x forward P/E and BE at 48.5x, while FLNC is at 73.9x, which tells me the market is still asking more of FLNC’s earnings path than it is of peers with stronger profitability. On a peer-multiple basis, the implied enterprise value range is wide enough to be more of a sanity check than a target, and the stock’s 43.6% one-year total return already reflects a lot of optimism relative to the company’s current cash generation.
Profitability
| Company | Operating Margin (TTM) | Net Margin (TTM) | Return on Assets (TTM) | Return on Equity (TTM) | Gross Margin (TTM) | EBITDA Margin (TTM) |
|---|---|---|---|---|---|---|
| FLNC | -8.4% | -1.6% | -1.3% | -12.7% | 11.7% | -0.7% |
| STEM | -37.5% | 94.2% | -5.8% | — | 40.8% | -0.2% |
| ESS | 35.2% | 29.1% | 3.2% | 10.6% | 68.9% | 65.0% |
| ENVX | -577.6% | 0.0% | -16.7% | -71.3% | 21.6% | -413.3% |
| BE | 9.6% | 0.2% | 3.1% | 1.3% | 30.1% | 9.5% |
Source: Yahoo Finance
FLNC’s gross margin of 11.7%, operating margin of -8.4%, EBITDA margin of -0.7%, and net margin of -1.6% all trail ESS at 68.9%, 35.2%, 65.0%, and 29.1%, and even STEM’s 40.8% gross margin is far ahead despite its own losses. The gap looks structural and cost-of-revenue driven, not just a scale issue, because FLNC is already larger than STEM on revenue at $2.6B versus $152.8M, yet still cannot convert sales into positive EBITDA the way ESS does. ROE of -12.7% and ROA of -1.3% also lag ESS at 10.6% and 3.2%, which confirms that capital efficiency is still weak.
Leverage
| Company | Total Debt/Equity % (mrq) | Current Ratio (mrq) | Total Debt (mrq, USD Mil) | Operating Cash Flow TTM (USD Mil) | Free Cash Flow TTM (USD Mil) | Net Debt/EBITDA (TTM) | FCF Margin % (TTM) |
|---|---|---|---|---|---|---|---|
| FLNC | 87.7 | 1.4 | 402 | -236 | -133.7 | -0.8 | -5.2% |
| STEM | — | 0.8 | 368.9 | -10 | 0.1 | -1,249.4 | 0.1% |
| ESS | 121.9 | 0.3 | 6,857 | 1,080.1 | 983 | 5.3 | 50.0% |
| ENVX | 224 | 11 | 543.8 | -111.5 | -72.1 | -0.1 | -210.1% |
| BE | 311.5 | 5 | 2,952.8 | 298.2 | 265.5 | 2 | 10.8% |
Source: Yahoo Finance
FLNC’s debt/equity is 87.7%, lower than ESS at 121.9% and BE at 311.5%, while its current ratio of 1.4 is far better than ESS at 0.3 and STEM at 0.8. The catch is that FLNC’s FCF margin is -5.2% TTM, so the balance sheet is not being strengthened by internal cash generation the way ESS’s 50.0% FCF margin is; FLNC is still funding growth from liquidity, not from self-funding operations. That is why the lower leverage does not translate into a cleaner equity story.
Conclusion
I would put my rating as a Sell because Fluence Energy still has to prove that its software and installed-base advantage can turn into durable cash generation. Revenue was $464.9M in Q1 2026, up 7.7% from $431.6M in Q1 2025, but EBITDA was still -$28.5M and levered free cash flow was -$133.7M TTM, so the company is growing without showing that growth can fund itself. The strongest support for the thesis is the 115.9 GW pipeline and 7.5 GW contracted backlog, which keep the long-term demand case alive. The problem is that the latest numbers still show a business leaning on financing and working-capital support rather than internal cash.
I would move more toward a Buy if revenue growth reaccelerates above 15.0% for two consecutive quarters, because that would show backlog is converting faster than the current 7.5 GW contracted base implies, and if operating margin turns positive, meaning the fixed-cost base is finally covered. Free cash flow turning positive would be the cleaner threshold, since it would show the $400M convertible note and the $500M revolver are supporting expansion rather than funding losses. If operating cash flow improved by roughly $100M from the current -$236M TTM level, that would materially shorten the financing gap and make the equity case easier to underwrite.
I would move from Sell to Hold if the two largest customers stay near 50.0% of revenue and the company cannot reduce that concentration, because one large order delay or payment issue would still dominate the income statement. I would also stay cautious if levered free cash flow remains below -$100M TTM and the current ratio slips materially below 1.4x, since that would mean liquidity is being consumed faster than the business is scaling. In that case, the domestic module buildout and the software stack would look less like a moat and more like expensive features on a still fragile operating model.
Weighing both sides, I think the bear case is more likely to show up first because the stock is already pricing a recovery while the latest twelve months still show negative EBITDA, negative free cash flow, and a 39.0% short interest on float. I would stay at Sell until Fluence proves that backlog conversion can lift cash generation, not just revenue, because that is the point where the thesis stops depending on financing and starts depending on operating performance.
What’s your take? I rated Fluence Energy (FLNC) SELL above — but the goal here is to get this right, not just to publish an opinion. What would you add to this analysis, or which risk or catalyst do you think I’m under- or over-weighting? Tell me in the comments.
Sources
- SEC 10-K Annual Report — filed 2024-11-29
- SEC 8-K Filing (2024-12-12)
- SEC 8-K Filing (2024-12-11)
- SEC 8-K Filing (2024-11-25)
- SEC 8-K Filing (2024-08-07)
- SEC 8-K Filing (2024-06-11)
- SEC 8-K Filing (2024-05-08)
- SEC Form 4 Insider Transaction (2026-06-04)
- SEC Form 4 Insider Transaction (2026-05-19)
- SEC Form 4 Insider Transaction (2026-05-18)
- SEC 10-K Annual Report — FY2024
- SEC 10-K Annual Report — FY2023
- SEC 10-K Annual Report — FY2022
- SEC 10-K Annual Report — FY2021
Data sourced from Yahoo Finance and SEC EDGAR. Not investment advice.
<section class="lf0-research-basis"><h2>Research basis and updates</h2><p>This report presents the thesis and financial snapshot used at its original publication date. Any daily-close performance card tracks the original call separately; it does not refresh the financial analysis or issue a new rating.</p><p>Read <a href="/methodology/">how LF0 research and rating tracking work</a>, <a href="/about/">about the research desk</a>, and <a href="/research-performance/">the public research scorecard</a>.</p></section>
Leave a Comment