
Expected price range
Each range is set from the stock’s recent price history and our Hold rating, using its own 1-year realised volatility (60% annualised) as the width of a ~68% statistical band, and checked against that rating so the range leans the same way as our view. Starting price $74.07 (close 2026-11-03). The stock traded between $67.71 and $98.82 over the last 6 months and between $66.91 and $135 over the last year. This is an illustration of where our view and normal volatility point, not a forecast, price target or investment advice; the stock can move outside it.
| Company | Nov 25 | Dec 25 | Jan 26 | Feb 26 | Mar 26 | Apr 26 | May 26 | Jun 26 | Jul 26 | Aug 26 | Sep 26 | Oct 26 | 12-Mo |
|---|---|---|---|---|---|---|---|---|---|---|---|---|---|
| WLDN | +7% | +3% | +22% | -29% | -14% | -1% | +20% | -13% | -13% | +28% | -16% | -0% | -22% |
| STRL | -9% | -11% | +17% | +20% | -5% | +27% | +67% | -2% | -29% | -21% | +5% | -30% | -8% |
| FLR | -12% | -8% | +17% | +13% | -11% | +14% | -14% | +14% | -4% | +9% | -12% | -2% | -4% |
| ICFI | -3% | +9% | +9% | -11% | -21% | +10% | -4% | +6% | +11% | +10% | -7% | +15% | +20% |
| TTEK | +9% | -3% | +12% | -5% | -16% | +7% | -15% | +5% | +15% | +9% | -9% | +17% | +22% |
| POWL | -16% | -1% | +39% | +18% | +3% | +54% | +3% | +1% | -27% | -14% | +3% | -15% | +23% |
Source: Yahoo Finance monthly adjusted close.
Quick Thesis
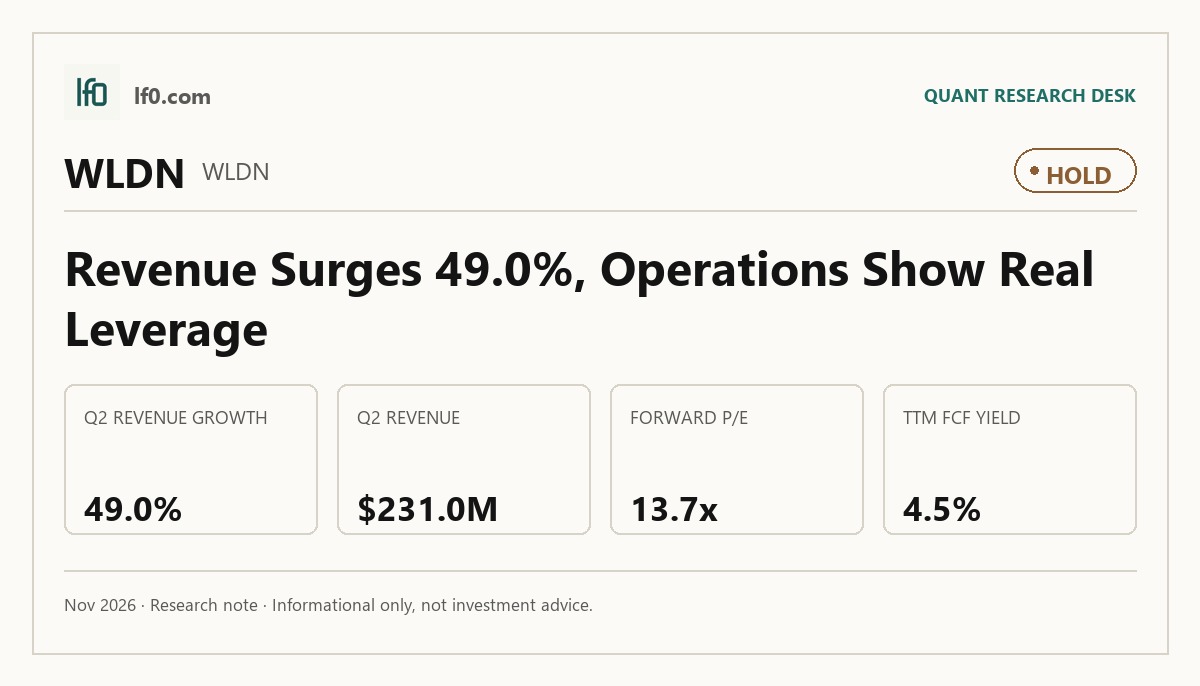
- Rated hold — growth improved, but the stock already discounts it.
- Q2 2026 revenue reached $231M, with EBITDA of $27.1M.
- The main risk is execution: project EBITDA margin slipped below 9%.
- Valuation is mid-pack at 15.6x EV/EBITDA and 13.7x forward P/E.
- I would turn more constructive if operating margin stays above 10%.
Executive Summary
Rating: HOLD | WLDN
We’ll begin tracking this call’s performance since publication once sufficient adjusted-close data is available.
I would put my rating as a Hold because Willdan’s latest quarter shows real operating leverage, but the shares already price in a good part of that improvement. Revenue rose to $231M in Q2 2026, EBITDA increased to $27.1M, and net debt was only 0.7x EBITDA, so the business is growing without leaning on leverage to do it.
The key issue is not the balance sheet; it is whether the recent step-up in earnings can hold. I would move toward a Buy if operating margin stays above 10%, meaning overhead is being absorbed across a larger revenue base, and if quarterly revenue remains above $200M, which would show the Q2 run rate is not just a one-quarter spike. If those thresholds slip, the current multiple would look less forgiving.
Company Profile
Willdan Group is a professional services firm focused on energy consulting, engineering, and public-sector advisory work. Its Energy segment generated 85.0% of fiscal 2025 contract revenue and designs and implements efficiency programs, audits, measurement and verification, and turnkey facility upgrades for utilities, schools, and governments. The Engineering and Consulting segment contributed the remaining 15.0% and provides city engineering, building and safety, transportation, water, and financial consulting services, often under time-and-materials, unit-based, or fixed-price contracts.
Founded in 1964, Willdan formed its Delaware holding company in 2006 and entered energy efficiency services in 2008, then expanded through organic growth and acquisitions. It operates across 22 states, the District of Columbia, Alberta, and Puerto Rico, with 2,600 open projects as of January 2, 2026. The company is listed on Nasdaq under WLDN.
Economic Moat
Business Model
The recurring contract base is the most defensible part of Willdan’s model. According to its SEC filings, the company serves a majority of the largest investor-owned electric utilities and over half of the largest municipal utilities in the United States, while many utility and city-service contracts have been renewed or re-awarded and have remained in place for more than 30 years. In my view, that is hard for a well-funded competitor to replicate within 3 years because utility and public-agency work is awarded on qualifications, regulatory familiarity, and long client relationships rather than price alone.
That moat is reinforced by the company’s broad operating footprint and its installed base of 2,600 open projects, which makes Willdan more embedded in client workflows than a simple bid-and-win contractor. Proprietary marks such as MuniMagic+SM and VIEWPOINT help at the margin, but the real advantage is the combination of client stickiness, regulatory know-how, and repeat program work.
Business & Operating Risks
The most material disclosed risk is contract execution on large fixed-price projects, because Willdan can lose money even when revenue is recognized if costs run above estimate. The filing warns that fixed-price contracts can make earnings less predictable and that cost overruns can reduce profits or create losses on a project. It also notes that percentage-of-completion accounting can force a reduction or reversal of previously recorded revenue and profits, which means a bad estimate can hit both margins and reported earnings in the same period.
The second risk is dependence on utility programs and state regulation, which can change the size, timing, and profitability of the work pipeline. The filing says demand is highly regulated and driven by state commissions, and that changes in goals, standards, prices, or other terms can alter the effort and cost required to deliver savings. It also warns that large clients and utility programs may terminate contracts at any time, often on short notice.
A third risk is backlog quality and cancellation exposure. Backlog is an uncertain indicator of future earnings, and termination for convenience can remove remaining contract value after reimbursement of unbilled effort. That does not break the moat, but it does mean the moat is about repeat access to work, not guaranteed profit on every contract.
Taken together, these risks pressure the earnings conversion of the moat rather than the moat itself; the structural advantage still exists, but it only translates into value if project execution stays tight.
Management Discussion & Analysis
Management is clearly leaning into acquisitions and mix shift rather than balance-sheet repair. Contract revenue rose to $681.6M in FY2025 from $565.8M in FY2024, and management tied that increase to stronger demand for energy efficiency and electrification services, higher construction management revenue, and incremental revenue from Enica and APG. That is consistent with a deliberate push into utility-facing work, which should support the moat if the company can keep converting that demand into profitable backlog.
The capital-allocation pattern supports that view. Cash used in investing activities was $45.6M in FY2025, including acquisitions and internal software development, while financing cash outflow of $42.7M was driven mainly by $39.7M of revolving credit paydown. Willdan also added a $50M Delayed Draw Term Loan, a committed but undrawn borrowing line that must be drawn before May 2027, which gives flexibility for more deals or working capital.
The operating tone is constructive, but not complacent. Gross margin improved to 37.5% in FY2025 from 35.8% in FY2024, and management attributes that to mix, yet G&A still absorbed 31.0% of revenue. I read that as a business that is scaling, but not one that has fully escaped project-level volatility.
Recent Events
There were no material corporate events since the most recent 10-K, so the latest filing set does not point to a new strategic pivot or a change in leadership. That matters because the moat thesis is still being driven by execution on the existing utility-program and acquisition strategy rather than by a fresh corporate event.
Financial Analysis
Growth
WLDN — Financial Growth (Quarterly, USD Mil)
| Metric | 2025-06-30 | 2025-09-30 | 2025-12-31 | 2026-03-31 | 2026-06-30 |
|---|---|---|---|---|---|
| REVENUE (USD Mil) | 173.5 | 182 | 173.7 | 155.1 | 231 |
| EBIT (USD Mil) | 12.4 | 15.2 | 11.2 | 8.1 | 20.2 |
| EBITDA (USD Mil) | 17.9 | 19.1 | 16 | 13.5 | 27.1 |
| NET INCOME (USD Mil) | 15.4 | 13.7 | 18.7 | 8.5 | 24.3 |
| DILUTED EPS | 1 | 0.9 | 1.2 | 0.6 | 1.6 |
Source: Yahoo Finance — Quarterly Financial Statements
Revenue moved from $173.5M in Q2 2025 to $231M in Q2 2026, while EBITDA rose from $17.9M to $27.1M and net income increased from $15.4M to $24.3M. The latest quarter also showed a sharp rebound from the $155.1M trough in Q1 2026, which tells me the business is lumpy but still capable of converting backlog into earnings quickly when timing lines up.
That pattern is important for the moat thesis: the recurring utility base is real, but the quarterly path is still uneven enough that I would not treat one strong quarter as proof of a smooth compounding engine. The current run rate is encouraging, yet it needs to hold for more than one period before I would underwrite a higher multiple.
Profitability
WLDN — Profitability (TTM)
| Metric | TTM |
|---|---|
| Operating Margin (TTM) | 8.6% |
| Net Margin (TTM) | 8.8% |
| Return on Assets (TTM) | 5.9% |
| Return on Equity (TTM) | 21.2% |
| Gross Margin (TTM) | 37.8% |
| EBITDA Margin (TTM) | 9.9% |
Source: Yahoo Finance — Trailing Twelve Months (TTM)
TTM operating margin was 8.6%, net margin was 8.8%, gross margin was 37.8%, EBITDA margin was 9.9%, return on assets was 5.9%, and return on equity was 21.2%. The 29.2-point gap between gross margin and operating margin shows that overhead is still heavy, so the company is past the pure start-up phase but not yet operating with full scale leverage.
EBITDA margin sits only 1.3 points above operating margin, which means depreciation and amortisation are not the main issue; the real constraint is operating expense discipline. The 12.6-point gap between ROE and ROA shows returns are being amplified by leverage rather than by exceptionally high asset productivity. I would want to see operating margin move above 10% before I call this a fully self-reinforcing earnings model.
Valuation
WLDN — Valuation Multiples
| Metric | Value |
|---|---|
| Current Share Price (USD) | 74.1 |
| Market Cap (USD Mil) | 1,129 |
| Enterprise Value (USD Mil) | 1,151 |
| Trailing P/E | 17.4 |
| Forward P/E | 13.7 |
| Price/Sales (TTM) | 1.5 |
| Price/Book (mrq) | 3.2 |
| EV/Revenue | 1.6 |
| EV/EBITDA | 15.6 |
| Beta (5Y Monthly) | 1.31 |
| FCF Yield % (TTM) | 4.5% |
| Forward EPS (USD) | 5.4 |
| Analyst Target Price – Low (USD) | 130 |
| Analyst Target Price – Mean (USD) | 137.5 |
| Analyst Target Price – High (USD) | 145 |
| # Analyst Opinions | 2 |
Source: Yahoo Finance
WLDN trades at 15.6x EV/EBITDA, 1.6x EV/revenue, 17.4x trailing P/E, and 13.7x forward P/E, with a 4.5% TTM FCF yield. That is not expensive for a business with positive cash generation and modest leverage, but it is also not cheap enough to ignore execution risk.
On my read, fair value sits in a range of roughly $70–$95 per share. That range is below the $130–$145 analyst target band, and with only 2 analyst opinions I do not think there is a meaningful consensus to anchor to beyond noting that the street is clearly more optimistic than I am. I am more conservative because I weight the lumpy quarterly revenue pattern and the still-sub-10% operating margin more heavily than the market appears to.
Forward EPS is 5.4, which implies a forward P/E of 13.7x at the current price. Against peers, that earnings base is not stretched, but it is also not cheap enough to justify a premium unless margin expansion becomes more durable. In other words, the stock is priced for execution, not for disappointment.
Leverage
WLDN — Leverage & Coverage (Quarterly)
| Metric | Value |
|---|---|
| Total Debt/Equity % (mrq) | 25.4 |
| Current Ratio (mrq) | 1.4 |
| Total Debt (mrq, USD Mil) | 89.2 |
| Net Debt/EBITDA (TTM) | 0.7 |
| FCF Margin % (TTM) | 6.8% |
Source: Yahoo Finance — Quarterly Financial Statements
Total debt was $89.2M, with a total debt/equity ratio of 25.5% and a current ratio of 1.4. Operating cash flow was $70.9M TTM, levered free cash flow was $50.5M TTM, net debt/EBITDA was 0.7x, and FCF margin was 6.8%.
That mix points to a manageable balance sheet with enough liquidity to absorb a normal slowdown. Cash generation is doing real work here because free cash flow remains positive after capex, so the company is not relying on external funding to fund operations. The leverage profile supports the thesis, but it does not create it; earnings growth still has to do the heavy lifting.
Insider Activity
The insider transaction record is one-sided: 15 open-market sales for $11.7M and no open-market purchases over 2025-03-07 to 2026-05-14. The activity is concentrated almost entirely in Michael A. Bieber, which makes this more of a single-insider selling pattern than broad-based distribution, but the absence of any buying still leaves alignment looking weak.
I do not read this as a turnover issue, but I do think it tempers the otherwise constructive operating picture. When the stock is already trading at a mid-teens forward multiple, persistent insider selling makes it harder for me to argue that the market is missing something obvious.
Comparable Analysis
LF0 has published standalone analyses of these peers: Powell Industries (POWL) (rated Hold).
Growth
| Company | Revenue TTM (USD Mil) | Revenue Growth YoY % | Diluted EPS TTM |
|---|---|---|---|
| WLDN | 741.8 | 33.2% | 4.3 |
| STRL | 4,313.4 | 127.0% | 17.8 |
| FLR | 15,535 | 8.8% | -11.9 |
| ICFI | 1,821.1 | -0.3% | 4.8 |
| TTEK | 4,358.7 | -3.9% | 1.7 |
| POWL | 1,157.5 | 8.9% | 5.2 |
Source: Yahoo Finance
WLDN’s revenue growth of 33.2% TTM is well ahead of ICFI at -0.3% and TTEK at -3.9%, but it trails STRL at 127.0% and sits above FLR at 8.8% and POWL at 8.9%. That puts Willdan in the upper half of the group, but not in the fastest-compounding tier.
The growth profile matters because WLDN is not being valued like a distressed name, yet it also does not have STRL’s growth rate to justify a much richer multiple. I see that as a fair setup for a mid-pack valuation, not a premium one.
Valuation
| Company | Current Share Price (USD) | Trailing P/E | Forward P/E | EV/Revenue | EV/EBITDA | Price/Sales (TTM) | Price/Book (mrq) | Market Cap (USD Mil) | Enterprise Value (USD Mil) | Beta (5Y Monthly) | FCF Yield % (TTM) | Forward EPS | Analyst Target Price – Low | Analyst Target Price – Mean | Analyst Target Price – High | # Analyst Opinions |
|---|---|---|---|---|---|---|---|---|---|---|---|---|---|---|---|---|
| WLDN | 74.1 | 17.4 | 13.7 | 1.6 | 15.6 | 1.5 | 3.2 | 1,129 | 1,151 | 1.31 | 4.5% | 5.4 | 130 | 137.5 | 145 | 2 |
| STRL | 359.9 | 20.2 | 13.9 | 2.4 | 11.3 | 2.5 | 10 | 10,978 | 10,228 | 1.98 | 3.2% | 25.8 | 565 | 693.4 | 834 | 7 |
| FLR | 48 | — | 14.2 | 0.3 | -18.6 | 0.4 | 2.4 | 6,421 | 4,331 | 1.24 | 0.3% | 3.4 | 50 | 61.6 | 71 | 8 |
| ICFI | 98 | 20.3 | 12.7 | 1.3 | 11.8 | 1 | 1.7 | 1,758 | 2,327 | 0.45 | 4.7% | 7.7 | 80 | 107.2 | 124 | 4 |
| TTEK | 39.3 | 23.7 | 22.9 | 2.5 | 16.7 | 2.3 | 5.4 | 10,065 | 10,925 | 0.87 | 3.9% | 1.7 | 37 | 40.2 | 44 | 6 |
| POWL | 164.6 | 31.5 | 23.5 | 4.3 | 21.1 | 5.2 | 7.9 | 5,995 | 4,980 | 1.23 | 3.2% | 7 | 235 | 267.5 | 333 | 4 |
Source: Yahoo Finance
WLDN trades at 1.6x EV/revenue and 15.6x EV/EBITDA, versus ICFI at 1.3x and 11.8x, STRL at 2.4x and 11.3x, TTEK at 2.5x and 16.7x, FLR at 0.3x and -18.6x, and POWL at 4.3x and 21.1x. On a peer-multiple basis, WLDN sits in the middle of the pack, which is exactly where I would expect a company with mid-teens forward earnings and a modest balance sheet to trade.
The stock’s 4.5% FCF yield is better than STRL, TTEK, and POWL, but slightly below ICFI. That combination tells me the market is not paying a growth premium for WLDN, which is sensible given the lumpiness in quarterly revenue and the still-moderate margin profile.
Profitability
| Company | Operating Margin (TTM) | Net Margin (TTM) | Return on Assets (TTM) | Return on Equity (TTM) | Gross Margin (TTM) | EBITDA Margin (TTM) |
|---|---|---|---|---|---|---|
| WLDN | 8.6% | 8.8% | 5.9% | 21.2% | 37.8% | 9.9% |
| STRL | 19.9% | 12.9% | 16.6% | 45.0% | 23.8% | 20.9% |
| FLR | 3.3% | -12.8% | -1.9% | -45.2% | -0.8% | -1.5% |
| ICFI | 8.4% | 4.9% | 4.2% | 8.6% | 37.2% | 10.8% |
| TTEK | 14.3% | 10.0% | 8.5% | 24.3% | 21.8% | 15.0% |
| POWL | 20.6% | 16.5% | 11.6% | 28.3% | 30.1% | 20.4% |
Source: Yahoo Finance
WLDN’s operating margin of 8.6%, net margin of 8.8%, gross margin of 37.8%, and EBITDA margin of 9.9% are ahead of FLR and roughly in line with ICFI on operating margin, but below STRL, TTEK, and POWL on most measures. Gross margin is close to ICFI’s 37.2%, which suggests the issue is not revenue quality so much as operating expense absorption.
That is the key cross-check for the thesis: WLDN has a decent gross-profit engine, but it has not yet turned that into top-tier operating leverage. Until that changes, I would not pay a premium multiple for the stock.
Leverage
| Company | Total Debt/Equity % (mrq) | Current Ratio (mrq) | Total Debt (mrq, USD Mil) | Operating Cash Flow TTM (USD Mil) | Free Cash Flow TTM (USD Mil) | Net Debt/EBITDA (TTM) | FCF Margin % (TTM) |
|---|---|---|---|---|---|---|---|
| WLDN | 25.4 | 1.4 | 89.2 | 70.9 | 50.5 | 0.7 | 6.8% |
| STRL | 10.7 | 1 | 165.8 | 613.1 | 352.6 | -0.1 | 8.2% |
| FLR | 38.5 | 1.8 | 1,072 | -287 | 21.5 | 8.5 | 0.1% |
| ICFI | 53.8 | 1.4 | 564.8 | 219.5 | 82.7 | 2.8 | 4.5% |
| TTEK | 55.2 | 1.2 | 1,023.5 | 567.4 | 396.6 | 1.2 | 9.1% |
| POWL | 0.3 | 2 | 2.5 | 256.1 | 190.4 | -2.7 | 16.4% |
Source: Yahoo Finance
WLDN’s debt/equity of 25.5% and net debt/EBITDA of 0.7x are conservative versus ICFI at 53.8% and 2.8x, FLR at 38.5% and 8.5x, and STRL at 10.7% and -0.1x. Its 6.8% FCF margin is also comfortably above FLR’s 0.1% and close to ICFI’s 4.5%.
That lower leverage helps explain why WLDN can trade at a reasonable multiple despite not leading the group on growth or profitability. Investors are paying for balance-sheet safety and steady cash conversion, not for a best-in-class operating model.
Conclusion
The tension in this name is straightforward: the business is improving, but the market already gives it credit for a good portion of that improvement. I would put my rating as a Hold because the latest quarter shows real operating leverage, yet the stock is already trading at 13.7x forward P/E and 15.6x EV/EBITDA, which leaves less room for error than the recent growth rate might suggest.
I would raise my rating toward a Buy if operating margin stays above 10%, meaning overhead is being absorbed across a larger revenue base, and if quarterly revenue remains above $200M, which would show the Q2 run rate is holding rather than fading. That would tell me the earnings step-up is becoming durable rather than just timing-driven.
I would move from Hold toward Sell if revenue falls back toward $155.1M for two straight quarters or if project EBITDA margin slips below 9%, because that would suggest the recent rebound was temporary and that contract execution is still too uneven. Persistent insider selling without offsetting buying would also keep me cautious, especially with the stock already priced for execution.
My final view is that the bull case is more likely to show up first, but not by enough to justify a higher-conviction call today. I would rather own it than short it, yet I want to see a few more quarters of margin stability before I move beyond Hold.
What to Watch Next
- Operating margin above 10% — would support a move toward Buy.
- Quarterly revenue above $200M — would confirm the Q2 run rate.
- Project EBITDA margin below 9% — would weaken the execution case.
- Continued open-market insider selling — would keep alignment concerns alive.
- Net debt/EBITDA staying below 1.0x — would preserve balance-sheet flexibility.
Update Since Our Last Call
Rating unchanged: Hold (2026-06-09) → Hold (today). Stock return since our prior call: -27.1% (Moved beyond Hold range).
The prior thesis did not play out: the stock return since entry was -27.1%, and the verdict so far is Moved beyond Hold range. That makes the prior call look wrong, not just early.
What changed is concrete. The new article points to Q2 2026 revenue of $231M and EBITDA of $27.1M, versus the prior article’s focus on $155.1M in Q1 2026 and a much softer recent run rate. It also adds net debt at 0.7x EBITDA and says project EBITDA margin slipped below 9%, while the earlier piece emphasized total debt of $69.4M, a current ratio of 1.7x, and TTM operating margin of 4.7%. The new note also introduces a Delayed Draw Term Loan and a fresh warning that the latest quarter’s margin strength may not be durable.
What stayed the same is the core moat-and-execution split. Both articles independently confirm that Willdan has sticky utility and municipal relationships, a recurring contract base, and a business that can convert backlog into earnings. Both also agree that the real risk is execution on fixed-price and project work, not the existence of demand.
On valuation, the prior range was not explicit; it gave no fair-value or price range. The new article gives “roughly $70-$95 per share.” That range is lower than the prior article’s implied stance because the new evidence is more mixed: stronger revenue and EBITDA, but also a sub-9% project margin and a stock that already prices in improvement.
The ratings are identical — Hold — but I weight the new quarter’s $231M revenue and the margin warning more heavily than the earlier, more static balance-sheet framing.
What’s your take? I rated Willdan (WLDN) HOLD above — but the goal here is to get this right, not just to publish an opinion. What would you add to this analysis, or which risk or catalyst do you think I’m under- or over-weighting? Tell me in the comments.
Our track record: every directional call is tracked publicly on The Scorecard, and Stocks Covered lists every company we have rated and when.
Sources
- SEC 10-K Annual Report — filed 2026-02-27
- SEC 8-K Filing (2026-05-07)
- SEC 8-K Filing (2026-02-26)
- SEC Form 4 Insider Transaction (2026-05-15)
- SEC Form 4 Insider Transaction (2026-05-14)
- SEC Form 4 Insider Transaction (2026-03-26)
- SEC 10-K Annual Report — FY2026
- SEC 10-K Annual Report — FY2025
- SEC 10-K Annual Report — FY2024
- SEC 10-K Annual Report — FY2023
- SEC 10-K Annual Report — FY2022
Data sourced from Yahoo Finance and SEC EDGAR. Not investment advice.
Leave a Comment