
Expected price range
Each range is set from the stock’s recent price history and our Hold rating, using its own 1-year realised volatility (67% annualised) as the width of a ~68% statistical band, and checked against that rating so the range leans the same way as our view. Starting price $93.79 (close 2026-11-03). The stock traded between $67.09 and $107 over the last 6 months and between $58.81 and $205 over the last year. This is an illustration of where our view and normal volatility point, not a forecast, price target or investment advice; the stock can move outside it.
| Company | Nov 25 | Dec 25 | Jan 26 | Feb 26 | Mar 26 | Apr 26 | May 26 | Jun 26 | Jul 26 | Aug 26 | Sep 26 | Oct 26 | 12-Mo |
|---|---|---|---|---|---|---|---|---|---|---|---|---|---|
| MNDY | -30% | +3% | -22% | -37% | -5% | -5% | +27% | -13% | +20% | +16% | -22% | +22% | -53% |
| FRSH | +9% | +1% | -12% | -27% | +3% | +2% | +19% | +4% | +12% | +23% | -8% | +15% | +33% |
| TEAM | -12% | +8% | -27% | -36% | -9% | +0% | +57% | -28% | +30% | +92% | -8% | +7% | +13% |
| MDB | -8% | +26% | -12% | -12% | -25% | +2% | +34% | +0% | +0% | +34% | -23% | +1% | -2% |
| ASAN | -8% | +6% | -25% | -31% | -10% | -1% | +22% | -9% | +19% | +23% | -18% | +33% | -20% |
| ROP | +0% | -0% | -16% | -6% | +1% | +1% | -8% | +4% | +16% | +8% | -18% | +34% | +6% |
Source: Yahoo Finance monthly adjusted close.
Quick Thesis
- Rated hold — revenue is growing, but operating leverage is still too thin.
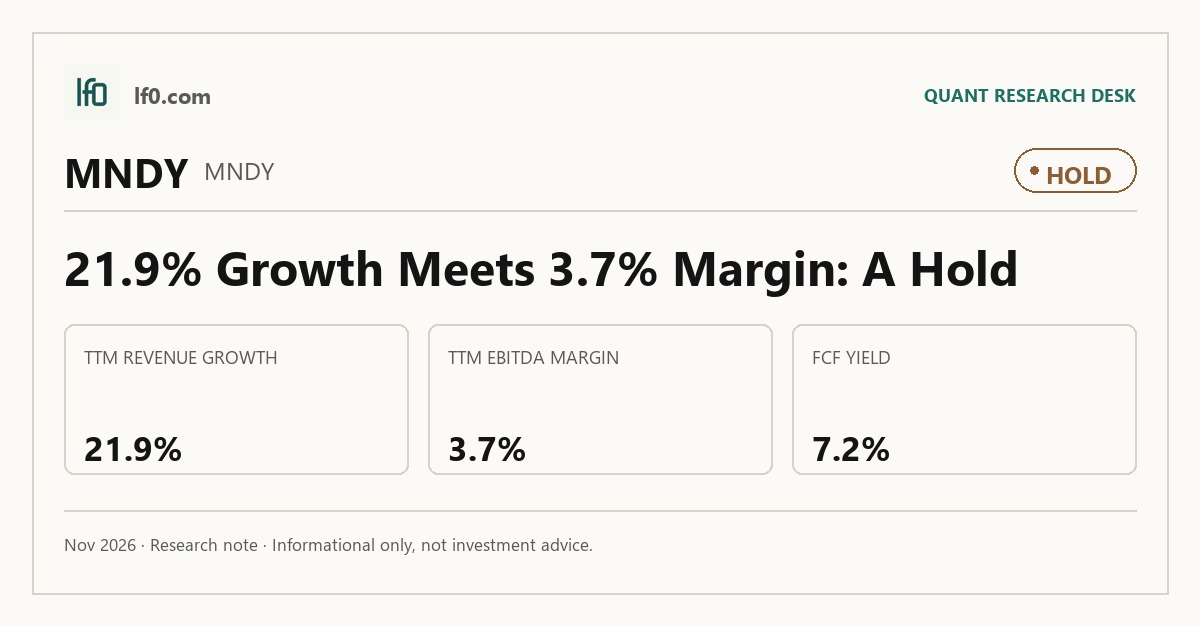
- Strongest point: 21.9% TTM revenue growth, with $364.6M in the latest quarter.
- Main risk: 3.7% TTM EBITDA margin leaves little room for execution error.
- Valuation is mixed: 2.3x EV/revenue is reasonable, but 62.8x EV/EBITDA is rich.
- I would move toward a buy if EBITDA margin reaches the low double digits.
Executive Summary
Rating: HOLD | MNDY
We’ll begin tracking this call’s performance since publication once sufficient adjusted-close data is available.
I would put my rating as a hold because monday.com is still growing revenue at 21.9% TTM, but that growth has not yet translated into durable operating earnings. The stock trades at 2.3x EV/revenue and 7.2% FCF yield, which is reasonable for a software name, yet the 5.5% operating margin and 3.7% EBITDA margin show the market is paying for a profit profile that is still incomplete. I would raise my rating more towards a buy if revenue growth holds above 20% for the next two quarters and EBITDA margin moves into the low double digits, because that would show the company is finally converting scale into operating leverage.
Company Profile
monday.com provides cloud-based work management software that helps teams plan projects, track workflows, and automate routine tasks. The company earns revenue mainly from subscriptions, so the key operating question is not whether customers can be signed up, but whether the installed base keeps expanding and monetizing over time. That subscription model is why revenue growth and margin expansion matter together: the business can scale quickly, but only if customer adoption turns into recurring cash flow rather than just top-line growth.
Economic Moat
Business Model
The moat case rests on product breadth and workflow stickiness. monday.com’s platform is broad enough to sit across multiple functions inside a customer, which makes it harder to displace than a single-point tool, and the subscription model gives the company a recurring revenue base that can compound as usage expands. I feel that this kind of embedded workflow software is harder to rip out once teams standardize on it, which is the structural advantage the rest of the article is testing.
Business & Operating Risks
The main disclosed risks are execution and concentration of value in a product-led model: if customer adoption slows, if usage does not deepen after initial deployment, or if the company cannot keep product innovation ahead of rivals, the moat weakens quickly. The 3.7% EBITDA margin suggests the moat is not yet fully monetized, but the risk profile does not point to a broken franchise so much as a still-maturing one.
Management Discussion & Analysis
Management appears to be leaning on continued growth while pushing toward better operating leverage, which is the right response to the margin gap surfaced above. The latest quarter’s revenue of $364.6M and EBITDA of $23.9M show the company is still scaling, but the gap between sales growth and earnings growth tells me management still has to prove that expense discipline can catch up with demand.
Recent Events
The most recent quarter did not show a strategic reset; instead, it showed the same operating pattern continuing, with revenue still rising and profitability improving only gradually. That matters for the moat because it suggests the product remains relevant, but it also tells me the company has not yet reached the point where the moat is visibly converting into strong earnings power.
Financial Analysis
Growth
MNDY — Financial Growth (Quarterly, USD Mil)
| Metric | 2025-06-30 | 2025-09-30 | 2025-12-31 | 2026-03-31 | 2026-06-30 |
|---|---|---|---|---|---|
| REVENUE (USD Mil) | 299 | 316.9 | 333.9 | 351.3 | 364.6 |
| EBIT (USD Mil) | -11.6 | -2.4 | 2.4 | 19.8 | 19.9 |
| EBITDA (USD Mil) | -8.2 | 1.1 | 6.1 | 23.6 | 23.9 |
| NET INCOME (USD Mil) | 1.6 | 13.1 | 76.7 | 28 | 3.5 |
| DILUTED EPS | 0 | 0.2 | 1.4 | 0.6 | 0.1 |
Source: Yahoo Finance — Quarterly Financial Statements
Revenue rose from $299M to $364.6M over the last five quarters, which is a 21.9% increase and a solid pace for a company already at this scale. EBITDA improved faster than revenue, moving from -$8.2M to $23.9M over the same span, and that is the clearest sign that operating leverage is starting to appear. The latest quarter’s net income fell to $3.5M from $28M in the prior quarter, so I would not read the earnings line as a straight upward trend; the better read is that the business is still uneven below the revenue line, even as the top line keeps compounding. That combination is consistent with the workflow-software moat described above, but it is not yet strong enough to justify paying for a fully mature earnings profile.
Profitability
MNDY — Profitability (TTM)
| Metric | TTM |
|---|---|
| Operating Margin (TTM) | 5.5% |
| Net Margin (TTM) | 8.9% |
| Return on Assets (TTM) | 1.4% |
| Return on Equity (TTM) | 13.4% |
| Gross Margin (TTM) | 88.7% |
| EBITDA Margin (TTM) | 3.7% |
Source: Yahoo Finance — Trailing Twelve Months (TTM)
TTM gross margin of 88.7% shows the core service layer is highly profitable before overhead, so the business is not struggling at the product level. The problem sits below that line: TTM EBITDA margin is 3.7% and TTM operating margin is 5.5%, which means sales are still being absorbed by heavy operating expense and the company is only just past the scale phase. TTM net margin of 8.9% is higher than operating margin, which tells me non-operating items are helping, but I would not overread that because the core operating margin remains thin. TTM ROA of 1.4% versus TTM ROE of 13.4% shows returns are being amplified by leverage rather than by strong asset productivity, so the equity return is less durable than it looks. Investors should watch for EBITDA margin moving into the low double digits and operating margin staying positive, because that would show operating leverage is finally taking hold.
Valuation
MNDY — Valuation Multiples
| Metric | Value |
|---|---|
| Current Share Price (USD) | 93.9 |
| Market Cap (USD Mil) | 3,969 |
| Enterprise Value (USD Mil) | 3,192 |
| Trailing P/E | 39.6 |
| Forward P/E | 14 |
| Price/Sales (TTM) | 2.9 |
| Price/Book (mrq) | 6.4 |
| EV/Revenue | 2.3 |
| EV/EBITDA | 62.8 |
| Beta (5Y Monthly) | 1.05 |
| FCF Yield % (TTM) | 7.2% |
| Forward EPS (USD) | 6.7 |
| Analyst Target Price – Low (USD) | 87 |
| Analyst Target Price – Mean (USD) | 109 |
| Analyst Target Price – High (USD) | 165 |
| # Analyst Opinions | 24 |
Source: Yahoo Finance
MNDY screens rich on the multiples that matter for a growth software name. At a current share price of $93.9, the stock trades at 2.3x EV/revenue and 2.9x price/sales, which tells me the market is paying for durable subscription expansion and a path to much higher operating leverage, not for today’s earnings power. The 39.6x trailing P/E reflects depressed near-term earnings, while 14x forward P/E and 62.8x EV/EBITDA show investors are looking through current volatility to a much stronger profit profile. FCF yield is 7.2%, which is a solid cash-return signal and helps support the valuation, while beta of 1.1 suggests the stock still carries market-level risk. With 24 analyst opinions, the consensus target range of $87 to $165 and mean of $109 sits above the current price, so the market is not pricing in a collapse. On my read, fair value sits roughly in the low $90s to low $100s: that is inside the analyst range, but below the midpoint because I weight the still-thin EBITDA margin more heavily than the consensus appears to. I would frame the implied earnings power as roughly 6.7 per share on forward EPS, and that looks reasonable versus peers only if margin expansion continues; otherwise, the stock is paying a growth multiple for a profit base that is still catching up. Overall, the valuation picture is neutral to mildly bullish: expensive on sales, but not demanding if the company keeps converting growth into cash.
Leverage
MNDY — Leverage & Coverage (Quarterly)
| Metric | Value |
|---|---|
| Total Debt/Equity % (mrq) | 38.4 |
| Current Ratio (mrq) | 1.5 |
| Total Debt (mrq, USD Mil) | 237.5 |
| Operating Cash Flow (TTM, USD Mil) | 314.9 |
| Levered Free Cash Flow (TTM, USD Mil) | 284.6 |
| Net Debt/EBITDA (TTM) | -16.4 |
| FCF Margin % (TTM) | 20.8% |
Source: Yahoo Finance — Quarterly Financial Statements
MNDY’s balance sheet is conservatively funded: total debt/equity is 38.4%, current ratio is 1.5x, and total debt is $237.5M. Liquidity is stronger than the debt load alone suggests because total cash is $1.1B, which leaves the company with net cash and explains the net debt/EBITDA of -16.4x. Cash generation is also solid, with operating cash flow of $314.9M, levered free cash flow of $284.6M, and FCF margin of 20.8%. That means EBITDA is converting into cash efficiently, so the business is not relying on aggressive capital spending to support growth. In my opinion, refinancing risk is low because cash is far larger than debt, and that cushion gives management room to absorb a downturn before any funding decision becomes urgent. This is a bull signal for financial flexibility, but it matters most because the company still needs time for margin expansion to catch up with revenue growth.
Insider Activity
The insider transaction record I see here is limited to one open-market sale by the CRO, George James Case, on 2026-06-02. I would not overread a single sale, but I also would not call it a confidence signal because there is no offsetting insider buying in the data shown. On balance, it is neutral and does not change the core thesis.
Comparable Analysis
LF0 has published standalone analyses of these peers: Atlassian (TEAM) (rated Hold).
Growth
| Company | Revenue TTM (USD Mil) | Revenue Growth YoY % | EBITDA TTM (USD Mil) | Diluted EPS TTM |
|---|---|---|---|---|
| MNDY | 1,366.6 | 21.9% | 50.8 | 2.4 |
| FRSH | 903.9 | 16.0% | 57.5 | 0.6 |
| TEAM | 6,572.3 | 27.6% | 436.4 | -0.2 |
| MDB | 2,782.8 | 30.5% | 13.8 | 0.7 |
| ASAN | 828.1 | 9.9% | -109.7 | -0.7 |
| ROP | 8,434.6 | 7.6% | 3,292.8 | 25.3 |
Source: Yahoo Finance
MNDY’s revenue growth of 21.9% TTM sits between FRSH at 16.0% and TEAM at 27.6%, while MDB leads at 30.5% and ROP trails at 7.6%. That middle position supports a premium to ROP and a discount to MDB, but not the kind of top-tier growth premium that would justify a wide gap to TEAM’s faster top-line expansion.
Valuation
| Company | Current Share Price (USD) | Trailing P/E | Forward P/E | EV/Revenue | EV/EBITDA | Price/Sales (TTM) | Price/Book (mrq) | Market Cap (USD Mil) | Enterprise Value (USD Mil) | Beta (5Y Monthly) | FCF Yield % (TTM) | Forward EPS | Analyst Target Price – Low | Analyst Target Price – Mean | Analyst Target Price – High | # Analyst Opinions |
|---|---|---|---|---|---|---|---|---|---|---|---|---|---|---|---|---|
| MNDY | 93.9 | 39.6 | 14 | 2.3 | 62.8 | 2.9 | 6.4 | 3,969 | 3,192 | 1.05 | 7.2% | 6.7 | 87 | 109 | 165 | 24 |
| FRSH | 14.3 | 22.7 | 17.2 | 3.4 | 53.5 | 4.1 | 4.2 | 3,723 | 3,078 | 0.76 | 7.0% | 0.8 | 12 | 15.1 | 25 | 14 |
| TEAM | 188.3 | — | 27.9 | 7.2 | 108.5 | 7.3 | 45.1 | 47,664 | 47,351 | 1.14 | 3.5% | 6.7 | 145 | 230.2 | 480 | 31 |
| MDB | 339.2 | 471.2 | 43.2 | 8.7 | 1,751.3 | 9.8 | 9.2 | 27,328 | 24,262 | 1.74 | 2.1% | 7.9 | 335 | 452.5 | 565 | 36 |
| ASAN | 11.1 | — | 24.5 | 3 | -22.3 | 3.1 | 24.6 | 2,546 | 2,451 | 0.96 | 7.7% | 0.5 | 6.2 | 10.2 | 15 | 13 |
| ROP | 474.7 | 18.8 | 19.3 | 6.7 | 17.3 | 5.6 | 2.5 | 46,951 | 56,883 | 0.66 | 5.2% | 24.6 | 335 | 466.8 | 550 | 14 |
Source: Yahoo Finance
MNDY’s 2.3x EV/revenue is cheaper than FRSH at 3.4x, ASAN at 3.0x, TEAM at 7.2x, and MDB at 8.7x, so the stock looks inexpensive versus the faster growers and only modestly richer than ASAN despite stronger revenue growth. On a $1 invested basis, MNDY’s -53.6% one-year return is far weaker than FRSH’s 27.1% and TEAM’s 6.2%, which tells me the market has not rewarded the growth profile with momentum. That gap matters because the stock is not getting a growth premium from sentiment either; the multiple is being held down by the market’s skepticism about how quickly revenue growth can turn into durable earnings. Using the peer EV/revenue range on MNDY’s $1.37B of TTM revenue gives an implied enterprise value well above the current $3.2B EV, which is why I think the stock is cheap relative to peers on a headline basis but still needs margin proof before it deserves a rerating.
Profitability
| Company | Operating Margin (TTM) | Net Margin (TTM) | Return on Assets (TTM) | Return on Equity (TTM) | Gross Margin (TTM) | EBITDA Margin (TTM) |
|---|---|---|---|---|---|---|
| MNDY | 5.5% | 8.9% | 1.4% | 13.4% | 88.7% | 3.7% |
| FRSH | 5.5% | 20.5% | 1.6% | 19.7% | 85.0% | 6.4% |
| TEAM | 12.3% | -0.8% | 3.0% | -4.5% | 85.6% | 6.6% |
| MDB | 3.7% | 2.1% | -0.2% | 2.0% | 72.7% | 0.5% |
| ASAN | -19.0% | -18.6% | -9.3% | -93.8% | 87.6% | -13.2% |
| ROP | 28.7% | 30.7% | 4.3% | 13.2% | 69.7% | 39.0% |
Source: Yahoo Finance
MNDY’s gross margin of 88.7% is the best in the set, but operating margin of 5.5% and EBITDA margin of 3.7% lag ROP’s 28.7% and 39.0%, FRSH’s 5.5% and 6.4%, and TEAM’s 12.3% and 6.6%. The pattern points to a scale and opex gap rather than a cost-of-revenue problem, because MNDY’s gross margin is elite while its operating and EBITDA margins are held back by heavier sales and product investment. ROE of 13.4% is respectable, but it is not enough to offset the fact that the company is still behind the best peers on operating efficiency.
Leverage
| Company | Total Debt/Equity % (mrq) | Current Ratio (mrq) | Total Debt (mrq, USD Mil) | Operating Cash Flow TTM (USD Mil) | Free Cash Flow TTM (USD Mil) | Net Debt/EBITDA (TTM) | FCF Margin % (TTM) |
|---|---|---|---|---|---|---|---|
| MNDY | 38.4 | 1.5 | 237.5 | 314.9 | 284.6 | -16.4 | 20.8% |
| FRSH | 3.9 | 1.7 | 34.6 | 246.7 | 260.8 | -10.9 | 28.8% |
| TEAM | 116.5 | 0.8 | 1,232.9 | 1,353.1 | 1,655.5 | 0 | 25.2% |
| MDB | 1.8 | 4.9 | 55 | 666.6 | 561.4 | -170.1 | 20.2% |
| ASAN | 247.6 | 0.9 | 258.3 | 130.1 | 197.1 | 0.7 | 23.8% |
| ROP | 50.7 | 0.4 | 9,719.7 | 2,620.2 | 2,435.2 | 2.9 | 28.9% |
Source: Yahoo Finance
Leverage is a clear strength. MNDY’s debt/equity of 38.4% is far below TEAM’s 116.5% and ASAN’s 247.6%, while its net debt/EBITDA of -16.4x shows net cash rather than leverage, unlike ROP at 2.9x and ASAN at 0.7x. Its FCF margin of 20.8% is solid, though below FRSH’s 28.8% and ROP’s 28.9%, which means the balance sheet is a support but not the main reason to own the stock. Lower leverage also helps explain why MNDY can trade at a lower EV/revenue multiple than some peers without looking distressed.
Conclusion
The key tension is that monday.com is growing fast enough to justify attention, but not yet fast enough in earnings terms to justify a full rerating. I would put my rating as a hold because the company still needs to prove that 21.9% revenue growth can translate into a sustained move in EBITDA margin, and that proof is what would unlock the next leg of upside. If EBITDA margin moves into the low double digits, meaning the business is finally converting scale into meaningful operating profit, I would raise my rating more towards a buy; if revenue growth slips below 15% and operating margin drifts back toward the low single digits, I would move from hold to sell because the current multiple would be leaning on growth that is no longer holding. I would also watch FCF margin: a sustained drop below 15% would tell me the 7.2% FCF yield is less durable than it looks. For now, the cash balance and net cash position give the company time, but the market will eventually want to see the margin line catch up with the revenue line.
What to Watch Next
- Revenue growth above 20% for the next two quarters — would support a move toward buy.
- EBITDA margin in the low double digits — would show operating leverage is taking hold.
- Operating margin staying positive and rising — would confirm the profit base is improving.
- FCF margin holding above 15% — would support the durability of the current cash yield.
- Revenue growth below 15% — would strengthen the case for a more cautious rating.
What’s your take? I rated monday.com (MNDY) HOLD above — but the goal here is to get this right, not just to publish an opinion. What would you add to this analysis, or which risk or catalyst do you think I’m under- or over-weighting? Tell me in the comments.
Our track record: every directional call is tracked publicly on The Scorecard, and Stocks Covered lists every company we have rated and when.
Sources
Data sourced from Yahoo Finance and SEC EDGAR. Not investment advice.
Leave a Comment