Expected price range
Each range is set from the stock’s recent price history and our Hold rating, using its own 1-year realised volatility (36% annualised) as the width of a ~68% statistical band, and checked against that rating so the range leans the same way as our view. Starting price $131 (close 2026-11-03). The stock traded between $64.12 and $131 over the last 6 months and between $61.63 and $131 over the last year. This is an illustration of where our view and normal volatility point, not a forecast, price target or investment advice; the stock can move outside it.
| Company | Nov 25 | Dec 25 | Jan 26 | Feb 26 | Mar 26 | Apr 26 | May 26 | Jun 26 | Jul 26 | Aug 26 | Sep 26 | Oct 26 | 12-Mo |
|---|---|---|---|---|---|---|---|---|---|---|---|---|---|
| HALO | +10% | -6% | +7% | -3% | -7% | -2% | +5% | +18% | +5% | +29% | +4% | +19% | +101% |
| BCRX | -2% | +9% | -16% | +33% | +9% | -4% | -3% | +12% | -10% | +8% | -14% | +2% | +16% |
| GMAB | +13% | -5% | +6% | -10% | -9% | -1% | -1% | +4% | +5% | +15% | +8% | +60% | +99% |
| LGND | +6% | -7% | +2% | +3% | +1% | +15% | +1% | +36% | -9% | -1% | +10% | +3% | +69% |
| RPRX | +7% | -3% | +8% | +11% | +4% | +4% | +12% | +1% | +4% | +6% | -5% | +15% | +82% |
| ARGX | +11% | -8% | -0% | -9% | -5% | +7% | +7% | +11% | -8% | +21% | -7% | -7% | +9% |
Source: Yahoo Finance monthly adjusted close.
Quick Thesis
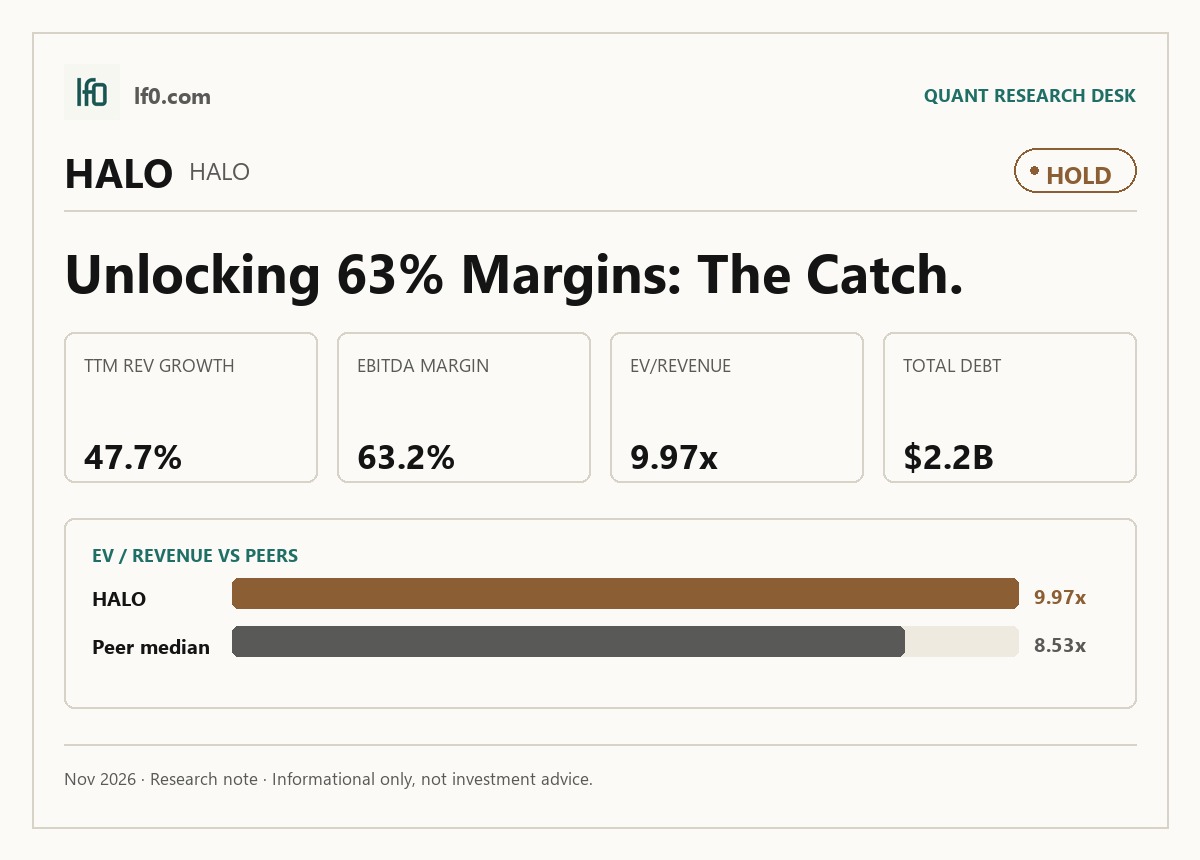
- Rated hold — strong growth and margins, but the stock already discounts much of it.
- Revenue reached $481M in Q2 2026; EBITDA was $324.5M.
- Main risk: $2.2B of debt, with net debt/EBITDA at 1.9x.
- Valuation is not cheap at 10.0x EV/revenue and 15.8x EV/EBITDA.
- I would turn more constructive if forward EPS stays above 10.7 and cash flow holds.
Executive Summary
Rating: HOLD | HALO
We’ll begin tracking this call’s performance since publication once sufficient adjusted-close data is available.
I would put my rating as a hold because Halozyme has already proven the core economics of its ENHANZE royalty model, but the current share price leaves limited room for error. The latest quarter showed $481M of revenue and $324.5M of EBITDA, which confirms that the platform is still scaling, yet the market is already paying 10.0x EV/revenue and 15.8x EV/EBITDA for that quality. In my view, the key question is not whether the business works; it does. The question is whether growth can keep compounding fast enough to justify a valuation that already reflects strong execution.
I would become more constructive if quarterly revenue stays above $450M and EBITDA stays above $300M, because that would show the Q2 2026 step-up was not a one-off and that cash generation is still broadening. If those levels hold, forward EPS of 10.7 would look more secure and the 1.9x net debt/EBITDA ratio would look easier to carry.
Company Profile
Halozyme Therapeutics is a biopharmaceutical company built around drug-delivery technology. Its ENHANZE platform uses recombinant human hyaluronidase, or rHuPH20, to enable subcutaneous delivery of high-dose biologics, while Hypercon and Surf Bio are aimed at raising antibody concentrations to about 500 mg/mL so drugs can be delivered in smaller injection volumes.
The company earns revenue from licensing ENHANZE, selling bulk rHuPH20, collecting milestones, and receiving royalties on approved partner products. It was founded in 1998, went public in 2004, and expanded through the 2025 acquisition of Elektrofi, which it renamed Halozyme Hypercon. Halozyme is headquartered in San Diego and has 423 full-time employees.
Economic Moat
Business Model
The moat is the installed base around ENHANZE. Halozyme already earns royalties from ten commercial products, including five Roche products, two Janssen products, and one product each from Takeda, argenx, and Bristol Myers Squibb, so the platform is not just a scientific asset but a recurring revenue engine. I also think the partner network itself matters: 13 collaborations tied to ten approved products create switching friction and make the franchise harder to displace quickly.
The patent estate reinforces that advantage. rHuPH20 patents run into 2027 in the U.S. and 2029 in Europe, while Hypercon and Surf Bio patents extend into the mid-2040s, which gives Halozyme time to monetize the platform across multiple product cycles. That is the structural reason I view the business as more durable than a typical single-asset biotech.
Business & Operating Risks
The biggest disclosed risk is dependence on rHuPH20. If Halozyme were to lose proprietary rights, face a regulatory setback, or struggle to source enough material, the hit would flow directly into current and potential ENHANZE collaborations as well as Hylenex recombinant. The company also relies on third parties for bulk rHuPH20, raw materials, fill-finish, packaging, storage, and shipping, and some of those suppliers are single source, so operational disruption would matter quickly.
Leverage is the other material risk. Total debt was $2.2B, and the company still carries a large convertible stack, so financing flexibility is not unlimited even though cash generation is solid. In my view, these risks do not break the moat itself, but they do threaten the cash conversion that makes the moat valuable.
Management Discussion & Analysis
Management is responding to those risks mainly by extending maturities and broadening the platform rather than by shrinking the business. The 2025 convertible issuance, note repurchases, and credit-facility amendment pushed out refinancing pressure, while the Elektrofi acquisition expanded the delivery portfolio beyond ENHANZE. That is the right response to concentration risk, although the leverage burden remains in place.
The operating tone is still constructive. Royalties rose to $867.8M in 2025 from $571M in 2024, and product sales also moved higher, which tells me management’s core growth narrative is still being validated by the numbers. At the same time, the ATRS-1902 discontinuation and acquisition-related charges show that management is still willing to prune weaker programs, which I see as disciplined but not flawless execution.
Recent Events
The most important recent event was the CFO transition. Halozyme appointed David Ramsay as interim CFO in March 2026 and then named Darren Snellgrove permanent CFO effective June 8, 2026. I read that as a modest positive for capital allocation and investor communication rather than a strategic reset.
Governance also became a little cleaner. The board amended the bylaws in April 2026 to clarify director removal and shareholder action mechanics, which is neutral for operations but reduces ambiguity around control provisions. The annual meeting and first-quarter 2026 filing were routine, so the main takeaway is continuity: the company is not in the middle of a disruptive leadership change.
Financial Analysis
Growth
HALO — Financial Growth (Quarterly, USD Mil)
| Metric | 2025-06-30 | 2025-09-30 | 2025-12-31 | 2026-03-31 | 2026-06-30 |
|---|---|---|---|---|---|
| REVENUE (USD Mil) | 325.7 | 354.3 | 451.8 | 376.7 | 481 |
| EBIT (USD Mil) | 209.3 | 223.3 | -95.9 | 185.8 | 290.5 |
| EBITDA (USD Mil) | 229.8 | 243.7 | -69.3 | 219.6 | 324.5 |
| NET INCOME (USD Mil) | 165.2 | 175.2 | -141.6 | 150 | 229.9 |
| DILUTED EPS | 1.3 | 1.4 | -1.2 | 1.2 | 1.9 |
Source: Yahoo Finance — Quarterly Financial Statements
Revenue rose from $325.7M in Q2 2025 to $481M in Q2 2026, and the latest quarter was up 47.7% year over year. That is the kind of growth that can support a premium multiple, especially when it is paired with a royalty model rather than a capital-heavy product business.
The volatility matters, though. Revenue dipped to $376.7M in Q1 2026 after a strong Q4 2025, so I do not read the growth profile as perfectly smooth. Even so, EBITDA reached $324.5M in Q2 2026, which tells me the business is still converting top-line growth into operating scale rather than just chasing revenue.
Profitability
HALO — Profitability (TTM)
| Metric | TTM |
|---|---|
| Operating Margin (TTM) | 59.8% |
| Net Margin (TTM) | 24.9% |
| Return on Assets (TTM) | 25.5% |
| Return on Equity (TTM) | 173.7% |
| Gross Margin (TTM) | 76.3% |
| EBITDA Margin (TTM) | 63.1% |
Source: Yahoo Finance — Trailing Twelve Months (TTM)
TTM operating margin was 59.8%, gross margin was 76.3%, and EBITDA margin was 63.1%. Those are elite margins for a biopharma company and they confirm that the ENHANZE model has real pricing power.
Net margin was 24.9%, which is much lower than operating margin, so below-the-line items still matter. Return on assets was 25.5% and return on equity was 174%, and that gap tells me leverage is amplifying equity returns rather than the business simply earning high returns on a large asset base. I view that as a strength, but it also means the equity story is more sensitive to financing conditions than the operating margin alone suggests.
Valuation
HALO — Valuation Multiples
| Metric | Value |
|---|---|
| Current Share Price (USD) | 130.8 |
| Market Cap (USD Mil) | 14,846 |
| Enterprise Value (USD Mil) | 16,583 |
| Forward P/E | 12.2 |
| Price/Sales (TTM) | 8.9 |
| EV/Revenue | 10 |
| EV/EBITDA | 15.8 |
| Beta (5Y Monthly) | 0.90 |
| FCF Yield % (TTM) | 2.3% |
| Forward EPS (USD) | 10.7 |
| Analyst Target Price – Low (USD) | 79 |
| Analyst Target Price – Mean (USD) | 108.9 |
| Analyst Target Price – High (USD) | 130 |
| # Analyst Opinions | 9 |
Source: Yahoo Finance
Halozyme trades at 10.0x EV/revenue, 15.8x EV/EBITDA, and 12.2x forward P/E, with a current share price of $130.8 and a market cap of $14.8B. The forward EPS figure of 10.7 is the key bridge between the current multiple and the operating performance, because it shows the market is paying for earnings power that has not fully shown up in trailing results.
On my read, fair value sits around $110-$135 per share. That range is close to the analyst target mean of 108.9 and high of 130, so I am not fighting the consensus here; I am saying the market is already near the upper end of what the current cash-flow profile justifies. The range is also consistent with the peer picture: Halozyme’s earnings power is stronger than most peers, but its leverage is higher than the cleaner balance sheets in the group, so I would not pay a large premium to the peer set.
I would also frame the EPS range as roughly $10-$11 per share on the current run rate. That sits above BCRX and GMAB on a raw dollar basis, but the comparison is not just about size; it reflects Halozyme’s much higher margin profile and its ability to turn revenue into cash more efficiently than most peers. In that sense, the stock is not cheap, but it is not priced as if growth has already broken either.
Leverage
HALO — Leverage & Coverage (Quarterly)
| Metric | Value |
|---|---|
| Total Debt/Equity % (mrq) | 1,517.7 |
| Current Ratio (mrq) | 2.7 |
| Total Debt (mrq, USD Mil) | 2,178.5 |
| Operating Cash Flow (TTM, USD Mil) | 818.6 |
| Levered Free Cash Flow (TTM, USD Mil) | 337.3 |
| Net Debt/EBITDA (TTM) | 1.9 |
| FCF Margin % (TTM) | 20.3% |
Source: Yahoo Finance — Quarterly Financial Statements
Total debt was $2.2B, and total debt/equity was 1,517.7%, which is a very levered capital structure on an accounting basis. The more useful read is net debt/EBITDA at 1.9x, because that shows the company is not stretched in cash-flow terms.
Liquidity is still comfortable. Current ratio was 2.7x, operating cash flow was $818.6M, and levered free cash flow was $337.3M over the last twelve months. That combination tells me the balance sheet is manageable, but only because the business is generating enough cash to support it; if cash conversion weakens, the debt load becomes much more visible very quickly.
Insider Activity
Insider activity has been one-sided. There were 61 open-market sales and no open-market purchases over the period shown, with most of the selling concentrated in Helen Torley’s hands. I do not treat that as a thesis breaker, but it does weaken alignment at the margin because there is no offsetting insider buying to balance the signal.
Comparable Analysis
Growth
| Company | Revenue TTM (USD Mil) | Revenue Growth YoY % | Diluted EPS TTM |
|---|---|---|---|
| HALO | 1,663.7 | 47.7% | 3.4 |
| BCRX | 940.6 | 33.6% | -1.4 |
| GMAB | 4,131 | 24.9% | 1.3 |
| LGND | 253.8 | -31.8% | 9.5 |
| RPRX | 2,536 | 16.5% | 1.9 |
| ARGX | 5,915.5 | 52.1% | 28.9 |
Source: Yahoo Finance
Halozyme’s 47.7% revenue growth outpaced BCRX at 33.6%, GMAB at 24.9%, RPRX at 16.5%, and even ARGX at 52.1% was only modestly ahead. The important point is that Halozyme is growing faster than most peers while already operating at much larger scale than BCRX, which makes the growth more meaningful than a small-base spike.
Valuation
| Company | Current Share Price (USD) | Trailing P/E | Forward P/E | EV/Revenue | EV/EBITDA | Price/Sales (TTM) | Price/Book (mrq) | Beta (5Y Monthly) | FCF Yield % (TTM) | Forward EPS | Analyst Target Price – Low | Analyst Target Price – Mean | Analyst Target Price – High | # Analyst Opinions |
|---|---|---|---|---|---|---|---|---|---|---|---|---|---|---|
| HALO | 130.8 | 38.2 | 12.2 | 10 | 15.8 | 8.9 | 103.9 | 0.90 | 2.3% | 10.7 | 79 | 108.9 | 130 | 9 |
| BCRX | 8.4 | — | 10.2 | 2.8 | 6 | 2.3 | -4.7 | 0.51 | 15.0% | 0.8 | 11 | 20.5 | 32 | 11 |
| GMAB | 55.5 | 43.7 | 35.1 | 8.8 | 26.5 | 8.3 | 5.6 | 0.55 | 2.5% | 1.6 | 48 | 65 | 80 | 10 |
| LGND | 317 | 33.4 | 26.5 | 27 | 95.8 | 25 | 6.5 | 1.03 | 1.0% | 12 | 247 | 350.9 | 406 | 12 |
| RPRX | 67.2 | 35.8 | 11.6 | 16 | 26.1 | 15.3 | 4.4 | 0.36 | -3.1% | 5.8 | 61 | 65.4 | 70 | 8 |
| ARGX | 884 | 30.6 | 26.5 | 8.5 | 26.5 | 9.4 | 164.2 | -0.07 | — | 33.3 | 861 | 1,147.3 | 1,353 | 23 |
Source: Yahoo Finance
Halozyme’s 10.0x EV/revenue and 12.2x forward P/E sit above BCRX’s 2.8x and 10.2x, but below LGND’s 27.0x and 26.5x. Its 10.7 forward EPS is much higher than BCRX’s $0.8 and GMAB’s $1.6, which helps explain why the market is willing to pay a premium for Halozyme’s earnings stream. I would not call the stock cheap versus peers, but I also would not call it the most expensive name in the group once earnings power is adjusted for.
Profitability
| Company | Operating Margin (TTM) | Net Margin (TTM) | Return on Assets (TTM) | Return on Equity (TTM) | Gross Margin (TTM) | EBITDA Margin (TTM) |
|---|---|---|---|---|---|---|
| HALO | 59.8% | 24.9% | 25.5% | 173.7% | 76.3% | 63.1% |
| BCRX | 45.1% | -40.9% | 52.9% | — | 77.4% | 46.0% |
| GMAB | 35.2% | 19.1% | 8.8% | 14.0% | 93.0% | 33.3% |
| LGND | -12.1% | 20.3% | 1.2% | 5.4% | 86.1% | 28.2% |
| RPRX | 19.7% | 32.0% | 5.1% | 14.0% | 95.8% | 61.4% |
| ARGX | 36.3% | 31.7% | — | — | 59.8% | 32.1% |
Source: Yahoo Finance
Halozyme’s 59.8% operating margin and 63.1% EBITDA margin are stronger than BCRX’s 45.1% and 46.0%, GMAB’s 35.2% and 33.3%, and RPRX’s 19.7% and 61.4%. Its 24.9% net margin also compares well, which tells me the business is not just growing faster; it is keeping more of each dollar of revenue than most peers.
Leverage
| Company | Total Debt/Equity % (mrq) | Current Ratio (mrq) | Operating Cash Flow TTM (USD Mil) | Free Cash Flow TTM (USD Mil) | Net Debt/EBITDA (TTM) | FCF Margin % (TTM) |
|---|---|---|---|---|---|---|
| HALO | 1,517.7 | 2.7 | 818.6 | 337.3 | 1.9 | 20.3% |
| BCRX | — | 2.3 | 376.1 | 323.7 | 1.1 | 34.4% |
| GMAB | 88.5 | 2.5 | 891 | 870.6 | 2.7 | 21.1% |
| LGND | 120 | 1.2 | 91 | 62.5 | 9.9 | 24.6% |
| RPRX | 91.6 | 2.8 | 2,976.5 | -1,195.4 | 5.2 | -47.1% |
| ARGX | 0.6 | — | — | — | -2.7 | — |
Source: Yahoo Finance
Halozyme’s 1,517.7% debt/equity is far above the peer group, but its 1.9x net debt/EBITDA is still manageable relative to the cash it generates. That is why I think the valuation premium is partly offset by balance-sheet risk: the market is paying for earnings quality, but it is also asking investors to accept more leverage than the cleaner peers carry.
Conclusion
I would put my rating as a hold because the core business is already doing what a premium biotech royalty model should do, but the market has largely priced that success in. The tension is straightforward: Halozyme is still growing quickly and producing strong margins, yet the shares already trade at 10.0x EV/revenue and 15.8x EV/EBITDA, so the upside from here depends on execution staying very strong.
What would change my view is a sustained quarterly revenue run rate above $450M and EBITDA above $300M. Those levels would tell me the Q2 2026 step-up is durable, not just a good quarter, and they would make the current 10.7 forward EPS look more secure. If that happens while free cash flow stays near the current $337.3M pace, the leverage profile becomes easier to live with and the stock would deserve a higher rating.
The downside case is also clear. If revenue falls back below $350M for two straight quarters, or if EBITDA slips back toward $220M, I would worry that the current valuation is leaning on a peak earnings base. That would matter quickly because the company still carries $2.2B of debt, so a weaker cash cycle would hit both the multiple and the balance sheet at the same time.
My final view is that the stock is already close to fairly valued for the quality on offer. I would want either a cleaner balance sheet or another leg of earnings acceleration before moving more bullish.
What to Watch Next
- Quarterly revenue above $450M — would support a higher rating.
- Quarterly EBITDA above $300M — would confirm the earnings base is still expanding.
- Free cash flow near $337M TTM — would keep leverage manageable.
- Net debt/EBITDA near 1.9x or lower — would reduce balance-sheet concern.
- Two straight quarters below $350M revenue — would strengthen the bear case.
What’s your take? I rated Halozyme (HALO) HOLD above — but the goal here is to get this right, not just to publish an opinion. What would you add to this analysis, or which risk or catalyst do you think I’m under- or over-weighting? Tell me in the comments.
Our track record: every directional call is tracked publicly on The Scorecard, and Stocks Covered lists every company we have rated and when.
Sources
- SEC 10-K Annual Report — filed 2026-02-17
- SEC 8-K Filing (2026-05-11)
- SEC 8-K Filing (2026-05-07)
- SEC 8-K Filing (2026-04-30)
- SEC 8-K Filing (2026-04-24)
- SEC 8-K Filing (2026-03-12)
- SEC 8-K Filing (2026-02-17)
- SEC Form 4 Insider Transaction (2026-06-03)
- SEC Form 4 Insider Transaction (2026-06-02)
- SEC Form 4 Insider Transaction (2026-05-13)
- SEC 10-K Annual Report — FY2026
- SEC 10-K Annual Report — FY2025
- SEC 10-K Annual Report — FY2024
- SEC 10-K Annual Report — FY2023
- SEC 10-K Annual Report — FY2022
Data sourced from Yahoo Finance and SEC EDGAR. Not investment advice.
Leave a Comment