
Expected price range
Each range is a ~68% statistical band built from the stock’s own 1-year realised volatility (27% annualised), centred on a path that closes a quarter of the gap to our fair-value midpoint by 3 months and half by 6 months. Starting price $1,140 (close 2026-10-19). This is an illustration of where our view and normal volatility point, not a forecast, price target or investment advice; the stock can move outside it.
| Company | Oct 25 | Nov 25 | Dec 25 | Jan 26 | Feb 26 | Mar 26 | Apr 26 | May 26 | Jun 26 | Jul 26 | Aug 26 | Sep 26 | 12-Mo |
|---|---|---|---|---|---|---|---|---|---|---|---|---|---|
| TDG | -1% | +4% | -2% | +7% | -9% | -11% | +0% | +8% | +6% | -6% | -7% | -8% | -18% |
| HEI | -2% | -0% | +2% | +2% | -3% | -14% | -2% | +29% | +2% | +0% | -7% | -8% | -6% |
| HONA | — | — | — | — | — | — | — | — | — | -6% | -24% | -2% | -30% |
| LHX | -5% | -3% | +5% | +17% | +6% | -5% | -7% | -2% | -7% | -5% | -4% | -11% | -21% |
| RNMBY | -16% | -14% | +8% | +15% | -6% | -15% | -6% | -4% | -24% | +15% | -2% | -17% | -53% |
Source: Yahoo Finance monthly adjusted close.
Quick Thesis
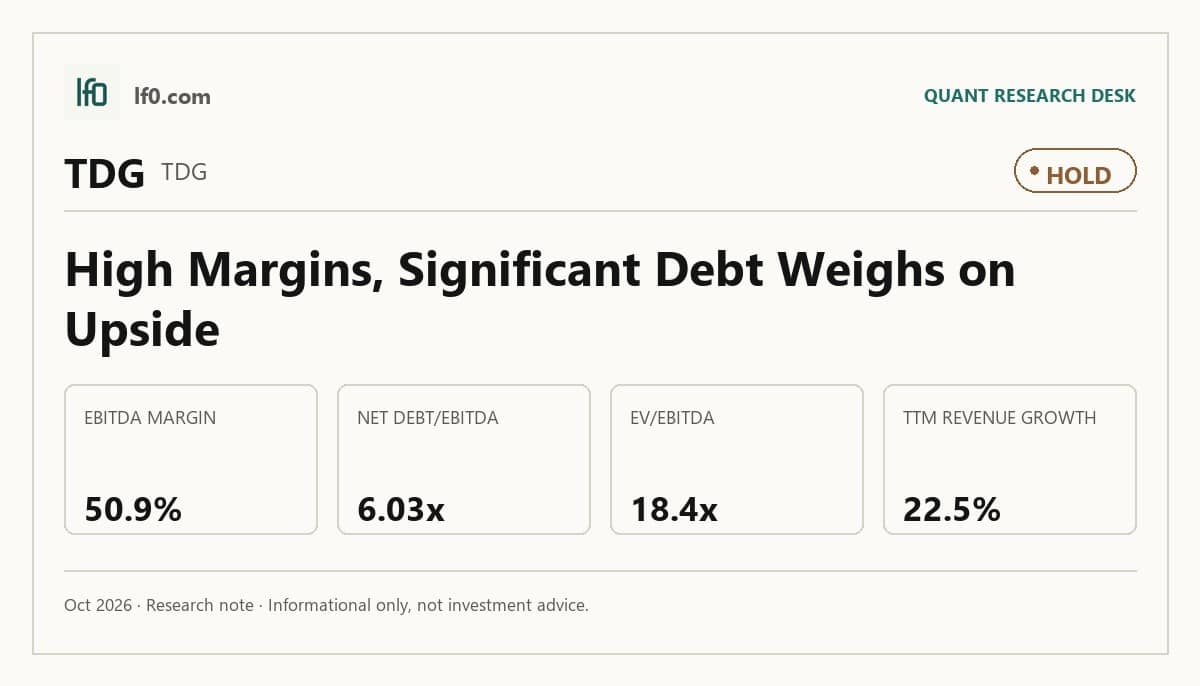
- Hold — installed-base cash generation is strong, but leverage caps upside.
- EBITDA margin is 50.9% TTM, a clear operating strength.
- Net debt/EBITDA is 6.0x TTM, the main risk to the equity.
- TDG trades at 18.4x EV/EBITDA, richer than lower-leverage peers.
- I would turn more constructive if net debt/EBITDA fell below 5.5x.
Executive Summary
Rating: HOLD | TDG
Measured from adjusted close on 2026-10-19 to 2026-10-19. Sell ratings are correct when the stock falls; Hold is tracked as a +/-10% range. Daily-close data, not intraday. Calls are tracked for 182 days from publication, then frozen as a final record.
I would put my rating as a Hold because TransDigm’s installed-base model still produces exceptional margins, but the stock already prices in that quality and leaves limited room for error. The business converts revenue into a 50.9% EBITDA margin and a 14.6% free cash flow margin, which is exactly the kind of cash engine that can support a premium multiple. What keeps me from being more bullish is the balance sheet: $33.5B of debt and 6.0x net debt to EBITDA mean the equity is still tied to refinancing discipline as much as to operating execution. I would raise my rating more towards a Buy if net debt to EBITDA moved below 5.5x, meaning the company is clearly shrinking leverage rather than simply carrying it.
Company Profile
TransDigm Group designs, produces, and supplies highly engineered aircraft components for commercial and military aircraft. About 16,600 employees as of September 30, 2024. The company was founded in 1993 and has acquired 93 businesses and product lines since then, building a portfolio across power and control, airframe, and non-aviation products. It operates about 120 manufacturing facilities worldwide and had about 16,600 employees as of September 30, 2024.
Economic Moat
Business Model
The aftermarket installed base is the central advantage here. Approximately 55% of fiscal 2024 net sales came from aftermarket demand, and a part can stay relevant for 25 to 30 years across a platform life cycle that often exceeds 50 years. I feel that this is hard for a competitor to replicate quickly because it depends on certification, design wins, and long-lived fleet penetration rather than just capital spending. Proprietary products accounted for about 90% of fiscal 2024 net sales, which supports pricing power and helps explain why the company avoids lower-margin build-to-print work. That mix is consistent with the 50.9% EBITDA margin in the financials and is the clearest sign that the moat is still working.
Business & Operating Risks
The most material risk is leverage. According to the risk factors in the SEC 10-K, total indebtedness was about $24 billion as of September 30, 2024, and the company also had $843 million of unused revolver capacity plus $163 million of additional borrowing capacity under the Securitization Facility that was subsequently drawn in October 2024. The filing warns that a covenant breach or failure to meet the leverage ratio could trigger default, and that matters because the equity has less room to absorb a downturn when debt is this large. Customer concentration is the next risk: the top ten customers accounted for about 42% of fiscal 2024 net sales, so a production cut or resourcing decision by one large buyer could move results materially. Fixed-price contracts and limited pass-through on raw materials, taxes, and labor add another layer of pressure. These risks do not break the moat itself, but they do threaten the cash conversion that the moat is supposed to produce.
Management Discussion & Analysis
Management is responding to those risks with liquidity management, but not with deleveraging. The company completed about $21B of debt financing transactions in fiscal 2024, including new senior debt and secured debt, while also paying special dividends in November 2023 and October 2024. That tells me capital allocation still favors shareholder payouts and acquisition capacity over balance-sheet repair. The company also lifted revolving credit commitments and securitization capacity, which extends flexibility but does not reduce the debt burden. In my view, management is actively preserving operating flexibility, yet it is not yet addressing the leverage risk in a way that would materially de-risk the equity.
Recent Events
The September 19, 2024 financing package is the clearest recent event because it added $3B of new secured debt to fund a $75.00 per share special dividend and related option payments. That strengthens the capital return profile, but it also confirms that the company is willing to add leverage to extract cash for shareholders. The September 3 announcement and September 5 note pricing pointed in the same direction: management telegraphed a large special dividend and then locked in the financing. The recent filings therefore reinforce the same thesis rather than changing it — the moat remains intact, but the balance sheet is being used aggressively to monetize it.
Financial Analysis
Growth
TDG — Financial Growth (Quarterly, USD Mil)
| Metric | 2025-06-30 | 2025-09-30 | 2025-12-31 | 2026-03-31 | 2026-06-30 |
|---|---|---|---|---|---|
| REVENUE (USD Mil) | 2,237 | 2,437 | 2,285 | 2,544 | 2,741 |
| EBIT (USD Mil) | 1,032 | 1,173 | 1,047 | 1,184 | 1,227 |
| EBITDA (USD Mil) | 1,124 | 1,269 | 1,147 | 1,289 | 1,346 |
| NET INCOME (USD Mil) | 492 | 610 | 445 | 535 | 539 |
| DILUTED EPS | 8.5 | 7.8 | 6.6 | 9.2 | 9.4 |
Source: Yahoo Finance — Quarterly Financial Statements
Revenue rose from $2.2B in the June 2025 quarter to $2.7B in the June 2026 quarter, while EBITDA increased from $1.1B to $1.3B over the same span. That is not just top-line growth; it shows the installed-base model is still converting into higher absolute earnings. The quarter-to-quarter pattern was uneven, but the longer trend is constructive, and it fits the moat described above because proprietary aftermarket demand is still compounding into scale.
Profitability
TDG — Profitability (TTM)
| Metric | TTM |
|---|---|
| Operating Margin (TTM) | 46.0% |
| Net Margin (TTM) | 21.3% |
| Return on Assets (TTM) | 11.8% |
| Return on Equity (TTM) | — |
| Gross Margin (TTM) | 59.8% |
| EBITDA Margin (TTM) | 50.9% |
Source: Yahoo Finance — Trailing Twelve Months (TTM)
TTM operating margin was 46.0%, gross margin was 59.8%, and EBITDA margin was 50.9%. The spread between gross and operating margin shows the business still carries meaningful overhead, but the overall margin stack remains unusually strong for an industrial company. Net margin was 21.3%, which is lower because interest and taxes take a large share of earnings, so I weight operating and EBITDA margins more heavily here. TTM return on assets was 11.8%, which confirms the asset base is still productive even with the leverage load. The key point is that the moat is visible in the margins, but the debt structure means more of that operating strength is being diverted before it reaches equity holders.
Valuation
TDG — Valuation Multiples
| Metric | Value |
|---|---|
| Current Share Price (USD) | 1,140.8 |
| Market Cap (USD Mil) | 63,807 |
| Enterprise Value (USD Mil) | 93,774 |
| Trailing P/E | 34.6 |
| Forward P/E | 23.4 |
| Price/Sales (TTM) | 6.4 |
| Price/Book (mrq) | -6.4 |
| EV/Revenue | 9.4 |
| EV/EBITDA | 18.4 |
| Beta (5Y Monthly) | 0.94 |
| FCF Yield % (TTM) | 2.3% |
| Forward EPS (USD) | 48.7 |
| Analyst Target Price – Low (USD) | 1,100 |
| Analyst Target Price – Mean (USD) | 1,414.3 |
| Analyst Target Price – High (USD) | 1,745 |
| # Analyst Opinions | 20 |
Source: Yahoo Finance
TransDigm trades at 18.4x EV/EBITDA, 23.4x forward P/E, 9.37x EV/revenue, and 2.3% FCF yield. Those are rich multiples, but they are tied to a business with a 50.9% EBITDA margin and 14.6% free cash flow margin, so the market is paying for quality rather than for a generic industrial profile. On the analysis here, I would put fair value in a range of about $1,050-$1,350 per share. That sits inside the analyst target range of 1,100 to 1,745 and below the 1,414 mean, because I put more weight on the 6.0x net debt to EBITDA burden than the consensus appears to. Forward EPS is 48.7, which implies the stock is not cheap on earnings either, and the valuation only works if the company keeps compounding cash flow faster than leverage drifts higher. The merged rating case is the same: the business quality is real, but the current price already reflects a lot of it.
Leverage
TDG — Leverage & Coverage (Quarterly)
| Metric | Value |
|---|---|
| Total Debt/Equity % (mrq) | — |
| Current Ratio (mrq) | 3 |
| Total Debt (mrq, USD Mil) | 33,485 |
| Operating Cash Flow (TTM, USD Mil) | 2,198 |
| Levered Free Cash Flow (TTM, USD Mil) | 1,457.4 |
| Net Debt/EBITDA (TTM) | 6 |
| FCF Margin % (TTM) | 14.6% |
Source: Yahoo Finance — Quarterly Financial Statements
Total debt was $33.5B, current ratio was 3.0, operating cash flow was $2.2B, and levered free cash flow was $1.5B. Net debt/EBITDA was 6.0x and FCF margin was 14.6%, which means the company still converts earnings into cash, but not fast enough to make leverage irrelevant. I would not call this a stressed balance sheet, but I also would not call it a balance-sheet advantage. The debt load is manageable today because liquidity is solid, yet the equity remains exposed if cash flow softens before the next refinancing window.
Insider Activity
The insider transaction record is overwhelmingly net selling, with 513 open-market sales versus 2 open-market purchases across 59 filings. The activity is concentrated rather than broad, led by Nicholas Howley and a smaller set from Joel Reiss. I read that as a negative signal for alignment, even if some of the selling is routine, because the open-market pattern is heavily one-sided.
Comparable Analysis
LF0 has published standalone analyses of these peers: L3Harris Technologies (LHX) (rated Sell).
Growth
| Company | Revenue TTM (USD Mil) | Revenue Growth YoY % | EBITDA TTM (USD Mil) | Diluted EPS TTM |
|---|---|---|---|---|
| TDG | 10,006 | 22.5% | 5,095 | 33 |
| HEI | 5,176.8 | 23.1% | 1,474.1 | 6 |
| HONA | 17,915 | 5.4% | 3,538 | 3.3 |
| LHX | 22,932 | 8.4% | 4,142 | 9.9 |
| RNMBY | 11,413 | 68.8% | 2,310 | 6 |
Source: Yahoo Finance
TDG’s revenue growth was 22.5% TTM, versus 23.1% for HEI, 5.4% for HONA, 8.4% for LHX, and 68.8% for RNMBY. TDG is not the fastest grower in the group, but it combines strong growth with much larger earnings power, which is why the market can justify a premium. The growth profile is strong enough to support the thesis, but not so unique that it overwhelms the leverage question.
Valuation
| Company | Current Share Price (USD) | Trailing P/E | Forward P/E | EV/Revenue | EV/EBITDA | Price/Sales (TTM) | Price/Book (mrq) | Market Cap (USD Mil) | Enterprise Value (USD Mil) | Beta (5Y Monthly) | FCF Yield % (TTM) | Forward EPS | Analyst Target Price – Low | Analyst Target Price – Mean | Analyst Target Price – High | # Analyst Opinions |
|---|---|---|---|---|---|---|---|---|---|---|---|---|---|---|---|---|
| TDG | 1,140.8 | 34.6 | 23.4 | 9.4 | 18.4 | 6.4 | -6.4 | 63,807 | 93,774 | 0.94 | 2.3% | 48.7 | 1,100 | 1,414.3 | 1,745 | 20 |
| HEI | 308.7 | 51.3 | 42.7 | 8.9 | 31.4 | 8.3 | 8.7 | 43,147 | 46,302 | 1.09 | 2.0% | 7.2 | 294 | 390.7 | 491 | 20 |
| HONA | 164.4 | 50.1 | 18.4 | 3.8 | 19.3 | 2.9 | -9.1 | 52,091 | 68,443 | — | — | 8.9 | 160 | 199.2 | 256 | 15 |
| LHX | 245.1 | 24.7 | 18.1 | 2.5 | 13.9 | 2 | 2.3 | 45,638 | 57,690 | 0.51 | 3.5% | 13.5 | 241 | 316.6 | 393 | 17 |
| RNMBY | 235.6 | 39.2 | 20.6 | 5.3 | 26.3 | 4.8 | 9.8 | 54,982 | 60,861 | 0.48 | 1.2% | 11.5 | 370.3 | 370.3 | 370.3 | 1 |
Source: Yahoo Finance
TDG trades at 18.4x EV/EBITDA and 23.4x forward P/E, compared with HEI at 31.4x EV/EBITDA and 42.7x forward P/E, HONA at 19.3x and 18.4x, LHX at 13.9x and 18.1x, and RNMBY at 26.3x and 20.6x. On a $1 invested basis, TDG has held up better than HONA, LHX, and RNMBY over the past year, but it still trails HEI, which tells me the market is rewarding quality while still discounting some balance-sheet risk. TDG’s richer multiple versus LHX is easier to defend because TDG’s margins are much higher, but the gap is less comfortable once leverage is folded in.
Profitability
| Company | Operating Margin (TTM) | Net Margin (TTM) | Return on Assets (TTM) | Return on Equity (TTM) | Gross Margin (TTM) | EBITDA Margin (TTM) |
|---|---|---|---|---|---|---|
| TDG | 46.0% | 21.3% | 11.8% | — | 59.8% | 50.9% |
| HEI | 25.1% | 16.4% | 8.5% | 17.7% | 40.4% | 28.5% |
| HONA | 14.7% | 10.9% | — | — | 34.5% | 19.8% |
| LHX | 12.6% | 8.2% | 4.4% | 9.3% | 25.5% | 18.1% |
| RNMBY | 14.4% | 6.3% | 6.8% | 25.7% | 52.2% | 20.2% |
Source: Yahoo Finance
TDG’s 46.0% operating margin, 21.3% net margin, 59.8% gross margin, and 50.9% EBITDA margin all exceed HEI’s 25.1%, 16.4%, 40.4%, and 28.5%, as well as LHX’s 12.6%, 8.2%, 25.5%, and 18.1%. HONA and RNMBY are also below TDG on operating and EBITDA margins, even where RNMBY posts a higher ROE. That margin lead is the cleanest reason TDG deserves a premium, because it shows the business is structurally more profitable rather than just temporarily better.
Leverage
| Company | Total Debt/Equity % (mrq) | Current Ratio (mrq) | Total Debt (mrq, USD Mil) | Operating Cash Flow TTM (USD Mil) | Free Cash Flow TTM (USD Mil) | Net Debt/EBITDA (TTM) | FCF Margin % (TTM) |
|---|---|---|---|---|---|---|---|
| TDG | — | 3 | 33,485 | 2,198 | 1,457.4 | 6 | 14.6% |
| HEI | 45 | 2.7 | 2,541.2 | 1,111.2 | 845.4 | 1.6 | 16.3% |
| HONA | — | 1.5 | 16,149 | 3,026 | — | 4.3 | — |
| LHX | 52.8 | 1.2 | 10,999 | 3,292 | 1,609 | 2.3 | 7.0% |
| RNMBY | 51.6 | 1 | 2,978 | 1,313 | 642.8 | 1.2 | 5.6% |
Source: Yahoo Finance
TDG’s net debt/EBITDA is 6.0x, well above HEI at 1.6x, LHX at 2.3x, RNMBY at 1.2x, and HONA at 4.3x. TDG’s FCF margin of 14.6% is still solid, but the leverage gap explains why the stock does not deserve an even higher multiple than it already has. In other words, the market is paying for the margin profile, while the debt load keeps that premium from expanding further.
Conclusion
The tension in this name is straightforward: the operating model is excellent, but the balance sheet is still heavy enough to limit how much of that quality the equity can fully monetize. I would put my rating as a Hold because the numbers already show a durable moat and strong cash generation, yet they also show 6.0x net debt to EBITDA and a valuation that is not cheap enough to ignore that risk.
I would raise my rating more towards a Buy if net debt to EBITDA falls below 5.5x, meaning leverage is clearly moving down rather than just being rolled forward, and if EBITDA margin stays around 50.9% or better while revenue keeps growing in the low double digits. That combination would tell me the company is converting its installed-base advantage into faster deleveraging, which is the cleanest path to a rerating.
I would move from Hold to Sell if free cash flow margin slips below 12.0%, meaning the business is no longer generating enough excess cash to offset the debt load, or if net debt to EBITDA stays above 6.0x while growth slows materially. In that case, the leverage burden would start to dominate the thesis rather than simply cap upside.
For now, I think the operating case is more likely to hold than the balance-sheet case is to improve quickly. That is why I stay at Hold: the moat is real, but I want to see leverage come down before I pay for a higher conviction call.
What to Watch Next
- Net debt/EBITDA below 5.5x — would support moving the rating toward Buy.
- FCF margin below 12.0% — would raise concern that debt service is crowding out equity value.
- EBITDA margin staying near 50% — would confirm the installed-base moat is still converting into cash.
- Revenue growth in the low double digits — would show the core aftermarket engine is still compounding.
- Another large debt-funded dividend — would reinforce the leverage-first capital allocation pattern.
What’s your take? I rated TransDigm Group (TDG) HOLD above — but the goal here is to get this right, not just to publish an opinion. What would you add to this analysis, or which risk or catalyst do you think I’m under- or over-weighting? Tell me in the comments.
Sources
- SEC 10-K Annual Report — filed 2024-11-07
- SEC 8-K Filing (2024-11-07)
- SEC 8-K Filing (2024-09-20)
- SEC 8-K Filing (2024-09-05)
- SEC 8-K Filing (2024-09-03)
- SEC 8-K Filing (2024-08-06)
- SEC 8-K Filing (2024-07-31)
- SEC Form 4 Insider Transaction (2026-05-19)
- SEC Form 4 Insider Transaction (2026-05-18)
- SEC Form 4 Insider Transaction (2026-04-21)
- SEC 10-K Annual Report — FY2024
- SEC 10-K Annual Report — FY2023
- SEC 10-K Annual Report — FY2022
- SEC 10-K Annual Report — FY2021
- SEC 10-K Annual Report — FY2020
Data sourced from Yahoo Finance and SEC EDGAR. Not investment advice.
Leave a Comment