Expected price range
Each range is set from the stock’s recent price history and our Hold rating, using its own 1-year realised volatility (30% annualised) as the width of a ~68% statistical band, and checked against that rating so the range leans the same way as our view. Starting price $225 (close 2026-11-16). The stock traded between $180 and $232 over the last 6 months and between $180 and $287 over the last year. This is an illustration of where our view and normal volatility point, not a forecast, price target or investment advice; the stock can move outside it.
| Company | Nov 25 | Dec 25 | Jan 26 | Feb 26 | Mar 26 | Apr 26 | May 26 | Jun 26 | Jul 26 | Aug 26 | Sep 26 | Oct 26 | 12-Mo |
|---|---|---|---|---|---|---|---|---|---|---|---|---|---|
| LOW | +2% | -1% | +11% | -1% | -11% | +2% | -10% | +3% | -5% | -1% | -10% | +14% | -10% |
| HD | -6% | -3% | +9% | +2% | -13% | -0% | -4% | +12% | -6% | -1% | -13% | +16% | -11% |
| WSM | -7% | -1% | +15% | +0% | -11% | -0% | +12% | +15% | -2% | -0% | -0% | +11% | +32% |
| TSCO | +2% | -9% | +2% | +2% | -13% | -23% | -9% | +0% | -3% | +14% | -10% | +8% | -36% |
| FND | +2% | -4% | +8% | +5% | -26% | -5% | +6% | +15% | -3% | -13% | -9% | +4% | -24% |
| RH | -9% | +14% | +11% | -17% | -16% | -6% | +13% | +11% | +0% | -10% | -18% | +20% | -15% |
Source: Yahoo Finance monthly adjusted close.
Quick Thesis
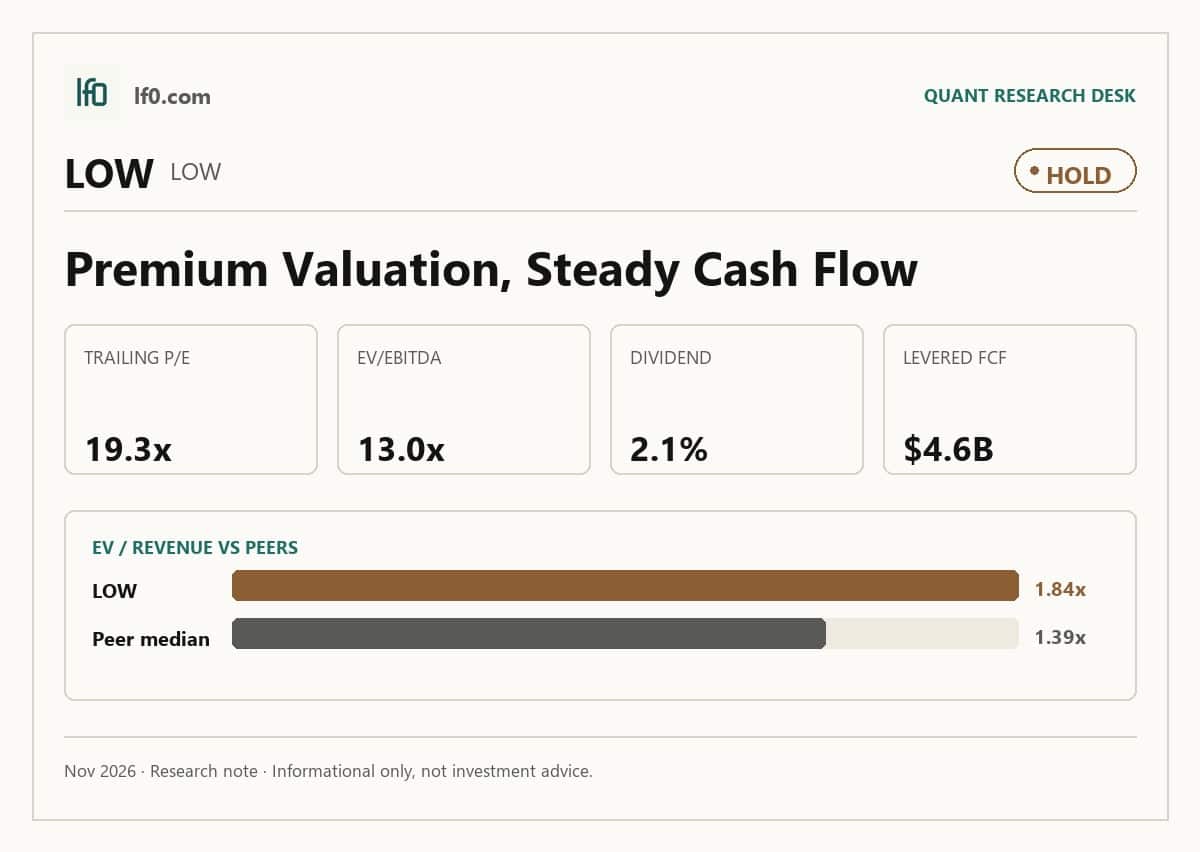
- Rated Hold — scale and cash flow are solid, but the multiple already reflects them.
- TTM operating margin is 11.4%, with $4.6B of levered free cash flow.
- Total debt is $42B, so execution has to outrun leverage.
- Lowe’s trades at 19.3x trailing P/E and 13.0x EV/EBITDA, which looks fair to slightly rich.
- I would raise my rating if comparable sales stay positive and operating margin holds above 11.0%.
Executive Summary
We’ll begin tracking this call’s performance since publication once sufficient adjusted-close data is available.
I would put my rating as a Hold because Lowe’s has a durable scale advantage and solid cash generation, but the stock already reflects that quality at 19.3x trailing P/E and 17.3x forward P/E. The business is still producing $9.3B of operating cash flow and $4.6B of levered free cash flow, which supports the dividend and buybacks, yet $42B of total debt means investors are paying for execution rather than balance-sheet optionality. I would raise my rating toward a Buy if Lowe’s can keep revenue growth in the high single digits while holding operating margin above 11.0%, because that would show the FBM and ADG acquisitions are adding earnings rather than just adding complexity.
Company Profile
Lowe’s Companies, Inc. sells home improvement merchandise and services through stores, online channels, and installation offerings. Revenue comes from DIY and Pro customer purchases of building materials, appliances, tools, paint, and seasonal goods, plus installation services arranged through independent installers or third parties. Founded in 1921 in North Wilkesboro, North Carolina, it was incorporated in 1952 and has been publicly held since 1961. As of January 30, 2026, Lowe’s operated 1,759 U.S. home improvement stores and outlets across about 196 million square feet, plus more than 540 branch locations in the United States and Canada after the 2025 acquisitions of Foundation Building Materials and Artisan Design Group. The company is listed on the New York Stock Exchange under LOW and is financed with a large cash-generating retail base and meaningful debt.
Economic Moat
Business Model
The largest hard-to-copy advantage is Lowe’s store and branch footprint. I feel that this physical network is difficult for a well-funded competitor to replicate within 3 years because it already covers about 196 million square feet of retail selling space, and the branch layer now extends Lowe’s reach into larger Pro customers in the residential and commercial markets. A secondary moat element is the Total Home strategy, which is built around Drive Pro penetration, Accelerate online sales, Expand home services, Create a loyalty ecosystem, and Increase pace productivity; in practical terms, that means the company is using its footprint to bundle products, installation, and job-site delivery rather than competing on shelves alone.
Business & Operating Risks
The most material disclosed risk is execution on Lowe’s omnichannel and technology transformation, because the 10-K ties it directly to customer experience, market share, and the value of large, complex programs requiring integrated planning, initiative prioritization, and program sequencing. The same filing also flags supply chain and third-party disruption, especially around tariffs, vendor concentration, and fulfillment execution, and it warns that a vendor failure, port congestion, shipping delays, or a breakdown in its market delivery model could cause lost sales and merchandise out-of-stocks. Those risks do not break the moat, but they do threaten the very operating discipline that makes the footprint valuable; if the network cannot convert scale into reliable fulfillment and better Pro service, the advantage becomes harder to monetize.
Management Discussion & Analysis
Management is trying to answer those risks with a more Pro-heavy mix, tighter execution, and continued investment in systems and supply chain. The FBM and ADG acquisitions added $321M of pre-tax expenses in fiscal 2025 from transaction costs and intangible amortization and reduced diluted EPS by $0.43, so the near-term earnings drag is real even if the strategic logic is sound. Comparable sales rose only 0.2% in fiscal 2025 while customer transactions fell 2.8%, which tells me the Pro expansion is still offsetting a weak demand backdrop rather than yet producing broad traffic growth. The company is responding to the risks, but the latest numbers show that the response is still in the investment phase rather than the payoff phase.
Recent Events
The most significant development I see is the May 29, 2026 annual meeting, where shareholders rejected the independent board chairman proposal by 338.3M votes against 83.8M and also voted down the packaging and customer-data reporting proposals by wide margins. In my view, that outcome preserves the current governance structure and avoids a forced change in oversight, which is neutral to slightly supportive for execution because it leaves management with continuity rather than a board reset. The May 20, 2026 first-quarter earnings release was routine and did not add a new strategic catalyst.
Financial Analysis
LF0 has published standalone analyses of these peers: Williams-Sonoma (WSM) (rated Hold).
Growth
LOW — Financial Growth (Quarterly, USD Mil)
| Metric | 2025-07-31 | 2025-10-31 | 2026-01-31 | 2026-04-30 | 2026-07-31 |
|---|---|---|---|---|---|
| REVENUE (USD Mil) | 23,959 | 20,813 | 20,585 | 23,078 | 25,956 |
| EBIT (USD Mil) | 3,511 | 2,522 | 1,721 | 2,563 | 3,567 |
| EBITDA (USD Mil) | 4,026 | 3,057 | 2,358 | 3,207 | 4,215 |
| NET INCOME (USD Mil) | 2,398 | 1,616 | 1,000 | 1,628 | 2,399 |
| DILUTED EPS | 4.3 | 2.9 | 1.8 | 2.9 | 4.3 |
Source: Yahoo Finance — Quarterly Financial Statements
Revenue accelerated across the last two quarters after a soft winter stretch. Lowe’s revenue was $20.6B in Q1 2026, up 0.5% from $20.5B a year earlier, then rose to $23.1B in Q2 2026, up 11.4% from $20.7B, and reached $26B in Q3 2026, up 8.4% from $23.9B. EBITDA grew faster than revenue in Q2 2026 and remained ahead of sales growth in Q3 2026, while net income also outpaced sales in both periods. That pattern looks seasonal and housing-linked rather than like a one-off spike, and it is consistent with the company’s scale advantage described above.
Growth versus peers
| Company | Revenue TTM (USD Mil) | Revenue Growth YoY % | Diluted EPS TTM |
|---|---|---|---|
| LOW | 90,432 | 8.3% | 11.8 |
| HD | 169,176 | 5.7% | 14.3 |
| WSM | 8,005.2 | 6.7% | 9.8 |
| TSCO | 15,942.1 | 5.1% | 1.9 |
| FND | 4,746.8 | 3.0% | 2.2 |
| RH | 3,448.9 | 2.6% | 5.7 |
Source: Yahoo Finance
Lowe’s 8.3% revenue growth is modestly ahead of HD at 5.7%, WSM at 6.7%, TSCO at 5.1%, FND at 3.0%, and RH at 2.6%. That is a small premium for a much larger base, which looks justified rather than stretched because LOW is still compounding faster than the two closest home-improvement peers while carrying the strongest scale in the set.
Profitability
TTM operating margin of 11.4%, TTM net margin of 7.4%, and TTM return on assets of 12.5% show Lowe’s is already profitable on a GAAP basis, with net income converting from sales at a healthy rate rather than relying on accounting adjustments. The gap between operating margin and net margin is only 4.0 percentage points, which suggests below-the-line items are not overwhelming the business model. Return on equity is not present in the data, so the capital efficiency read should lean on ROA instead of leverage-amplified returns. The key watchpoint is whether operating margin can hold above 11.0% while net margin stays near 7.0%, because that would confirm the company is sustaining profitability even as it absorbs acquisition-related costs and normal retail cyclicality.
Profitability versus peers
| Company | Operating Margin (TTM) | Net Margin (TTM) | Return on Assets (TTM) | Return on Equity (TTM) | Gross Margin (TTM) | EBITDA Margin (TTM) |
|---|---|---|---|---|---|---|
| LOW | 11.4% | 7.3% | 12.5% | — | — | — |
| HD | 12.0% | 8.4% | 12.1% | 104.3% | — | — |
| WSM | 17.8% | 14.7% | 16.6% | 55.0% | — | — |
| TSCO | 8.7% | 6.1% | 7.5% | 37.3% | — | — |
| FND | 5.3% | 5.1% | 2.8% | 9.9% | — | — |
| RH | 7.9% | 3.2% | 3.5% | 280.7% | — | — |
Source: Yahoo Finance
LOW’s 11.4% operating margin and 7.4% net margin trail WSM’s 17.8% and 14.7%, but beat FND’s 5.3% and 5.1% and are above TSCO’s 8.7% and 6.1% and RH’s 7.9% and 3.2%. HD is close at 12.0% operating margin and 8.4% net margin, so LOW’s gap is not a cost-of-revenue problem so much as a scale and mix issue versus the best operators. That supports a premium to the weaker peers, but not to WSM.
Valuation
Lowe’s trades at 19.3x trailing P/E and 17.3x forward P/E, with a 1.4x price-to-sales ratio, 1.8x EV/revenue, and 13.0x EV/EBITDA. At a current share price of $224.9, the market is paying for a steady earnings base rather than a cyclical rebound, because the 12.9 forward EPS implies only a modest lift from the current earnings base. The 2.1% trailing dividend yield and 41.0% payout ratio add income support, but they do not make the stock cheap; they mainly show Lowe’s can return cash while keeping leverage manageable. Book value per share is $5.7, so the stock trades at a large premium to accounting equity, which is normal for a retailer with strong cash generation but still means the valuation rests on future cash flow, not asset backing. Beta of 0.81 and 2.2% short interest point to a relatively low-volatility, widely owned name, so the multiple looks fair to slightly rich rather than distressed. On the analysis here, I would put fair value in a range of about $210-$245, which sits a bit below the $251 analyst mean and inside the broader $190-$$290 consensus band; that tells me the market is not wildly out of line, but it is already discounting a decent amount of execution. I would also frame the earnings power as roughly $12.5-$13.5 of EPS if margins hold near current levels, which is close to the company’s own 12.9 forward EPS and broadly in line with peers on a like-for-like basis, so the stock is not obviously cheap on earnings power alone. The valuation case is therefore tied to whether the Pro mix and branch expansion can lift cash flow faster than debt service and integration costs.
Valuation versus peers
| Company | Current Share Price (USD) | Trailing P/E | Forward P/E | EV/Revenue | EV/EBITDA | Price/Sales (TTM) | Price/Book (mrq) | Market Cap (USD Mil) | Enterprise Value (USD Mil) | Beta (5Y Monthly) | FCF Yield % (TTM) | Forward EPS | Analyst Target Price – Low | Analyst Target Price – Mean | Analyst Target Price – High | # Analyst Opinions |
|---|---|---|---|---|---|---|---|---|---|---|---|---|---|---|---|---|
| LOW | 224.9 | 19.3 | 17.3 | 1.8 | 13 | 1.4 | — | 127,769 | 166,620 | 0.81 | — | 12.9 | 190 | 250.7 | 290 | 33 |
| HD | 347.5 | 24.4 | 22 | 2.4 | 16 | 2.1 | 20.9 | 347,884 | 408,366 | 0.95 | — | 15.9 | 310 | 377.6 | 425 | 32 |
| WSM | 252.1 | 26.1 | 24.4 | 3.8 | 17.2 | 3.8 | 14 | 29,922 | 30,421 | 1.49 | — | 10.6 | 151 | 257.7 | 300 | 20 |
| TSCO | 38 | 19.6 | 17.8 | 1.6 | 13.9 | 1.2 | 7.1 | 18,902 | 25,423 | 0.48 | — | 2.1 | 31 | 37.5 | 43 | 27 |
| FND | 47.8 | 21.5 | — | 1.4 | 11.6 | 1.1 | 2 | 4,977 | 6,579 | 1.56 | — | 1.9 | 34 | 50 | 65 | 22 |
| RH | 126.2 | 22.9 | 14.6 | 1.9 | 12.7 | 0.7 | 20.4 | 2,450 | 6,433 | 1.91 | — | 8.5 | 81 | 163.8 | 258 | 17 |
Source: Yahoo Finance
LOW trades at 1.8x EV/revenue, 19.3x trailing P/E, 17.3x forward P/E, and 1.4x price/sales, versus HD at 2.4x, 24.4x, 22.0x, and 2.1x; WSM at 3.8x, 26.1x, 24.4x, and 3.8x; TSCO at 1.6x, 19.6x, 17.8x, and 1.2x; FND at 1.4x and 21.5x; and RH at 1.9x, 22.9x, 14.6x, and 0.7x. LOW’s 2.1% trailing dividend yield and 41.0% payout ratio add a cash-return cushion that TSCO, FND, and RH do not match, while its 12.9 forward EPS sits below HD’s 15.9 but above WSM’s 10.6, so the market is paying for steadier earnings rather than the highest earnings level. On a peer-multiple basis, LOW looks fairly valued to slightly expensive, not obviously cheap, and the premium is easier to justify because its leverage is cleaner than the most indebted peers.
Leverage
Total debt was $42B, while the current ratio was 1.1x, which tells me Lowe’s has enough near-term liquidity to keep operating without strain. Operating cash flow was $9.3B and levered free cash flow was $4.6B, so the business is still converting earnings into cash after capex and interest. The cash balance was $3.2B, which gives additional cushion if housing demand stays soft. I would treat the leverage profile as manageable refinancing risk rather than a balance-sheet problem: the debt load is large, but the cash generation is strong enough to service it unless operating cash flow weakens materially or a large refinancing lands in a much higher rate environment.
Leverage versus peers
| Company | Total Debt/Equity % (mrq) | Current Ratio (mrq) | Total Debt (mrq, USD Mil) | Free Cash Flow TTM (USD Mil) | Net Debt/EBITDA (TTM) | FCF Margin % (TTM) |
|---|---|---|---|---|---|---|
| LOW | — | 1.1 | 42,031 | 4,615.4 | — | — |
| HD | 380.3 | 1.1 | 63,188 | 10,762.6 | — | — |
| WSM | 71.4 | 1.4 | 1,528 | 1,069.3 | — | — |
| TSCO | 252.6 | 1.4 | 6,720.1 | 126.8 | — | — |
| FND | 80.2 | 1.3 | 1,994.1 | 248.3 | — | — |
| RH | 3,413.9 | 1.1 | 4,108.6 | 263.9 | — | — |
Source: Yahoo Finance
LOW’s current ratio is 1.1x, total debt is $42B, operating cash flow is $9.3B, and free cash flow is $4.6B, which is stronger cash generation than TSCO’s $126.8M FCF and FND’s $248.3M, but less cash-rich than HD’s $10.8B and WSM’s $1.1B on a smaller base. TSCO’s 252.6% debt/equity and HD’s 380.3% show that LOW’s balance sheet is materially cleaner than the most levered peers, while its cash conversion is good enough to keep buybacks and dividends funded without strain.
Insider Activity
The insider transaction record I see here is one-sided: 5 open-market sales and 0 open-market purchases. The activity is concentrated, with Marvin R. Ellison accounting for three sales and Vance Quonta D. adding one larger sale, so this is not broad-based buying support from management. In my view, that is a bear signal because the pattern is net open-market selling with no offsetting insider purchases.
Conclusion
I would put my rating as a Hold because Lowe’s is executing well enough to justify its premium, but not well enough to make 19.3x trailing P/E look cheap. Revenue grew 8.3% year over year in the latest quarter, and operating cash flow was $9.3B TTM, which tells me the business still throws off enough cash to fund dividends, buybacks, and the Pro buildout. The main risk is leverage and execution around the FBM and ADG acquisitions, with total debt at $42B and levered free cash flow at $4.6B TTM, so the balance sheet is fine but not flexible enough to absorb a prolonged demand miss.
The bull case is straightforward: if comparable sales stay positive for two more quarters and operating margin holds above 11.0%, I would move more toward a Buy because that would show the acquisition costs are translating into earnings power rather than just complexity. On the current $25.9B quarterly revenue base, a 1.0 percentage point margin lift would be roughly $259M of incremental quarterly operating profit, which would materially improve the deleveraging and buyback runway. The bear case is just as clear: if comparable sales slip back below 0% for two straight quarters and operating margin falls under 11.0%, I would move from Hold toward Sell because that would tell me the acquisition benefits are not offsetting weaker demand. A second trigger would be a sustained rise in leverage pressure, especially if operating cash flow weakens enough that the current ratio of 1.1x no longer looks comfortable while debt stays near $42B.
Weighing both paths, I still lean to Hold rather than Buy because the proof point I want from the Pro expansion is not yet visible in the latest numbers. The bear case is not dominant either, since cash flow and liquidity remain strong, so the stock sits in the middle: good business, fair price, and not enough evidence yet to justify paying up for a faster rerating.
What to Watch Next
- Comparable sales above 0% for two more quarters — would support a move toward Buy.
- Operating margin at or above 11.0% — would show acquisition costs are being absorbed.
- Quarterly revenue around $25.9B with improving margin — would strengthen the earnings-power case.
- Current ratio staying near 1.1x while debt remains around $42B — would keep refinancing risk manageable.
- Levered free cash flow holding near $4.6B — would support dividends and buybacks.
What’s your take? I rated Lowe’s (LOW) HOLD above — but the goal here is to get this right, not just to publish an opinion. What would you add to this analysis, or which risk or catalyst do you think I’m under- or over-weighting? Tell me in the comments.
Our track record: every directional call is tracked publicly on The Scorecard, and Stocks Covered lists every company we have rated and when.
Sources
- SEC 10-K Annual Report — filed 2026-03-23
- SEC 8-K Filing (2026-06-02)
- SEC 8-K Filing (2026-05-20)
- SEC 8-K Filing (2026-02-25)
- SEC Form 4 Insider Transaction (2026-06-01)
- SEC Form 4 Insider Transaction (2026-06-01)
- SEC Form 4 Insider Transaction (2026-06-01)
- SEC 10-K Annual Report — FY2026
- SEC 10-K Annual Report — FY2025
- SEC 10-K Annual Report — FY2024
- SEC 10-K Annual Report — FY2023
- SEC 10-K Annual Report — FY2022
Data sourced from Yahoo Finance and SEC EDGAR. Not investment advice.
Leave a Comment