
| Company | Jul 25 | Aug 25 | Sep 25 | Oct 25 | Nov 25 | Dec 25 | Jan 26 | Feb 26 | Mar 26 | Apr 26 | May 26 | Jun 26 | 12-Mo |
|---|---|---|---|---|---|---|---|---|---|---|---|---|---|
| GSAT | -0% | +27% | +22% | +50% | +12% | +0% | +1% | +1% | +7% | +24% | +2% | -3% | +245% |
| IRDM | -19% | +2% | -29% | +10% | -14% | +7% | +15% | +20% | +17% | +41% | +33% | +6% | +87% |
| ASTS | +14% | -8% | +0% | +64% | -30% | +29% | +53% | -29% | +5% | -11% | +53% | -22% | +90% |
| ECHO | +18% | +90% | +24% | -2% | -2% | +48% | +4% | +2% | +1% | +5% | +5% | -21% | +266% |
| TSAT | -2% | -13% | +28% | +14% | -14% | +12% | -0% | +8% | +15% | +36% | +10% | -7% | +107% |
| T | -4% | +7% | -4% | -11% | +5% | -5% | +7% | +7% | +3% | -9% | -5% | -17% | -25% |
Source: Yahoo Finance monthly adjusted close.
Executive Summary
Rating: SELL | GSAT
<!– lf0-performance:start –> <div class="lf0-performance-card" data-ticker="GSAT" data-rating="Sell"> <style data-no-optimize="1">.lf0-performance-card{border:1px solid #d9dde3;border-radius:6px;padding:14px 16px;margin:16px 0 22px;background:#fbfcfd}.lf0-performance-card__head{display:flex;justify-content:space-between;gap:12px;align-items:flex-start;margin-bottom:10px}.lf0-performance-card__title{font-weight:700;color:#22263f}.lf0-performance-card__badge{font-size:.78rem;font-weight:700;border-radius:999px;padding:4px 9px;background:#eef1f4;color:#22263f;white-space:nowrap}.lf0-performance-card__badge.rating-buy,.lf0-performance-card__badge.rating-strong-buy{background:#e7f5ee;color:#166534}.lf0-performance-card__badge.rating-sell,.lf0-performance-card__badge.rating-strong-sell{background:#fdecec;color:#9f1239}.lf0-performance-card__note{margin:0;font-size:.82rem;color:#6b7280}</style> <div class="lf0-performance-card__head"><div class="lf0-performance-card__title">Research call performance</div><div class="lf0-performance-card__badge rating-sell">Daily tracker pending</div></div> <p class="lf0-performance-card__note">Daily adjusted-close performance will appear here after the next LF0 performance refresh.</p> </div> <!– lf0-performance:end –>
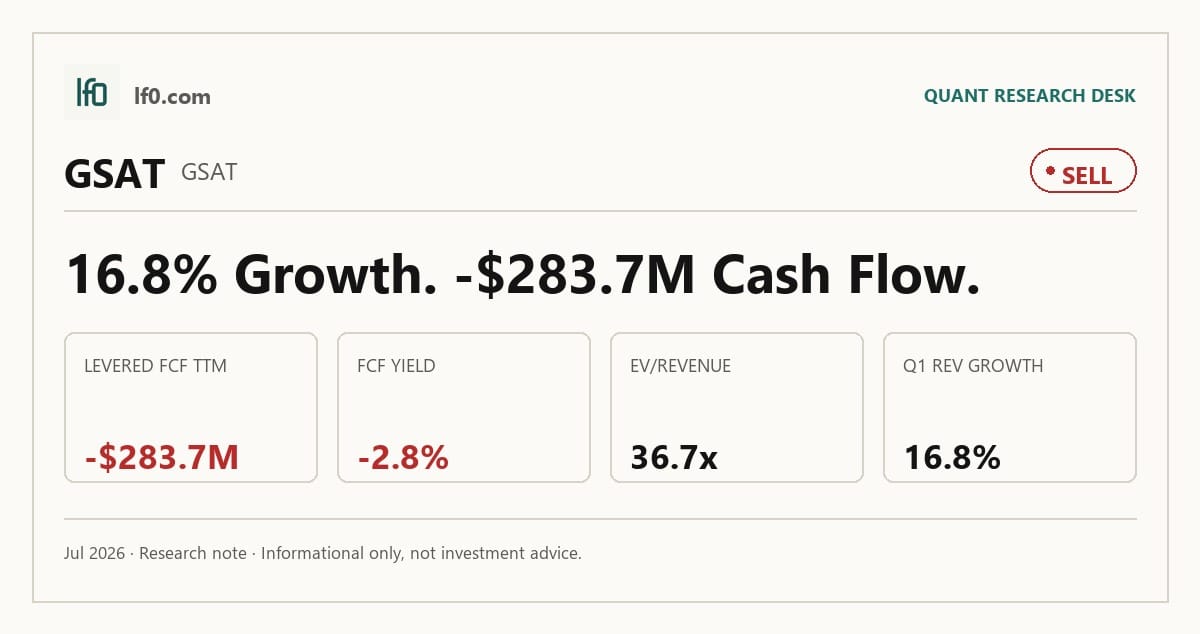
I would put my rating as a Sell because Globalstar is priced for a cash conversion step-up that has not yet shown up in the numbers, with EV/Revenue at 36.7x, EV/EBITDA at 95.1x, and FCF yield at -2.8% while levered free cash flow remains $283.7M TTM. The operating line is improving, but the latest twelve months still show a 16.3% operating margin and a -3.1% net margin, so the market is paying for earnings power that has not yet reached the bottom line. In my view, the key tension is that the network build is creating real revenue, yet the cash profile is still being consumed by capex and financing costs. I would raise my rating more towards a Hold if levered free cash flow turns positive and stays there for two consecutive quarters, because that would show the $605M of operating cash flow is finally surviving the investment cycle.
Company Profile
Globalstar, Inc. provides mobile satellite services, including voice, data, and Internet of Things connectivity, over its Globalstar System of low Earth orbit satellites and ground stations. Revenue comes mainly from wholesale satellite capacity services, especially the Updated Services Agreements with Apple, which generated 63.0% of 2025 revenue, while the rest comes from Commercial IoT, SPOT consumer devices, Duplex voice and data, government services, and terrestrial spectrum solutions. The company had 477 employees across 15 countries and 791,000 MSS subscribers worldwide as of December 31, 2025, and it is listed on Nasdaq under GSAT.
Economic Moat
Business Model
Globalstar’s most defensible asset is the Extended MSS Network, which ties wholesale satellite capacity to a new satellite constellation, expanded ground infrastructure, and broader global licensing. In my view, that network is hard to replicate quickly because the customer agreements, spectrum rights, and ground system have to be built together, not pieced together later. The company also retains 15% of current and future network capacity for its own subscribers, which gives it room to grow Commercial IoT, SPOT, and Duplex without rebuilding the core network from scratch. A secondary moat element is the terrestrial spectrum position: Globalstar had licenses in 12 countries and about 120 billion MHz POPs as of December 31, 2025, and the January 2026 acquisition of XCOM intellectual property assets adds private-network optionality if commercialization works.
The business has shifted materially over the last five years. In 2022, it was still centered on a satellite service base recovering from COVID-19 disruptions, but by 2024 the Apple wholesale relationship had become the anchor and the Updated Services Agreements had been signed to support the Extended MSS Network. The 2022 satellite procurement agreement with MDA Space, the August 2024 FCC order allowing up to 26 replacement satellites under a renewed 15-year license term, the February 2025 agreement for more than 50 third-generation C3 System satellites, and the October 2025 launch of the RM200M two-way module all point in the same direction: the company is moving from legacy MSS toward a broader network and device platform. I think that makes the moat stronger than it was five years ago, even though it still depends heavily on one customer and one network architecture.
Business & Operating Risks
The Updated Services Agreements are the central risk because they generated about 63.0% of 2025 revenue and can be terminated by the customer on notice, for force majeure, or for certain events of default. If Globalstar misses the obligations tied to those fees, or if the customer’s products using the service do not succeed, the revenue stream can disappear quickly; the filing also makes clear that the customer can let its devices use another network provider’s satellite services, so substitution risk is real even without a formal break.
Gateway and operations-center outages are the next major issue because the network depends on three control centers in France, Texas, and Louisiana, and the gateways are exposed to natural disasters, extreme weather events, or terrorist attack. A shutdown would impair service delivery to government, consumer, and business users, and the financial data already shows the risk is not hypothetical: Q1 2025 included a $7M loss on disposal of assets tied to a second-generation satellite power control anomaly. The same logic applies to orbital-life and in-orbit failure risk, since satellites may need capacity reduced before the end of their 15-year design life, and another Q1 2025 anomaly rendered a satellite inoperable.
Launch timing and capacity risk is also material because the first set of replacement satellites under the 2022 MDA Space agreement was delayed and management now expects launch in the first half of 2026, if at all. That matters because the Updated Services Agreements depend on timely replacement capacity, so launch slippage can become revenue slippage rather than a simple schedule issue. Cybersecurity, supplier dependence, and financing constraints round out the picture, with the network exposed to cyber-attacks, a limited supplier base, and tariff-driven shortages that can delay satellites, gateways, and devices.
Taken together, these risks do threaten the moat, but they do not erase it. They mainly pressure the managed network advantage by testing whether Globalstar can keep the constellation and ground system reliable enough to preserve the wholesale contract base.
Management Discussion & Analysis
Management is actively responding to the risks above by pushing capital into the replacement constellation and the ground network rather than defending the legacy base. The $775M satellite procurement agreement for more than 50 third-generation satellites and the amended MDA Space contract for 17 replacement satellites remain the core priorities, and management expects to fund future milestone payments with the Infrastructure Prepayment and the 2023 Funding Agreement. That is constructive for liquidity, but it also means the $537.8M of debt at December 31, 2025, accruing fees at a weighted average stated rate up to 9%, is not being retired aggressively.
The operating mix is shifting toward wholesale capacity services, which rose $27.4M, or 19%, in 2025, while Commercial IoT service revenue rose only $1.0M, or 4%, and SPOT and Duplex fell $3.8M and $4.9M, respectively. That tells me management is leaning on the Updated Services Agreements to carry growth, not on broad-based subscriber expansion. The new two-way reference design module and the expected launch of the first and second sets of satellites in the first and second halves of 2026 are the clearest forward catalysts, but the growth case is still contract-led rather than demand-led.
Management’s track record is mixed. In 2025, gross subscriber activations were up more than 50% year over year, which supports the Commercial IoT call, but SPOT average subscribers fell from 241,980 in 2024 to 222,534 in 2025 and Duplex fell from 27,033 to 20,684 over the same period. I read that as a team that is executing on infrastructure better than on legacy subscriber retention. The financing structure is also telling: it supports the buildout, but it does not yet show the kind of balance-sheet repair that would make the equity less dependent on future operating improvement.
Recent Events
The most important development is the April 13, 2026 merger agreement with Amazon.com, disclosed on April 14, 2026. Globalstar’s board, its Strategic Review Committee, and the special committee all approved the deal, and Thermo Funding II and affiliates, which own about 57.6% of the stock, already delivered written consent. That changes the investment case materially because it shifts the equity from a standalone operating story toward a transaction with a defined closing path.
The deal terms matter as well. Globalstar holders can elect 90.00 in cash per share, or stock consideration tied to Amazon’s share price, which gives investors a defined exit path if the transaction closes on schedule. In my view, that caps the standalone downside and makes execution risk more important than operating momentum from here.
The February 27, 2026 and May 7, 2026 8-Ks were routine earnings releases, and the May 13, 2026 annual meeting was largely housekeeping, with directors elected and Ernst & Young LLP ratified. Recent disclosures therefore strengthen the thesis, but they also narrow it: the market now has to weigh operating execution against deal completion, not just network buildout.
Financial Analysis
Growth
GSAT — Financial Growth (Quarterly, USD Mil)
| Metric | 2025-03-31 | 2025-06-30 | 2025-09-30 | 2025-12-31 | 2026-03-31 |
|---|---|---|---|---|---|
| REVENUE (USD Mil) | 60 | 67.1 | 73.8 | 72 | 70.1 |
| EBIT (USD Mil) | -1.5 | 6.1 | 10.3 | -0.3 | 8.2 |
| EBITDA (USD Mil) | 20.8 | 29.2 | 32 | 20.1 | 26.6 |
| NET INCOME (USD Mil) | -17.3 | 19.2 | 1.1 | -11.6 | -17.4 |
| DILUTED EPS | -0.2 | 0.1 | 0 | -0.1 | -0.2 |
Source: Yahoo Finance — Quarterly Financial Statements
Revenue rose from $60M in Q1 2025 to $70.1M in Q1 2026, up 16.8% year over year, after peaking at $73.8M in Q3 2025 and easing to $72M in Q4 2025. That sequence is better read as steady contract-driven growth than as a clean acceleration, which fits the wholesale-heavy model described above. EBITDA increased to $26.6M from $20.8M a year earlier, but net income slipped to a $17.4M loss, so the top line is improving faster than the bottom line.
Profitability
GSAT — Profitability (TTM)
| Metric | TTM |
|---|---|
| Operating Margin (TTM) | 16.3% |
| Net Margin (TTM) | -3.1% |
| Return on Assets (TTM) | 0.8% |
| Return on Equity (TTM) | -2.5% |
| Gross Margin (TTM) | 63.7% |
| EBITDA Margin (TTM) | 38.6% |
Source: Yahoo Finance — Trailing Twelve Months (TTM)
TTM gross margin was 63.7%, EBITDA margin was 38.6%, operating margin was 16.3%, and net margin was -3.1%. The spread from gross to EBITDA margin shows the business still carries a heavy operating cost base, while the gap from EBITDA to operating margin points to depreciation and amortisation absorbing a large share of earnings. That is consistent with a capital-intensive network model, but it also means the moat has to show up in cash conversion, not just in gross profit.
ROA was 0.8% TTM and ROE was -2.5% TTM. I read that as a business that is still not earning an attractive return on equity even though the operating line is positive. The key threshold for me is not a small improvement in gross margin; it is net margin turning positive and staying there, because that would show earnings are finally flowing through to shareholders.
Valuation
GSAT — Valuation Multiples
| Metric | Value |
|---|---|
| Market Cap (USD Mil) | 10,182 |
| Enterprise Value (USD Mil) | 10,378 |
| Forward P/E | 258.1 |
| Price/Sales (TTM) | 36 |
| Price/Book (mrq) | 29.7 |
| EV/Revenue | 36.7 |
| EV/EBITDA | 95.1 |
| Beta (5Y Monthly) | 1.54 |
| FCF Yield % (TTM) | -2.8% |
| Forward EPS (USD) | 0.3 |
| Analyst Target Price – Low (USD) | 90 |
| Analyst Target Price – Mean (USD) | 90 |
| Analyst Target Price – High (USD) | 90 |
| # Analyst Opinions | 3 |
Source: Yahoo Finance
GSAT screens expensive on every standard multiple, with EV/Revenue at 36.7x, EV/EBITDA at 95.1x, Price/Sales at 36.0x, and Forward P/E at 258.1x. FCF yield is -2.8%, so the market is paying for a much cleaner cash conversion profile than the latest numbers support. That premium is hard to justify against the leverage profile discussed below, because the company is still funding growth rather than harvesting cash.
On the analysis here, I would put fair value in a range of $14–$52 per share, using peer revenue multiples as a rough guide and then adjusting for GSAT’s weaker cash conversion. That range sits below the $90 analyst target mean from 3 opinions, which tells me the consensus is much more optimistic than I am about the speed of margin and cash-flow improvement. I would need to see free cash flow turn positive before I would lean toward that consensus.
The EPS path is also still thin. Forward EPS is 0.3, and while that is enough to make the forward multiple look mathematically high rather than impossible, it still implies a very steep earnings ramp from the current base. Relative to peers, GSAT’s earnings trajectory looks rich rather than cheap because the stock is priced for a much faster conversion of revenue into per-share earnings than IRDM, TSAT, or T are showing today.
Leverage
GSAT — Leverage & Coverage (Quarterly)
| Metric | Value |
|---|---|
| Total Debt/Equity % (mrq) | 156.9 |
| Current Ratio (mrq) | 1.6 |
| Total Debt (mrq, USD Mil) | 537.8 |
| Operating Cash Flow (TTM, USD Mil) | 605 |
| Levered Free Cash Flow (TTM, USD Mil) | -283.7 |
| Net Debt/EBITDA (TTM) | 1.6 |
| FCF Margin % (TTM) | -100.2% |
Source: Yahoo Finance — Quarterly Financial Statements
Total Debt/Equity was 156.9%, Current Ratio was 1.6, and Total Debt was $537.8M, so the balance sheet has debt but still carries some near-term liquidity cushion. Operating Cash Flow was $605M TTM, while Levered Free Cash Flow was $283.7M and FCF Margin was -100.2%, which tells me EBITDA is not converting into cash after capex and financing costs. Net Debt/EBITDA was 1.6x, so leverage is manageable today, but the negative free cash flow means financial flexibility depends on improving cash conversion rather than just holding the current debt load.
That is why I view the leverage profile as a constraint on valuation rather than a standalone distress risk. The company can fund the network build, but it is doing so in a way that keeps equity holders exposed to execution risk until free cash flow turns positive.
Insider Activity
The insider transaction record shows repeated open-market sales from Rebecca Clary, Paul Jacobs, and Ponder Barbee over the last several months. I do not read that as a panic signal, but it does tell me insiders are taking money off the table while the stock has rerated sharply. That matters more because insider ownership is still high at 59.9%, so the selling is happening from a base of meaningful alignment rather than from a detached shareholder base.
Comparable Analysis
Growth
| Company | Revenue TTM (USD Mil) | Revenue Growth YoY % | EBITDA TTM (USD Mil) | Diluted EPS TTM |
|---|---|---|---|---|
| GSAT | 283 | 16.7% | 109.2 | -0.1 |
| IRDM | 884.2 | 3.8% | 423.4 | 0.9 |
| ASTS | 84.9 | 1,952.2% | -316.4 | -1.8 |
| ECHO | 14,802.7 | -5.2% | 1,587.5 | -50.2 |
| TSAT | 388.3 | -25.4% | 172.6 | -8.9 |
| T | 127,239 | 2.3% | 44,939 | 3 |
Source: Yahoo Finance
GSAT’s revenue growth of 16.7% TTM is ahead of IRDM’s 3.8% and T’s 2.3%, while ASTS is still in a hyper-growth phase at 1,952.2% from a much smaller base. GSAT’s $26.6M of EBITDA is also well below T’s 44,939M and IRDM’s 423.4M, which tells me the growth story is real but still small in absolute scale. The market is paying for that growth, but not yet for proven operating leverage.
Valuation
| Company | Trailing P/E | Forward P/E | EV/Revenue | EV/EBITDA | Price/Sales (TTM) | Price/Book (mrq) | Market Cap (USD Mil) | Enterprise Value (USD Mil) | Beta (5Y Monthly) | FCF Yield % (TTM) | Forward EPS | Analyst Target Price – Low | Analyst Target Price – Mean | Analyst Target Price – High | # Analyst Opinions |
|---|---|---|---|---|---|---|---|---|---|---|---|---|---|---|---|
| GSAT | — | 258.1 | 36.7 | 95.1 | 36 | 29.7 | 10,182 | 10,378 | 1.54 | -2.8% | 0.3 | 90 | 90 | 90 | 3 |
| IRDM | 53 | 29.3 | 7.5 | 15.7 | 5.5 | 10.4 | 4,886 | 6,653 | 0.88 | 4.9% | 1.6 | 36 | 42 | 54 | 5 |
| ASTS | — | -218.3 | 214.6 | -57.6 | 259.6 | 8.2 | 22,049 | 18,223 | 2.68 | -6.4% | -0.3 | 41.2 | 83.3 | 108 | 10 |
| ECHO | — | -775.6 | 3.7 | 34.2 | 1.7 | 4.5 | 25,625 | 54,293 | 1 | -1.8% | -0.1 | 115 | 135.7 | 161 | 6 |
| TSAT | — | -5.3 | 12.7 | 28.5 | 5.1 | 1.6 | 1,968 | 4,923 | 2.01 | 12.3% | -7.3 | — | — | — | — |
| T | 7.9 | 9.3 | 2.5 | 7.2 | 1.3 | 1.5 | 163,293 | 323,512 | 0.42 | 6.2% | 2.6 | 18 | 29 | 36 | 23 |
Source: Yahoo Finance
GSAT screens at 36.7x EV/Revenue and 95.1x EV/EBITDA, versus IRDM at 7.5x and 15.7x, TSAT at 12.7x and 28.5x, and T at 2.5x and 7.2x. That is a very large premium, and it is not matched by the cash profile: GSAT’s FCF yield is -2.8%, while IRDM is 4.9%, TSAT is 12.3%, and T is 6.2%. In my view, the market is paying for a rerating that still needs to be earned through better cash conversion, and the premium looks even harder to defend when GSAT’s leverage is only moderate rather than exceptional.
The stock’s 1-year total return of 203.4% also matters here. A $1 investment a year ago would be worth $3.03 in GSAT, versus $1.51 in IRDM, $1.00 in ASTS, $3.09 in ECHO, $1.36 in TSAT, and $0.87 in T, so GSAT has already captured a large part of the revaluation that a cleaner operating profile would normally justify. That is why I think the valuation now reflects optimism more than evidence.
Profitability
| Company | Operating Margin (TTM) | Net Margin (TTM) | Return on Assets (TTM) | Return on Equity (TTM) | Gross Margin (TTM) | EBITDA Margin (TTM) |
|---|---|---|---|---|---|---|
| GSAT | 16.3% | -3.1% | 0.8% | -2.5% | 63.7% | 38.6% |
| IRDM | 15.1% | 10.5% | 5.1% | 19.7% | 71.9% | 47.9% |
| ASTS | -1,014.0% | 0.0% | -6.3% | -37.8% | 44.8% | -372.5% |
| ECHO | 8.9% | -97.6% | 0.4% | -112.3% | 27.1% | 10.7% |
| TSAT | 2.0% | -47.7% | 0.3% | -30.7% | 45.8% | 44.5% |
| T | 24.8% | 16.9% | 4.2% | 18.3% | 59.7% | 35.3% |
Source: Yahoo Finance
GSAT’s gross margin of 63.7% sits below IRDM’s 71.9% but above T’s 59.7%, while EBITDA margin of 38.6% is below IRDM’s 47.9% and above T’s 35.3%. The more important gap is below EBITDA: GSAT’s operating margin of 16.3% trails T’s 24.8% and is only slightly above IRDM’s 15.1%, which points to a heavier opex burden rather than a pure cost-of-revenue problem. ROE is -2.5%, far below IRDM’s 19.7% and T’s 18.3%, so the business is still not translating its asset base into attractive equity returns.
Leverage
| Company | Total Debt/Equity % (mrq) | Current Ratio (mrq) | Total Debt (mrq, USD Mil) | Operating Cash Flow TTM (USD Mil) | Free Cash Flow TTM (USD Mil) | Net Debt/EBITDA (TTM) | FCF Margin % (TTM) |
|---|---|---|---|---|---|---|---|
| GSAT | 156.9 | 1.6 | 537.8 | 605 | -283.7 | 1.6 | -100.2% |
| IRDM | 378.7 | 2.8 | 1,789.2 | 395.1 | 239.2 | 3.8 | 27.1% |
| ASTS | 112.4 | 18.5 | 2,991.4 | -91 | -1,412.8 | 0.1 | -1,663.3% |
| ECHO | 515.1 | 0.3 | 29,242 | -67.8 | -457.9 | 17.5 | -3.1% |
| TSAT | 222.4 | 0.3 | 3,701.1 | -68.6 | 243.1 | 18.4 | 62.6% |
| T | 129.1 | 1 | 165,756 | 39,899 | 10,142 | 3.3 | 8.0% |
Source: Yahoo Finance
GSAT’s debt/equity of 156.9% is above T’s 129.1% and below IRDM’s 378.7%, but its net debt/EBITDA of 1.6x is cleaner than IRDM’s 3.8x and T’s 3.3x because GSAT still has $358.4M of cash against $537.8M of debt. The catch is free cash flow: GSAT’s -100.2% FCF margin is far weaker than IRDM’s 27.1%, TSAT’s 62.6%, and T’s 8.0%, so the balance sheet is not yet a financing advantage in practice. In other words, the leverage profile looks acceptable only if cash conversion improves.
Conclusion
The key tension is simple: the network build and the Amazon transaction have given Globalstar a real strategic option, but the cash numbers still do not justify the valuation on their own. I would put my rating as a Sell because the stock has already rerated 203.4% over the past year, while free cash flow remains negative and the latest quarter still shows a net loss.
I would move from Sell to Hold if levered free cash flow turns positive and stays there for two consecutive quarters, because that would show the current operating cash flow is finally surviving capex and financing costs. I would also become more constructive if quarterly revenue holds above $70M and EBITDA stays above $25M, since that would suggest the current run rate is repeatable rather than a one-off contract quarter. On the downside, I would move from Sell to Strong Sell if quarterly revenue slips back below $60M, roughly the Q1 2025 level, because that would tell me the growth base is weakening before the cash burn is fixed.
For now, I think the bear case is more likely to show up first because the market is already discounting a much cleaner cash conversion profile than the filing supports. The stock can keep working if the next few quarters prove that operating cash flow is no longer being swallowed by investment spend, but until that happens I see more room for the multiple to compress than for the fundamentals to catch up.
What’s your take? I rated Globalstar (GSAT) SELL above — but the goal here is to get this right, not just to publish an opinion. What would you add to this analysis, or which risk or catalyst do you think I’m under- or over-weighting? Tell me in the comments.
Sources
- SEC 10-K Annual Report — filed 2026-02-27
- SEC 8-K Filing (2026-05-15)
- SEC 8-K Filing (2026-05-07)
- SEC 8-K Filing (2026-04-14)
- SEC 8-K Filing (2026-02-27)
- SEC Form 4 Insider Transaction (2026-06-04)
- SEC Form 4 Insider Transaction (2026-05-21)
- SEC Form 4 Insider Transaction (2026-05-21)
- SEC 10-K Annual Report — FY2026
- SEC 10-K Annual Report — FY2025
- SEC 10-K Annual Report — FY2024
- SEC 10-K Annual Report — FY2023
- SEC 10-K Annual Report — FY2022
Data sourced from Yahoo Finance and SEC EDGAR. Not investment advice.
Leave a Reply