Expected price range
Each range is set from the stock’s recent price history and our Strong Sell rating, using its own 1-year realised volatility (98% annualised) as the width of a ~68% statistical band, and checked against that rating so the range leans the same way as our view. Starting price $7.55 (close 2026-11-05). The stock traded between $7.55 and $22.91 over the last 6 months and between $7.55 and $22.91 over the last year. This is an illustration of where our view and normal volatility point, not a forecast, price target or investment advice; the stock can move outside it.
| Company | Nov 25 | Dec 25 | Jan 26 | Feb 26 | Mar 26 | Apr 26 | May 26 | Jun 26 | Jul 26 | Aug 26 | Sep 26 | Oct 26 | 12-Mo |
|---|---|---|---|---|---|---|---|---|---|---|---|---|---|
| AMPX | -20% | -30% | +58% | -14% | +57% | +25% | -4% | -32% | -31% | +3% | -2% | -11% | -39% |
| ENVX | -35% | -6% | -9% | -20% | -2% | +29% | +20% | -24% | -33% | -17% | -14% | +9% | -74% |
| MVST | -35% | -20% | -6% | -15% | -33% | +29% | -20% | -25% | -31% | -11% | -11% | -11% | -90% |
| EOSE | -6% | -24% | +28% | -61% | -13% | +35% | +26% | -30% | -43% | -5% | -5% | -38% | -88% |
| FLNC | -6% | +1% | +56% | -49% | -11% | -11% | +55% | +5% | -30% | -22% | -29% | -26% | -73% |
| BE | -17% | -20% | +74% | +3% | -13% | +109% | +1% | +6% | -32% | +0% | +34% | -27% | +54% |
Source: Yahoo Finance monthly adjusted close.
Quick Thesis
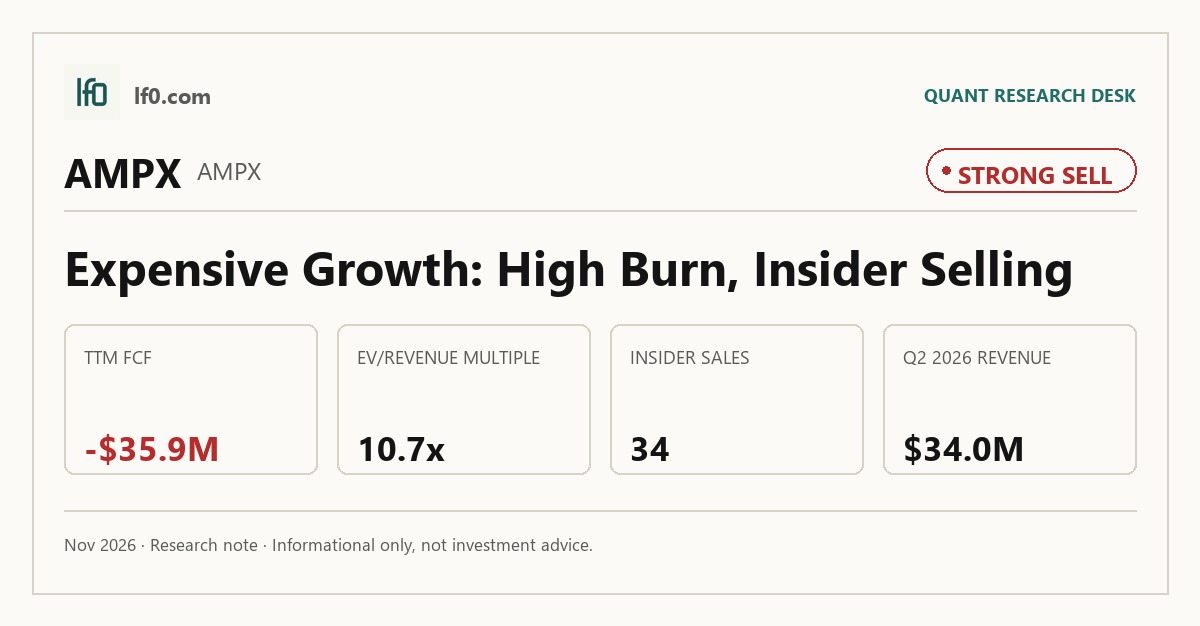
- Rated strong sell — revenue is growing, but cash burn and valuation still dominate.
- Revenue reached $34M in Q2 2026, up 58.9% year over year.
- Biggest risk: levered free cash flow was $-35.9M TTM.
- Valuation is rich at 10.7x EV/revenue and 9.9x price/sales.
- I would only turn more constructive if operating margin turns positive and FCF follows.
Executive Summary
Rating: STRONG SELL | AMPX
Measured from adjusted close on 2026-11-05 to 2026-11-05. Sell ratings are correct when the stock falls; Hold is tracked as a +/-10% range. Daily-close data, not intraday. Calls are tracked for 182 days from publication, then frozen as a final record.
I would put my rating as a strong sell because Amprius is still asking the market to pay for a future earnings inflection that has not shown up in the numbers yet. Revenue reached $34M in Q2 2026, but EBITDA was still $-3.5M and levered free cash flow was $-35.9M TTM, so the business is scaling without yet proving that it can self-fund that scale.
The most important strength is that the commercial ramp is real: revenue rose from $15.1M in Q2 2025 to $34M in Q2 2026, and that growth is consistent with the company’s silicon-anode platform gaining traction in aviation and unmanned aerial systems. The most important risk is that the same ramp is still not converting into cash generation, which leaves the equity dependent on continued financing and execution.
I would raise my rating toward a sell only if quarterly revenue stays above $30M and EBITDA moves to a positive operating margin, because that would show the fixed-cost base is finally being absorbed and the current 10.7x EV/revenue multiple is becoming easier to defend. Until then, I think the market is paying ahead of the evidence.
Company Profile
Amprius Technologies develops and sells lithium-ion batteries for mobility applications, with demand centered on aviation, unmanned aerial systems, high-altitude pseudo satellites, and other electric transportation uses. The company’s silicon-anode cells are sold through design services, sample shipments, and production orders, and it had shipped more than 4.2 million cells since inception through December 2025.
Founded around Stanford University research in 2008, Amprius began commercial battery production in 2018 and went public in September 2022 through a business combination with Kensington Capital Acquisition Corp. IV, a special purpose acquisition company. In January 2024 it launched SiCore commercially, and by 2025 it had expanded Fremont pilot-line capacity toward 10 MWh while also accessing more than 2.0 GWh of outsourced annual SiCore capacity through global contract manufacturers. It trades on Nasdaq under AMPX.
Economic Moat
Business Model
The core advantage is the silicon-anode chemistry itself. Amprius says its batteries can store up to 3,400 mAh/g, nearly 10 times the highest capacity of known graphite anodes, and I think that performance gap is hard to replicate quickly because the company combines the chemistry with 15 years of research and development, 86 patents as of December 31, 2025, and a manufacturing process designed to fit conventional lithium-ion lines rather than require a greenfield rebuild.
Commercial validation matters here because the moat is not just technical. Amprius cites over 500 customer engagements since inception, shipments to hundreds of customers in 2025, and validation by AALTO Airbus, AeroVironment, BAE Systems, Nokia Drone Networks, Nordic Wing, Teledyne FLIR, and the U.S. Army. The exclusive supply agreement with Berzelius also gives it exclusive rights to purchase proprietary silicon anode materials in the United States, Canada, and Mexico, while the Amprius Korea Battery Alliance supports annual production exceeding 2.0 GWh across pouch, cylindrical, and prismatic formats. In my view, that mix of protected materials, validated performance, and outsourced scale is the structural edge.
Business & Operating Risks
The most material disclosed risk is execution on third-party manufacturing and NDAA-compliant sourcing. According to the risk factors in Amprius’ SEC filing, the company may not secure commercially reasonable terms, may not find compliant suppliers that meet technical and cost targets, and could jeopardize its standing under the DIU program if those issues are not resolved. That is not a generic battery-industry risk; it strikes directly at the outsourced-scale model that is supposed to support the moat.
Battery performance and product liability are the second major risk. The filing says the silicon-anode structure has limited historical reliability data and that batteries could fail unexpectedly in the field, including in ways that create safety events. For a company still burning cash, that matters because a defect, recall, or warranty claim would hit revenue and liquidity at the same time. The third risk is capital dependence: Amprius may require additional capital, and that capital may not be available on commercially reasonable terms. I think the disclosed risks are threatening the moat’s commercialization path more than the chemistry itself; the technical edge looks intact, but the outsourced manufacturing model is the part under pressure.
Management Discussion & Analysis
Management is clearly trying to de-risk the manufacturing model rather than rebuild it around owned capacity. The company had access to more than 2.0 GWh of outsourced annual production at year-end 2025, and it is still expanding Fremont as a pilot line for quick-turn SiCore prototypes, which tells me the near-term focus is flexibility, not a capital-heavy factory buildout.
The clearest sign of that shift is the Brighton, Colorado facility. Amprius recorded a $19.1M impairment charge and then agreed on January 30, 2026 to terminate the lease for a one-time $20.0M payment, which is a costly retreat from the prior GWh-scale plan but also a cleaner capital allocation choice than carrying a stranded site. The company also completed a $100.0M Sales Agreement with aggregate net proceeds of $97.5M by December 4, 2025, so growth is still being financed externally. That means management is responding to the manufacturing risk identified above, but it is doing so with dilution and balance-sheet flexibility rather than with internally generated cash.
Recent Events
The January 30, 2026 lease termination for Amprius’ 774,155-square-foot Colorado facility is the most important recent event because it confirms the company is exiting a buildout that no longer fits the operating plan. Paying a $20M termination fee is painful, but it also removes a facility that was no longer aligned with the outsourced production strategy.
The May 6, 2026 warrant exchange covering 7.1 million public warrants is the second key event. In practical terms, Amprius is converting a future dilution overhang into common equity, which simplifies the capital structure even if it also shows the company is still using equity-linked tools to manage financing needs. The March and May 2026 earnings releases add continuity rather than a new strategic pivot, and the April 17, 2026 auditor change from BDO to Deloitte looks like a governance upgrade rather than a red flag. Taken together, the recent events support the idea that management is tightening the structure, but they do not change the fact that the business still needs operating improvement to justify the equity.
Financial Analysis
Growth
AMPX — Financial Growth (Quarterly, USD Mil)
| Metric | 2025-03-31 | 2025-06-30 | 2025-09-30 | 2025-12-31 | 2026-03-31 | 2026-06-30 |
|---|---|---|---|---|---|---|
| REVENUE (USD Mil) | — | 15.1 | 21.4 | 24.1 | 28.5 | 34 |
| EBITDA (USD Mil) | — | -5.8 | -3.5 | -0.6 | -5.9 | -3.5 |
| DILUTED EPS | -0.1 | -0.1 | 0 | — | 0 | 0 |
Source: Yahoo Finance — Quarterly Financial Statements
Revenue accelerated from $15.1M in Q2 2025 to $34M in Q2 2026, so the top line is still compounding at a pace that matters. The latest quarter was up 58.9% year over year, and that is the kind of growth that can support a premium only if it starts to convert into margin leverage. EBITDA improved from $-5.8M in Q2 2025 to $-3.5M in Q2 2026, but the path was not linear, which tells me the business is still volatile underneath the headline growth.
Profitability
AMPX — Profitability (TTM)
| Metric | TTM |
|---|---|
| Operating Margin (TTM) | -12.6% |
| Net Margin (TTM) | -33.4% |
| Return on Assets (TTM) | -8.6% |
| Return on Equity (TTM) | -36.1% |
| Gross Margin (TTM) | 22.2% |
| EBITDA Margin (TTM) | -13.5% |
Source: Yahoo Finance — Trailing Twelve Months (TTM)
Gross margin was 22.3% TTM, which tells me the cell chemistry is not the core issue. The problem is below the gross line: operating margin was -12.6% TTM, EBITDA margin was -13.5% TTM, and net margin was -33.4% TTM, so overhead and below-the-line costs are still overwhelming the gross profit base. ROA was -8.55% TTM and ROE was -36.1% TTM, which means the company is still destroying capital at both the asset and equity level. I would watch operating margin first, because a positive operating margin would show the fixed-cost base is finally being absorbed.
Valuation
AMPX — Valuation Multiples
| Metric | Value |
|---|---|
| Current Share Price (USD) | 7.5 |
| Market Cap (USD Mil) | 1,097 |
| Enterprise Value (USD Mil) | 1,169 |
| Trailing P/E | — |
| Forward P/E | 75.1 |
| Price/Sales (TTM) | 10 |
| Price/Book (mrq) | 8.7 |
| EV/Revenue | 10.7 |
| EV/EBITDA | -79.5 |
| FCF Yield % (TTM) | -3.3% |
| Forward EPS (USD) | 0.1 |
| Analyst Target Price – Low (USD) | 14 |
| Analyst Target Price – Mean (USD) | 22.1 |
| Analyst Target Price – High (USD) | 30 |
| # Analyst Opinions | 10 |
Source: Yahoo Finance
Amprius trades at $7.5 per share, with a market cap of $1.1B and enterprise value of $1.17B. That works out to 10.7x EV/revenue and 9.9x price/sales TTM, which is rich for a business that is still burning cash and has a negative 3.27% FCF yield. The earnings-based multiples are not helpful as cheapness signals: forward P/E is 75.1x on just $0.1 of forward EPS, and EV/EBITDA is -79.5x because EBITDA is still negative.
On the analysis here, I would put fair value in a wide range of roughly $0 to $13 per share, using peer EV/revenue as the anchor and then adjusting for Amprius’ cash balance, debt load, and still-negative cash generation. That range sits broadly inside the analyst consensus band of $14 to $30, but I think the market is giving more credit to the earnings ramp than the current cash flow profile justifies. The implied EPS picture is similarly stretched: $0.1 of forward EPS is enough to make the forward multiple look optically high, but not enough to make the stock cheap on a like-for-like basis versus peers that already generate positive earnings or cash flow. In my view, the valuation only works if revenue growth turns into sustained margin improvement, not just a larger top line.
Leverage
AMPX — Leverage & Coverage (Quarterly)
| Metric | Value |
|---|---|
| Total Debt/Equity % (mrq) | 5.1 |
| Current Ratio (mrq) | 7.2 |
| Total Debt (mrq, USD Mil) | 6.4 |
| Net Debt/EBITDA (TTM) | 4.6 |
| FCF Margin % (TTM) | -32.9% |
Source: Yahoo Finance — Quarterly Financial Statements
Total debt was $6.377M mrq, total debt/equity was 5.076%, and the current ratio was 7.17x, so the balance sheet is lightly levered and liquid. Cash was $74.52M mrq, which gives the company room to absorb volatility, but operating cash flow was $-52.87M TTM and levered free cash flow was $-35.9M TTM, so that cushion is being consumed rather than replenished. Net debt/EBITDA was 4.633x TTM and FCF margin was -32.86% TTM, which tells me the real issue is not headline leverage but the lack of internal funding capacity. The balance sheet is flexible today, yet the cash burn means that flexibility will narrow unless the operating margin improves.
Insider Activity
The insider record is one-sided selling. I see 34 open-market sales for $69.1M and no open-market purchases in the 2025-02-21 to 2026-06-04 window, with selling spread across the CEO, a director, and the CTO. That does not prove anything on its own, but it does tell me the people closest to the business are not using their own capital to lean into the stock at current levels.
Comparable Analysis
LF0 has published standalone analyses of these peers: Eos Energy Enterprises (EOSE) (rated Hold); Fluence Energy (FLNC) (FLNC) (rated Sell).
Growth
| Company | Revenue TTM (USD Mil) | Revenue Growth YoY % | Diluted EPS TTM |
|---|---|---|---|
| AMPX | 109.2 | 125.9% | -0.3 |
| ENVX | 35.9 | 20.8% | -0.8 |
| MVST | 367.6 | -4.5% | 0 |
| EOSE | 214.2 | 351.4% | -5.8 |
| FLNC | 2,631.9 | 7.9% | -0.6 |
| BE | 3,829.9 | 138.1% | 1.6 |
Source: Yahoo Finance
AMPX’s revenue growth of 125.9% TTM is well ahead of FLNC at 7.9% and MVST at -4.5%, but it still trails EOSE at 351.4% and BE at 138.1%. The important point is that AMPX is no longer a no-growth name, yet the growth rate alone does not earn it a premium because EBITDA remains negative at $-14.7M TTM and diluted EPS is still $-0.3.
Valuation
| Company | Current Share Price (USD) | Trailing P/E | Forward P/E | EV/Revenue | EV/EBITDA | Price/Sales (TTM) | Price/Book (mrq) | Market Cap (USD Mil) | Enterprise Value (USD Mil) | FCF Yield % (TTM) | Forward EPS | Analyst Target Price – Low | Analyst Target Price – Mean | Analyst Target Price – High | # Analyst Opinions |
|---|---|---|---|---|---|---|---|---|---|---|---|---|---|---|---|
| AMPX | 7.5 | — | 75.1 | 10.7 | -79.5 | 10 | 8.7 | 1,097 | 1,169 | -3.3% | 0.1 | 14 | 22.1 | 30 | 10 |
| ENVX | 2.4 | — | -3.7 | 18.5 | -4.7 | 14.4 | 2.4 | 517 | 665 | -13.5% | -0.6 | 5 | 9.8 | 21 | 10 |
| MVST | 0.6 | — | 4.9 | 0.9 | 7.9 | 0.6 | 0.4 | 226 | 321 | 28.0% | 0.1 | 4 | 4.5 | 5 | 2 |
| EOSE | 1.9 | — | -10.7 | 8.5 | -6.4 | 3.2 | -0.6 | 679 | 1,828 | -47.7% | -0.2 | 4 | 6.2 | 10 | 8 |
| FLNC | 5.1 | — | -9.7 | 0.4 | -12.8 | 0.4 | 2 | 1,001 | 999 | 0.2% | -0.5 | 3 | 8 | 15 | 20 |
| BE | 167.5 | 101.5 | 31.5 | 15.6 | 98.8 | 12.9 | 25.6 | 49,516 | 59,580 | -0.0% | 5.3 | 102 | 284.9 | 380 | 26 |
Source: Yahoo Finance
AMPX trades at 10.7x EV/revenue and 9.9x price/sales TTM, versus FLNC at 0.4x and 0.4x, MVST at 0.9x and 0.6x, EOSE at 8.5x and 3.2x, and BE at 15.6x and 12.9x. That leaves AMPX priced like a growth asset without the cash generation to back it up, especially since its FCF yield is -3.27% TTM. The peer set also shows why I do not think the market is rewarding AMPX for growth alone: the stock is being valued ahead of the earnings conversion that would normally justify a premium.
Profitability
| Company | Operating Margin (TTM) | Net Margin (TTM) | Return on Assets (TTM) | Return on Equity (TTM) | Gross Margin (TTM) | EBITDA Margin (TTM) |
|---|---|---|---|---|---|---|
| AMPX | -12.6% | -33.4% | -8.6% | -36.1% | 22.2% | -13.5% |
| ENVX | -479.8% | 0.0% | -17.6% | -81.3% | 18.8% | -392.7% |
| MVST | -2.0% | 13.9% | 0.5% | 11.4% | 34.0% | 11.1% |
| EOSE | -121.9% | -246.8% | -30.0% | — | -84.8% | -132.8% |
| FLNC | -8.9% | -3.1% | -3.0% | -23.5% | 9.4% | -3.0% |
| BE | 18.5% | 13.5% | 7.5% | 39.6% | 31.8% | 15.7% |
Source: Yahoo Finance
AMPX’s gross margin of 22.3%, EBITDA margin of -13.5%, operating margin of -12.6%, and net margin of -33.4% all trail BE’s 31.8%, 15.7%, 18.5%, and 13.5%. Even FLNC, with a lower gross margin of 9.4%, has a less negative EBITDA margin of -3.0%, which tells me AMPX is still carrying a cost structure that has not translated revenue growth into operating leverage. In other words, the company is improving scale faster than it is improving earnings quality.
Leverage
| Company | Total Debt/Equity % (mrq) | Current Ratio (mrq) | Total Debt (mrq, USD Mil) | Free Cash Flow TTM (USD Mil) | Net Debt/EBITDA (TTM) | FCF Margin % (TTM) |
|---|---|---|---|---|---|---|
| AMPX | 5.1 | 7.2 | 6.4 | -35.9 | 4.6 | -32.9% |
| ENVX | 255.5 | 9.7 | 541.7 | -69.5 | -0.5 | -193.7% |
| MVST | 35.5 | 1.1 | 193 | 63.4 | 1.6 | 17.2% |
| EOSE | — | 3.3 | 640.8 | -324.1 | -1.2 | -151.3% |
| FLNC | 95.8 | 1.3 | 413.2 | 2.4 | -0.9 | 0.1% |
| BE | 141.9 | 3.7 | 2,786.6 | -1.7 | 0.5 | -0.0% |
Source: Yahoo Finance
AMPX’s debt/equity of 5.076% and current ratio of 7.17x are much cleaner than ENVX at 255.5% and 9.7x or BE at 141.9% and 3.7x, but the low headline leverage is not the same as strong self-funding capacity. Net debt/EBITDA is 4.633x and FCF margin is -32.86%, so the balance sheet is still being supported by cash on hand rather than by recurring free cash flow. That is why I think the leverage profile helps the downside case only at the margin; it does not change the fact that the business still has to earn its way into a better valuation.
Conclusion
I would put my rating as a strong sell because the company’s commercial progress is real, but the financial evidence still says the equity is priced ahead of the cash flow. Revenue reached $34M in Q2 2026 and growth is strong, yet EBITDA was still $-3.5M in the quarter and levered free cash flow was $-35.9M TTM, so the business is scaling before it is self-funding.
The bull case is straightforward: if quarterly revenue stays above $30M and EBITDA moves to a positive operating margin, the fixed-cost base would finally be getting absorbed and the current valuation would start to look more defensible. I would also want to see the outsourced 2.0 GWh capacity translate into repeatable production orders, because that would show the chemistry is becoming a commercial platform rather than a development effort. If that happens, the market could start to treat the current multiple as a bridge to earnings rather than a claim on hope.
The bear case is more immediate. If revenue growth slows while EBITDA and free cash flow stay negative, the stock will be left with a 9.9x price/sales multiple on a business that is still consuming cash. Execution risk on third-party manufacturing and NDAA-compliant sourcing is the other pressure point, because delays there would hit delivery timing and margins at the same time, and the $20M Brighton lease exit already shows how expensive a misstep can be.
Weighing both sides, I think the bear case is more likely to show up first because the company still has to prove that growth can outrun cash burn. I would need to see a positive operating margin and sustained free cash flow improvement before I would move away from a strong sell.
What to Watch Next
- Quarterly revenue above $30M — would support a more constructive view.
- Positive operating margin — would show fixed costs are being absorbed.
- Levered free cash flow turning positive — would reduce financing risk.
- Repeatable production orders from outsourced 2.0 GWh capacity — would validate commercialization.
- Further delays in NDAA-compliant sourcing — would pressure delivery timing and margins.
What’s your take? I rated Amprius (AMPX) STRONG SELL above — but the goal here is to get this right, not just to publish an opinion. What would you add to this analysis, or which risk or catalyst do you think I’m under- or over-weighting? Tell me in the comments.
Our track record: every directional call is tracked publicly on The Scorecard, and Stocks Covered lists every company we have rated and when.
Sources
- SEC 10-K Annual Report — filed 2026-03-06
- SEC 8-K Filing (2026-05-07)
- SEC 8-K Filing (2026-05-06)
- SEC 8-K Filing (2026-04-21)
- SEC 8-K Filing (2026-03-04)
- SEC 8-K Filing (2026-02-03)
- SEC 8-K Filing (2026-01-12)
- SEC Form 4 Insider Transaction (2026-06-05)
- SEC Form 4 Insider Transaction (2026-05-28)
- SEC Form 4 Insider Transaction (2026-05-28)
- SEC 10-K Annual Report — FY2026
- SEC 10-K Annual Report — FY2025
- SEC 10-K Annual Report — FY2024
- SEC 10-K Annual Report — FY2023
Data sourced from Yahoo Finance and SEC EDGAR. Not investment advice.
Leave a Comment