
| Company | Oct 25 | Nov 25 | Dec 25 | Jan 26 | Feb 26 | Mar 26 | Apr 26 | May 26 | Jun 26 | Jul 26 | Aug 26 | Sep 26 | 12-Mo |
|---|---|---|---|---|---|---|---|---|---|---|---|---|---|
| GM | +13% | +6% | +11% | +3% | -6% | -5% | +3% | +8% | -7% | +15% | -3% | -11% | +27% |
| F | +10% | +2% | -1% | +6% | +3% | -18% | +5% | +46% | -20% | +6% | -4% | -13% | +6% |
| RIVN | -8% | +24% | +17% | -25% | +4% | -2% | +9% | -1% | +6% | -12% | +6% | -7% | +2% |
| STLA | +9% | +5% | +2% | -9% | -18% | -12% | +3% | +10% | -28% | +0% | -5% | -21% | -53% |
| TSLA | +3% | -6% | +5% | -4% | -6% | -8% | +3% | +14% | -3% | -26% | +18% | -4% | -20% |
| BYDDY | -8% | -3% | -3% | +2% | -3% | +13% | -2% | -13% | -20% | +29% | -7% | -13% | -32% |
Source: Yahoo Finance monthly adjusted close.
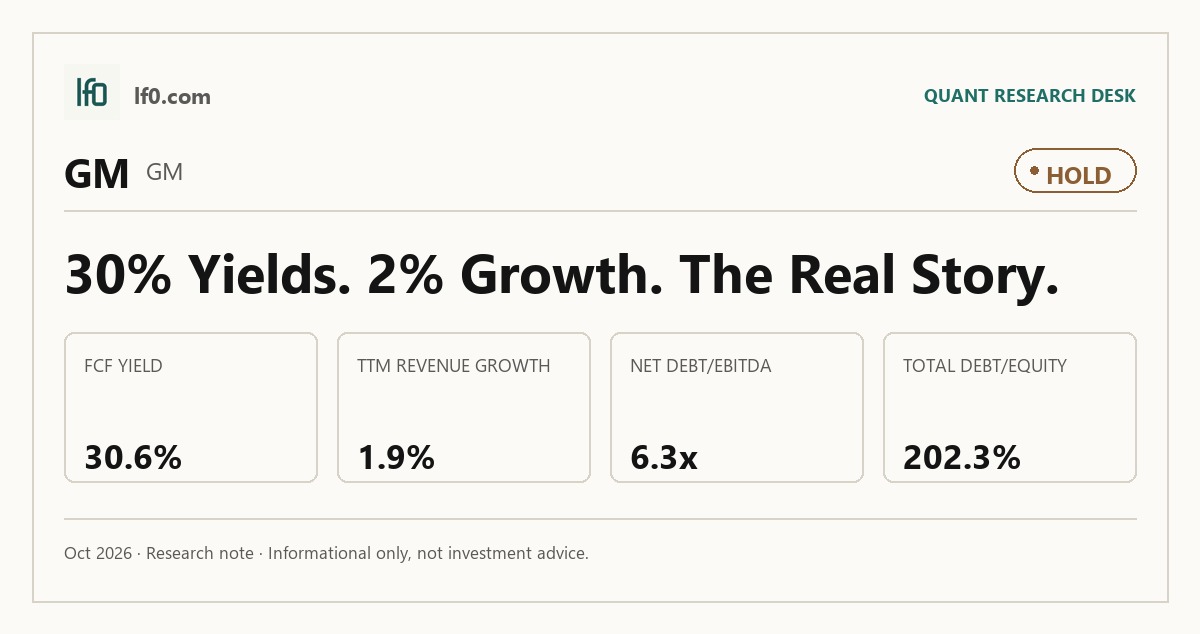
Quick Thesis
- Rated Hold — strong cash yield, but leverage and growth are not yet convincing.
- Strongest financial support: $21.9B of levered free cash flow TTM.
- Main risk: 6.3x net debt/EBITDA leaves little room for error.
- Valuation is fair to slightly cheap at 10.6x EV/EBITDA and 5.3x forward P/E.
- I would raise the rating if operating margin holds above 5.0% for two quarters.
Performance Since Our Last Call
I last had GM at Hold on 2026-08-16, and the stock is down 5.8% since that call, which is a Hold-range outcome rather than a clear thesis break. The fresh numbers do not show a collapse in cash generation, but they also do not show the margin expansion I would need to argue the prior call was too cautious. That leaves the earlier Hold intact for now, but the burden of proof is still on the company to turn cash flow into better earnings quality.
Executive Summary
Rating: HOLD | GM
We’ll begin tracking this call’s performance since publication once sufficient adjusted-close data is available.
I would put my rating as a Hold because GM still combines a 30.6% FCF yield with 6.3x net debt/EBITDA, so the equity is backed by real cash but not by a balance sheet I would call flexible. The business has a durable operating base in its dealer network and manufacturing footprint, yet the latest quarter still shows only 1.1% net margin, which tells me the earnings engine remains thin. I would become more constructive if operating margin can stay above 5.0% for two consecutive quarters, because that would show the company is converting truck and SUV pricing into a more durable profit base rather than just defending the current one.
Company Profile
General Motors was incorporated in Delaware in 2009 and is listed on the New York Stock Exchange under GM. It designs, builds, and sells trucks, crossovers, cars, and parts, while also earning revenue from software-enabled services and subscriptions and from GM Financial, its captive auto finance arm that provides retail loans, leases, and dealer lending. The core automotive business is organized into GM North America and GM International, with brands including Buick, Cadillac, Chevrolet, and GMC, plus equity stakes in China joint ventures that sell Baojun, Buick, Cadillac, Chevrolet, and Wuling vehicles. GM employed about 155,000 people at December 31, 2025, including 50 U.S. manufacturing plants and parts facilities in 19 states, 11 vehicle assembly plants, and 4,566 authorized dealerships in North America. In 2025, it announced about $4B of U.S. plant investment and nearly $1B for a new V8 engine program in New York.
Economic Moat
Business Model
The dealer network and 50 U.S. manufacturing plants and parts facilities in 19 states are the most defensible parts of GM’s model, because a well-funded rival cannot recreate that physical footprint, franchise coverage, and service reach within 3 years. GM had 4,566 authorized dealerships in GMNA and 6,276 in GMI at December 31, 2025, and those outlets are the primary sales and service interface with the end customer. I feel that this is hard to replicate because dealer contracts, local service capability, and franchise-law constraints make rapid network replacement impractical even for a large entrant. A secondary advantage is the software layer: OnStar is available in more than 20 markets globally, and Super Cruise works on more than 600,000 miles of compatible roads in the U.S. and Canada, which gives GM a recurring-services channel that can deepen customer engagement after the vehicle sale.
GM’s strategic reset also matters for the moat. The company has pulled back from a standalone robotaxi push, stopped funding Cruise robotaxi development in December 2024, completed the acquisition of Cruise’s noncontrolling interests in February 2025, and folded the autonomous technical effort into GMNA. In my view, that narrows the ambition to areas where GM can actually monetize its scale, rather than spending against a model it does not control well enough to defend.
Business & Operating Risks
The biggest disclosed risk is that GM may not be able to keep its product mix and technology stack ahead of a market that is shifting faster than its current portfolio. GM must keep funding and launching EVs and AV capabilities, software-enabled connected services, and future features and services based on AI while also competing with start-ups and other non-traditional competitors backed by large technology companies. The mechanism is straightforward: if GM misses on product timing, software quality, or capital allocation, sales and profitability weaken because the company is still carrying a high fixed-cost base and the new businesses require extensive capital investment. That risk is already showing up in the financial data, since GMNA recorded $7.9B of charges in FY2025 tied to EV capacity and manufacturing footprint realignment.
The second risk is the company’s dependence on full-size ICE SUVs and full-size ICE pickup trucks for near-term profit. GM says its near-term profitability is dependent upon the success of those vehicles, and that a shift toward smaller, more fuel-efficient vehicles or tighter fuel-economy rules could hurt margins. This is not abstract boilerplate because the same filing says GM uses cash from those vehicles to fund EVs, autonomous driving, and software, so any mix shift would hit both current earnings and future investment capacity. Tariffs add another layer of pressure, and the filing is explicit that the tariff environment remains highly dynamic and that mitigation actions may not fully offset the impact in the near term.
The disclosed risks do not break the moat, but they do test it. In my view, the dealer and plant footprint still gives GM a real structural edge, yet the EV reset and tariff exposure are pressuring the cash engine that funds that edge.
Management Discussion & Analysis
Management is clearly re-allocating capital toward the core automotive franchise, and that is the right response to the risks above even if it is still expensive. In December 2024 it stopped funding Cruise robotaxi development, and in February 2025 it completed the acquisition of the remaining Cruise interests and began winding down robotaxi operations. The 2026 guide for EPS-diluted of $11.00 to $13.00 and EBIT-adjusted of $13B to $15B, alongside a tariff hit estimate of $3B to $4B for 2026, implies management is leaning on truck and SUV profitability plus cost discipline to offset policy and trade pressure rather than counting on EV volume to carry the earnings bridge.
The balance-sheet posture is still constructive. GM ended the period with $35.7B of Automotive available liquidity and renewed a $10B five-year facility plus a $4.1B three-year facility, so the near-term funding risk is low even though the company is still spending $10B to $12B on capital spending and battery cell joint ventures in 2026. The share repurchase cadence also matters: GM bought back $4B of stock in 2025, retired 43 million shares through the accelerated share repurchase program, and lifted the quarterly dividend to $0.18 in January 2026. I read that as confidence in cash generation, but not as proof that the EV reset is finished, because the filing still flags further restructuring and rationalization actions as possible.
Recent Events
The March 23, 2026 renewal of GM’s 364-day revolving credit agreement gives General Motors Financial Company access to a $2B unsecured facility while preserving minimum liquidity covenants of $4B globally and $2B in the U.S. That strengthens the backstop and supports the capital-intensive auto model because it extends near-term funding flexibility without forcing a larger permanent debt stack.
On June 2, 2026, shareholders approved Amendment No. 2 to the 2020 Long-Term Incentive Plan, which adds 27 million shares and extends the plan to June 3, 2036. That helps GM retain and pay management through the next product cycle, but it also raises dilution risk, so I see it as a modest test of per-share value rather than a clear positive.
On May 26, 2026, Jonathan McNeill said he would not stand for reelection and will retire from the board after the annual meeting, and the board will shrink from 11 directors to 10. The board change looks orderly, not disruptive, so it leaves the governance picture broadly intact.
Financial Analysis
Growth
GM — Financial Growth (Quarterly, USD Mil)
| Metric | 2025-03-31 | 2025-06-30 | 2025-09-30 | 2025-12-31 | 2026-03-31 | 2026-06-30 |
|---|---|---|---|---|---|---|
| REVENUE (USD Mil) | — | 47,122 | 48,591 | 45,286 | 43,624 | 48,026 |
| EBIT (USD Mil) | — | 2,573 | 1,628 | -4,082 | 3,505 | 1,719 |
| EBITDA (USD Mil) | — | 8,548 | 5,740 | 419 | 6,535 | 4,822 |
| NET INCOME (USD Mil) | — | 1,895 | 1,327 | -3,310 | 2,627 | 1,305 |
Source: Yahoo Finance — Quarterly Financial Statements
GM’s revenue was $48B in Q2 2026 versus $43.6B in Q1 2026, up 10.1% sequentially, after $45.3B in Q4 2025 and $48.6B in Q3 2025. On a year-over-year basis, Q2 2026 revenue was up 1.9% from $47.1B in Q2 2025, while Q1 2026 was down 7.8% from $47.1B in Q1 2025. EBITDA moved more sharply than revenue: $4.8B in Q2 2026 versus $6.5B in Q1 2026 and $5.7B in Q3 2025, so earnings are more volatile than sales. The Q1 rebound fits GM’s emphasis on high-margin trucks and SUVs, but Q2’s softer EBITDA suggests the growth path is not yet durable.
Profitability
GM — Profitability (TTM)
| Metric | TTM |
|---|---|
| Operating Margin (TTM) | 3.2% |
| Net Margin (TTM) | 1.1% |
| Return on Assets (TTM) | 2.2% |
| Return on Equity (TTM) | 3.2% |
| Gross Margin (TTM) | 10.2% |
| EBITDA Margin (TTM) | 8.9% |
Source: Yahoo Finance — Trailing Twelve Months (TTM)
GM’s TTM profitability is thin but still positive, which fits a mature automaker absorbing tariff and warranty pressure rather than a business still in early build-out. TTM gross margin was 10.2%, EBITDA margin was 8.9%, operating margin was 3.2%, net margin was 1.1%, ROA was 2.3%, and ROE was 3.2%. The 7.0-point gap between gross margin and operating margin shows that SG&A, R&D, and other fixed costs still consume most of the gross profit, so investors should watch operating margin first because it captures whether GM can convert vehicle pricing into real operating leverage. The 2.1-point gap between EBITDA margin and operating margin is modest, which means depreciation and amortisation are not the main issue; the bigger drag is the cost structure above the factory floor. ROE only modestly exceeds ROA, so returns are not being heavily amplified by leverage. The key next signal is operating margin moving above 5.0%, which would show the business is building durable earnings power rather than merely staying barely profitable.
Valuation
GM — Valuation Multiples
| Metric | Value |
|---|---|
| Current Share Price (USD) | 79.3 |
| Market Cap (USD Mil) | 71,732 |
| Enterprise Value (USD Mil) | 175,285 |
| Trailing P/E | 34.3 |
| Forward P/E | 5.3 |
| Price/Sales (TTM) | 0.4 |
| Price/Book (mrq) | 1.1 |
| EV/Revenue | 0.9 |
| EV/EBITDA | 10.6 |
| FCF Yield % (TTM) | 30.6% |
| Forward EPS (USD) | 15 |
| Analyst Target Price – Low (USD) | 75 |
| Analyst Target Price – Mean (USD) | 104.2 |
| Analyst Target Price – High (USD) | 132 |
| # Analyst Opinions | 23 |
Source: Yahoo Finance
GM trades at 0.94x EV/Revenue and 0.39x Price/Sales on a current share price of $79.3, which tells me the market is valuing the business on a low-sales, low-margin auto cycle rather than on any premium growth narrative. The 10.6x EV/EBITDA multiple is the cleaner anchor here because EBITDA is still positive, and it implies investors are paying about 10.6 years of current EBITDA for a business facing tariff headwinds and cyclical earnings volatility. Trailing P/E is 34.3x, but that is distorted by the latest earnings mix and is less useful than the 5.3x forward P/E, which prices in a sharp normalization in earnings power. The PEG ratio of 0.3 suggests the market is not paying much for expected growth, while the 30.6% FCF yield and 11.8% FCF margin show the equity is backed by real cash generation at today’s price. Book value per share is $70.7 versus the $79.3 share price, so the stock trades at 1.1x book, a modest premium that says the market is giving some credit to GM’s asset base but not much beyond that.
On my read, fair value sits in a broad $75-$104 range. That sits inside the analyst target range of $75 to $132 and just below the $104.2 mean, which makes sense because I weight leverage and tariff risk more heavily than the consensus appears to. The forward EPS of $15.1 is also well above Ford’s $2, Rivian’s -$1.7, Stellantis’ $1.2, Tesla’s $2.2, and BYD’s $0.8, so GM is priced as the clear earnings leader even though its revenue growth is only 1.9% TTM. That gap between earnings power and growth is why I do not think the stock deserves a growth multiple, but it also explains why the current valuation is not expensive if margins hold.
Leverage
GM — Leverage & Coverage (Quarterly)
| Metric | Value |
|---|---|
| Total Debt/Equity % (mrq) | 202.3 |
| Current Ratio (mrq) | 1.1 |
| Total Debt (mrq, USD Mil) | 128,772 |
| Operating Cash Flow (TTM, USD Mil) | 23,202 |
| Levered Free Cash Flow (TTM, USD Mil) | 21,933.8 |
| Net Debt/EBITDA (TTM) | 6.3 |
| FCF Margin % (TTM) | 11.8% |
Source: Yahoo Finance — Quarterly Financial Statements
GM’s leverage is elevated but still serviceable. Total debt/equity was 202.3% in mrq, current ratio was 1.1x in mrq, and total debt was $128.8B in mrq, so the balance sheet is debt-heavy and leaves only a modest liquidity cushion. On cash generation, operating cash flow was $23.2B in TTM and levered free cash flow was $21.9B in TTM, which shows GM is still converting earnings into cash rather than funding operations through borrowing. Net debt/EBITDA was 6.3x in TTM and FCF margin was 11.8% in TTM, so cash generation is solid but not enough to make leverage comfortable.
In my view, this is medium refinancing risk because the current ratio gives near-term breathing room, but 6.3x net leverage leaves limited flexibility if tariffs, warranty costs, or a weaker auto market pressure EBITDA. The profile is a bear signal for financial flexibility, even though current cash flow is strong enough to avoid immediate distress.
Insider Activity
The insider transaction record I see here is decisively net selling: 18 open-market sales versus 1 open-market purchase over the 2025-01-30 to 2026-05-29 window, and the sales total $89.5M versus $607,920 of buying. The pattern is broad rather than concentrated, with Mary Barra, Rory Harvey, Paul Jacobson, and Christopher Hatto all transacting on the sell side, which weakens alignment with outside shareholders.
Comparable Analysis
Growth
| Company | Revenue TTM (USD Mil) | Revenue Growth YoY % | Diluted EPS TTM |
|---|---|---|---|
| GM | 185,528 | 1.9% | 2.3 |
| F | 187,973 | -3.8% | -1.9 |
| RIVN | 5,883 | 27.2% | -2.6 |
| STLA | 160,861 | 13.1% | -8.3 |
| TSLA | 103,619 | 25.5% | 1.1 |
| BYDDY | 777,499.4 | -3.2% | 0.5 |
Source: Yahoo Finance
GM’s revenue growth was 1.9% TTM, versus BYDDY at -3.2%, F at -3.8%, STLA at 13.1%, RIVN at 27.2%, and TSLA at 25.5%. That puts GM in the middle of a very split peer set, but the premium to Ford and BYD is modest while the gap to Rivian and Tesla is large, so the current multiple is not being asked to pay for growth leadership.
Valuation
| Company | Current Share Price (USD) | Trailing P/E | Forward P/E | EV/Revenue | EV/EBITDA | Price/Sales (TTM) | Price/Book (mrq) | Market Cap (USD Mil) | Enterprise Value (USD Mil) | FCF Yield % (TTM) | Forward EPS | Analyst Target Price – Low | Analyst Target Price – Mean | Analyst Target Price – High | # Analyst Opinions |
|---|---|---|---|---|---|---|---|---|---|---|---|---|---|---|---|
| GM | 79.3 | 34.3 | 5.3 | 0.9 | 10.6 | 0.4 | 1.1 | 71,732 | 175,285 | 30.6% | 15 | 75 | 104.2 | 132 | 23 |
| F | 12.3 | — | 6.3 | 1 | 24.9 | 0.3 | 1.4 | 48,928 | 190,140 | -16.2% | 2 | 12.8 | 16 | 20 | 18 |
| RIVN | 14.8 | — | -8.5 | 3.6 | -7.9 | 3.6 | 3.9 | 21,370 | 21,434 | -7.2% | -1.7 | 13 | 19.3 | 25 | 26 |
| STLA | 4.7 | — | 3.8 | 0.2 | -109.3 | 0.1 | 0.2 | 13,605 | 34,210 | -24.6% | 1.2 | 4 | 6.7 | 11.1 | 10 |
| TSLA | 354.1 | 334.1 | 163.7 | 13.2 | 127.5 | 13.5 | 16.1 | 1,398,574 | 1,371,791 | 0.4% | 2.2 | 125 | 395.6 | 600 | 38 |
| BYDDY | 9.7 | 20.2 | 11.8 | 0.1 | 0.8 | 0.1 | 2.5 | 88,254 | 97,722 | -109.1% | 0.8 | 16 | 16 | 16 | 1 |
Source: Yahoo Finance
GM trades at 30.6% FCF yield TTM, 0.94x EV/Revenue, 34.3x trailing P/E, 5.3x forward P/E, and 0.39x Price/Sales, versus F at -16.2% FCF yield, 1.0x EV/Revenue, 6.3x forward P/E, and 0.3x Price/Sales; RIVN at -7.2% FCF yield and 3.6x EV/Revenue; STLA at -24.6% FCF yield and 0.2x EV/Revenue; TSLA at 0.4% FCF yield and 13.2x EV/Revenue; BYDDY at -109.1% FCF yield and 0.1x EV/Revenue. GM’s 30.6% FCF yield is the standout in the group, and the market is already giving GM a cash-generation discount rather than a growth premium. Forward EPS of $15.1 is also far above F at $2, RIVN at -$1.7, STLA at $1.2, TSLA at $2.2, and BYDDY at $0.8, which means GM is priced as the clear earnings leader even though its revenue growth is only 1.9% TTM.
Profitability
| Company | Operating Margin (TTM) | Net Margin (TTM) | Return on Assets (TTM) | Return on Equity (TTM) | Gross Margin (TTM) | EBITDA Margin (TTM) |
|---|---|---|---|---|---|---|
| GM | 3.2% | 1.1% | 2.2% | 3.2% | 10.2% | 8.9% |
| F | 1.9% | -3.9% | 0.3% | -18.3% | 7.1% | 4.1% |
| RIVN | -50.4% | -55.0% | -14.4% | -57.5% | 7.5% | -46.1% |
| STLA | 2.2% | -12.1% | -1.3% | -28.7% | 6.6% | -0.2% |
| TSLA | 1.4% | 3.7% | 1.9% | 4.7% | 18.9% | 10.4% |
| BYDDY | 7.2% | 3.8% | 2.8% | 11.6% | 17.9% | 15.2% |
Source: Yahoo Finance
GM’s 3.2% operating margin, 1.1% net margin, 10.2% gross margin, and 8.9% EBITDA margin sit above F’s 1.9%, -3.9%, 7.1%, and 4.1%, and well above RIVN’s -50.4%, -55.0%, 7.5%, and -46.1%; they are also ahead of STLA’s 2.2%, -12.1%, 6.6%, and -0.2%, while TSLA still leads on gross margin at 18.9% and EBITDA margin at 10.4%. The gap looks more like scale and cost structure than a pure pricing advantage, because GM’s gross margin is only modestly above Ford and Stellantis while its operating margin is better, which points to tighter opex control rather than a fundamentally different product mix.
Leverage
| Company | Total Debt/Equity % (mrq) | Current Ratio (mrq) | Total Debt (mrq, USD Mil) | Operating Cash Flow TTM (USD Mil) | Free Cash Flow TTM (USD Mil) | Net Debt/EBITDA (TTM) | FCF Margin % (TTM) |
|---|---|---|---|---|---|---|---|
| GM | 202.3 | 1.1 | 128,772 | 23,202 | 21,933.8 | 6.3 | 11.8% |
| F | 456.7 | 1.1 | 163,296 | 16,947 | -7,940.2 | 18.5 | -4.2% |
| RIVN | 104.4 | 2.1 | 5,353 | -1,845 | -1,539.4 | 0 | -26.2% |
| STLA | 84.4 | 1 | 52,098 | -5,250 | -3,343.5 | -64.4 | -2.1% |
| TSLA | 18.4 | 1.9 | 16,080 | 18,685 | 4,836 | -2.6 | 4.7% |
| BYDDY | 46.1 | 0.9 | 125,904.4 | 64,636.8 | -96,303.9 | 0 | -12.4% |
Source: Yahoo Finance
GM’s 202.3% debt/equity and 6.3x net debt/EBITDA are heavier than TSLA’s 18.4% and -2.6x, lighter than F’s 456.7% and 18.5x, and far cleaner than STLA’s 84.4% and -64.4x or RIVN’s 104.4% and 0x. GM’s 11.8% FCF margin is the key offset, because it shows the debt load is being serviced by real cash rather than accounting earnings, and that makes GM’s leverage look like a financing choice for a mature automaker rather than a balance-sheet stress signal.
Conclusion
The tension in GM is straightforward: the company is generating real cash, but the balance sheet and operating margin still leave little room for disappointment. I would put my rating as a Hold because the 30.6% FCF yield is strong enough to support the stock, yet 6.3x net debt/EBITDA and only 3.2% operating margin tell me the equity is not cheap enough to ignore execution risk.
I would raise my rating more towards a Buy if operating margin holds above 5.0% for two consecutive quarters, because that would show GM is converting truck and SUV pricing into a more durable earnings base rather than just surviving tariff noise. On the current $185.5B TTM revenue base, moving operating margin from 3.2% to 5.0% would add about $3.3B of annual operating profit, which would materially improve the deleveraging path and make the 5.3x forward P/E look much less demanding. I would also want to see net debt/EBITDA move below 5.5x, meaning leverage is coming down rather than staying pinned at a level that limits flexibility.
The bear case is that tariffs, warranty costs, or a weaker mix push EBITDA back toward the Q2 2026 level of $4.8B, because that would leave GM closer to 7.0x net leverage and make the current valuation look less like a cash-flow bargain and more like a cyclical peak. If revenue growth stays near 1.9% TTM while insider selling continues at the recent pace, the market will likely stop paying for the 30.6% FCF yield and start focusing on the balance-sheet burden instead.
I lean to Hold rather than Buy because the bull case needs margin expansion that has not yet shown up in the latest quarter, while the bear case can arrive faster through policy or mix pressure. The cash generation is strong enough to keep me constructive, but until GM proves it can lift operating margin above 5.0% without leaning on a favorable cycle, I do not think the upside is large enough to justify a more aggressive rating.
What to Watch Next
- Operating margin above 5.0% for two quarters — would support a move toward Buy.
- Net debt/EBITDA below 5.5x — would show leverage is easing.
- Quarterly EBITDA near $4.8B or lower — would strengthen the bear case.
- Revenue growth staying near 1.9% TTM — would cap multiple expansion.
- Insider selling continuing at the recent pace — would keep governance sentiment weak.
What’s your take? I rated General Motors (GM) HOLD above — but the goal here is to get this right, not just to publish an opinion. What would you add to this analysis, or which risk or catalyst do you think I’m under- or over-weighting? Tell me in the comments.
Sources
- SEC 10-K Annual Report — filed 2026-01-27
- SEC 8-K Filing (2026-06-04)
- SEC 8-K Filing (2026-05-26)
- SEC 8-K Filing (2026-04-28)
- SEC 8-K Filing (2026-03-23)
- SEC 8-K Filing (2026-01-27)
- SEC 8-K Filing (2026-01-08)
- SEC Form 4 Insider Transaction (2026-06-02)
- SEC Form 4 Insider Transaction (2026-06-01)
- SEC Form 4 Insider Transaction (2026-06-01)
- SEC 10-K Annual Report — FY2026
- SEC 10-K Annual Report — FY2025
- SEC 10-K Annual Report — FY2024
- SEC 10-K Annual Report — FY2023
- SEC 10-K Annual Report — FY2022
Data sourced from Yahoo Finance and SEC EDGAR. Not investment advice.
Leave a Comment