| Company | Jul 25 | Aug 25 | Sep 25 | Oct 25 | Nov 25 | Dec 25 | Jan 26 | Feb 26 | Mar 26 | Apr 26 | May 26 | Jun 26 | Trailing 12-Mo |
|---|---|---|---|---|---|---|---|---|---|---|---|---|---|
| AMBA | +0.03% | +24.80% | +0.05% | +3.28% | -12.96% | -4.50% | -9.60% | -5.78% | -14.68% | +33.64% | +4.91% | +18.87% | +29.86% |
| MRVL | +3.92% | -21.77% | +33.72% | +11.58% | -4.63% | -4.94% | -7.06% | +3.51% | +21.25% | +66.82% | +24.13% | +45.31% | +285.91% |
| ALAB | +51.22% | +33.26% | +7.46% | -4.66% | -15.59% | +5.58% | -9.46% | -21.11% | -7.77% | +77.68% | +76.06% | +40.88% | +434.20% |
| NVDA | +12.58% | -2.07% | +7.13% | +8.53% | -12.59% | +5.37% | +2.48% | -7.29% | -1.57% | +14.43% | +5.80% | -5.12% | +26.82% |
| ADI | -5.63% | +11.88% | -1.85% | -4.71% | +13.33% | +2.57% | +14.63% | +14.45% | -10.30% | +26.44% | +2.88% | -3.77% | +69.10% |
| ON | +7.54% | -12.01% | -0.56% | +1.56% | +0.32% | +7.78% | +10.60% | +11.00% | -6.86% | +62.81% | +19.65% | -21.62% | +80.39% |
Source: Yahoo Finance monthly adjusted close. Each column is a fully completed calendar month; the current in-progress month is excluded. Trailing 12-Mo compounds the 12 monthly returns.
Executive Summary
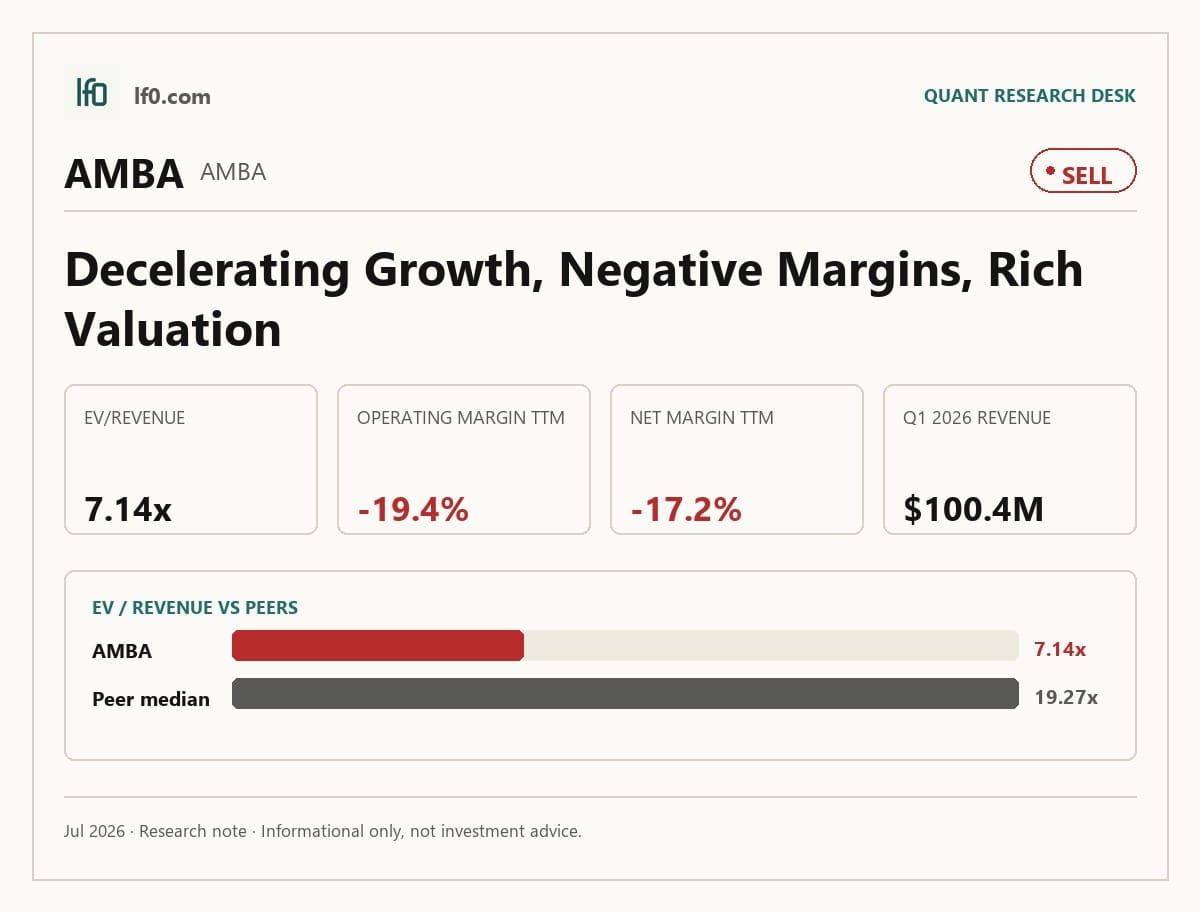
Rating: SELL | AMBA
Measured from adjusted close on 2026-07-14 to 2026-10-13. Sell ratings are correct when the stock falls; Hold is tracked as a +/-10% range. Daily-close data, not intraday. Calls are tracked for 182 days from publication, then frozen as a final record.
I would put my rating as a Sell because Ambarella’s revenue growth is real, but the current valuation already assumes a much cleaner earnings inflection than the latest margins justify. The company posted $100.4M of revenue in Q1 2026, yet TTM operating margin was still -19.4% and net margin was -17.2%, so the stock is being asked to discount profitability that has not shown up in the numbers. The key risk is customer concentration through WT Microelectronics, which accounted for about 70% of fiscal 2026 revenue and can be terminated on 60 days’ notice. I would move more toward a Hold only if quarterly revenue stays above $100M and operating margin turns positive, meaning the business is finally absorbing its fixed cost base.
Company Profile
Ambarella designs semiconductor solutions for edge artificial intelligence, computer vision, and automotive applications. Its chips are sold through a concentrated channel structure, with WT Microelectronics serving as the non-exclusive sales representative and fulfillment partner in Asia outside Japan. Revenue is still heavily tied to Asia, which makes the company’s growth profile dependent on both channel execution and continued adoption of higher-value AI processors. In practical terms, this is a design-win business: the investment case depends on converting engineering wins into repeatable shipments at scale.
Economic Moat
Business Model
The moat, such as it is, comes from specialized system-on-chip design capability and the ability to win sockets in edge AI and vision applications where performance per watt matters. That is a real technical advantage, but I do not think it is yet a durable economic moat in the classic sense because the company still relies on a concentrated channel and outsourced manufacturing. The gross margin profile shows the product has pricing power at the chip level, with TTM gross margin at 58.8%, but the business has not converted that into operating leverage.
Business & Operating Risks
The most material disclosed risk is channel concentration. WT Microelectronics accounted for about 70% of fiscal 2026 revenue, and because the agreement can be terminated on 60 days’ notice, a dispute or inventory correction there would hit sales quickly. Supply chain dependence is the other major issue: Ambarella outsources wafer fabrication, assembly, and testing, and the filing says each SoC is single sourced at one manufacturing facility. Those risks do threaten the moat I identified above, because a design advantage is much less valuable if one channel partner or one foundry can interrupt delivery.
Management Discussion & Analysis
Management is responding by spending into the AI roadmap rather than defending near-term margins, which is the right strategic response to the product opportunity but not yet a proof point on execution. R&D rose to $238.5M in FY2026 from $226.1M in FY2025, while SG&A increased to $75.3M from $72.8M, and that higher spend helped revenue reach $390.7M in FY2026, up 37.2%. The company also ended the year with $312.6M of cash, cash equivalents, and marketable debt securities, so it has time to keep investing. That said, the same filing says future funding could still come from equity, convertible debt, or commercial borrowing, so liquidity is adequate rather than decisive.
Recent Events
The February 23, 2026 appointment of Gregory M. Bryant as an independent director and Compensation Committee member adds semiconductor operating experience to the board, which is constructive for a company trying to scale edge AI design wins. The February 24, 2026 approval of the FY2027 Annual Bonus Plan also matters because it ties incentives to revenue, operating profit, and non-financial operating goals, which should keep management focused on execution rather than growth at any cost. I view these events as supportive of the moat thesis, but they do not change the fact that the channel and supply chain structure remain the real points of vulnerability.
Financial Analysis
Growth
AMBA — Financial Growth (Quarterly, USD Mil)
| Metric | 2025-04-30 | 2025-07-31 | 2025-10-31 | 2026-01-31 | 2026-04-30 |
|---|---|---|---|---|---|
| REVENUE (USD Mil) | 85.9 | 95.5 | 108.5 | 100.9 | 100.4 |
| EBIT (USD Mil) | -25.9 | -22 | -16.2 | -18.4 | -19.4 |
| EBITDA (USD Mil) | -19.1 | -15.4 | -9.7 | -12.7 | -13 |
| NET INCOME (USD Mil) | -24.3 | -20 | -15.1 | -16.4 | -18.1 |
| DILUTED EPS | -0.6 | -0.5 | -0.3 | -0.4 | -0.4 |
Source: Yahoo Finance — Quarterly Financial Statements
Revenue rose from $85.9M in Q2 2025 to $108M in Q3 2025 before easing to $100.4M in Q1 2026, so the trend is upward but not linear. On a year-over-year basis, quarterly revenue growth ranged from 11.8% to 26.0%, which tells me demand is improving without yet showing a clean acceleration pattern. That matters because the moat thesis depends on design wins turning into sustained shipments, not just one strong quarter.
Profitability
AMBA — Profitability (TTM)
| Metric | TTM |
|---|---|
| Operating Margin (TTM) | -19.3% |
| Net Margin (TTM) | -17.2% |
| Return on Assets (TTM) | -6.4% |
| Return on Equity (TTM) | -11.8% |
| Gross Margin (TTM) | 58.8% |
| EBITDA Margin (TTM) | -15.5% |
Source: Yahoo Finance — Trailing Twelve Months (TTM)
TTM gross margin was 58.8%, but operating margin was -19.4% and EBITDA margin was -15.5%, so the company still loses money after R&D and overhead. Net margin was -17.2%, while ROA was -6.4% and ROE was -11.8%, which confirms that the current growth rate is not yet producing acceptable returns on capital. I see the gross margin as evidence that the chip economics are sound, but the opex structure is still too heavy for the business to look self-funding at scale.
Valuation
AMBA — Valuation Multiples
| Metric | Value |
|---|---|
| Market Cap (USD Mil) | 3,159 |
| Enterprise Value (USD Mil) | 2,894 |
| Trailing P/E | — |
| Forward P/E | 62.8 |
| Price/Sales (TTM) | 7.8 |
| Price/Book (mrq) | 5.2 |
| EV/Revenue | 7.1 |
| EV/EBITDA | -46.1 |
| Beta (5Y Monthly) | 2.11 |
| FCF Yield % (TTM) | 1.5% |
| Forward EPS (USD) | 1.1 |
| Analyst Target Price – Low (USD) | 80 |
| Analyst Target Price – Mean (USD) | 95 |
| Analyst Target Price – High (USD) | 120 |
| # Analyst Opinions | 11 |
Source: Yahoo Finance
Ambarella trades at 7.1x EV/revenue, 7.8x price/sales, and 62.8x forward P/E, with a market cap of $3.2B and enterprise value of $2.9B. On the analysis here, I would put fair value in a range of roughly $70–$90 per share: that is below the $95 analyst mean target and inside the $80–$120 consensus range, but I weight the negative operating margin and 1.5% FCF yield more heavily than the market appears to. Forward EPS is $1.15, which is modest relative to the valuation multiple and leaves little room for disappointment. The rating justification points the same way: 7.1x EV/revenue is rich for a business still posting a -19.4% operating margin, so I do not think the multiple is cheap enough to absorb execution risk.
Leverage
AMBA — Leverage & Coverage (Quarterly)
| Metric | Value |
|---|---|
| Total Debt/Equity % (mrq) | 2.2 |
| Current Ratio (mrq) | 2.4 |
| Total Debt (mrq, USD Mil) | 13.3 |
| Operating Cash Flow (TTM, USD Mil) | 33.1 |
| Levered Free Cash Flow (TTM, USD Mil) | 47.4 |
| Net Debt/EBITDA (TTM) | 4.2 |
| FCF Margin % (TTM) | 11.7% |
Source: Yahoo Finance — Quarterly Financial Statements
Total debt was $13.3M, current ratio was 2.4x, and total debt/equity was 2.2%, so the balance sheet is not stressed. Cash generation is positive, with $33.1M of operating cash flow and $47.4M of levered free cash flow over the trailing twelve months, but net debt/EBITDA was still 4.2x because EBITDA remains negative. That combination tells me liquidity is fine, yet the leverage ratio will only improve if operating earnings turn meaningfully better; cash alone does not solve the problem.
Insider Activity
The insider record is one-sided selling, with no open-market purchases in the period shown. The CEO sold the largest blocks, and the CFO also sold, which is not a fatal signal on its own but does not give me confidence that management sees the shares as obviously cheap. I would treat the selling as a mild negative because it lines up with a stock that already trades on optimistic assumptions.
Comparable Analysis
Growth
| Company | Revenue TTM (USD Mil) | Revenue Growth YoY % | EBITDA TTM (USD Mil) | Diluted EPS TTM |
|---|---|---|---|---|
| AMBA | 405.2 | 16.9% | -62.8 | -1.5 |
| MRVL | 8,717.1 | 27.6% | 2,712 | 2.7 |
| ALAB | 1,001.4 | 93.4% | 233.4 | 1.5 |
| NVDA | 253,491 | 85.2% | 165,514 | 6.5 |
| ADI | 12,740.2 | 37.2% | 6,149.4 | 6.7 |
| ON | 6,063 | 4.7% | 2,047.8 | 1.4 |
Source: Yahoo Finance
Ambarella’s TTM revenue growth was 16.9%, ahead of ON’s 4.7% but below MRVL’s 27.6%, ADI’s 37.2%, ALAB’s 93.4%, and NVDA’s 85.2%. That puts AMBA in the middle of the group on growth, so it deserves neither a hyper-growth multiple nor a low-growth discount. The key point is that the market is paying for a faster ramp than the company is actually delivering.
Valuation
| Company | Trailing P/E | Forward P/E | EV/Revenue | EV/EBITDA | Price/Sales (TTM) | Price/Book (mrq) | Market Cap (USD Mil) | Enterprise Value (USD Mil) | Beta (5Y Monthly) | FCF Yield % (TTM) | Forward EPS | Analyst Target Price – Low | Analyst Target Price – Mean | Analyst Target Price – High | # Analyst Opinions |
|---|---|---|---|---|---|---|---|---|---|---|---|---|---|---|---|
| AMBA | — | 62.8 | 7.1 | -46.1 | 7.8 | 5.2 | 3,159 | 2,894 | 2.11 | 1.5% | 1.1 | 80 | 95 | 120 | 11 |
| MRVL | 81.2 | 35.2 | 22 | 70.7 | 22.4 | 10.5 | 195,243 | 191,729 | 2.20 | 1.2% | 6.2 | 110 | 252.6 | 385 | 40 |
| ALAB | 244.6 | 84.1 | 60.8 | 261 | 62 | 41.5 | 62,058 | 60,916 | 3.67 | 0.4% | 4.3 | 155 | 281.6 | 460 | 22 |
| NVDA | 31.2 | 15.9 | 19.3 | 29.5 | 19.4 | 25.2 | 4,929,700 | 4,885,068 | 2.21 | 0.9% | 12.8 | 180 | 301.6 | 500 | 58 |
| ADI | 57.4 | 26.1 | 15.2 | 31.4 | 14.8 | 5.6 | 188,020 | 193,290 | 1.19 | 2.1% | 14.8 | 363 | 454 | 550 | 30 |
| ON | 66.4 | 20.9 | 6 | 17.7 | 5.8 | 4.8 | 35,171 | 36,278 | 2.01 | 3.6% | 4.3 | 85 | 113.5 | 150 | 25 |
Source: Yahoo Finance
AMBA trades at 7.1x EV/revenue and 7.8x price/sales, versus ON at 6.0x and 5.8x, ADI at 15.2x and 14.8x, MRVL at 22.0x and 22.4x, ALAB at 60.8x and 62.0x, and NVDA at 19.3x and 19.4x. On a growth-adjusted basis, that is not cheap enough for a business with negative operating margins, even though the stock has outperformed its weak earnings profile over the past year. A $1 investment a year ago would be worth $1.09 in AMBA, versus $3.01 in ALAB and MRVL, which tells me the market has already given AMBA some credit for a recovery that has not yet fully arrived in the income statement.
Profitability
| Company | Operating Margin (TTM) | Net Margin (TTM) | Return on Assets (TTM) | Return on Equity (TTM) | Gross Margin (TTM) | EBITDA Margin (TTM) |
|---|---|---|---|---|---|---|
| AMBA | -19.3% | -17.2% | -6.4% | -11.8% | 58.8% | -15.5% |
| MRVL | 14.5% | 29.0% | 3.8% | 16.0% | 51.5% | 31.1% |
| ALAB | 20.1% | 26.7% | 10.1% | 21.1% | 76.0% | 23.3% |
| NVDA | 65.6% | 63.0% | 52.7% | 114.3% | 74.2% | 65.3% |
| ADI | 38.1% | 26.0% | 5.5% | 9.6% | 64.5% | 48.3% |
| ON | 18.2% | 9.5% | 6.8% | 7.5% | 42.7% | 33.8% |
Source: Yahoo Finance
AMBA’s gross margin of 58.8% is respectable, but it trails ADI’s 64.5%, ALAB’s 76.0%, and NVDA’s 74.2%, and the bigger issue is that operating margin, EBITDA margin, and net margin are all negative. By contrast, every peer in this set is profitable on an operating basis, which means AMBA is still behind on the one metric that matters most for sustaining a premium multiple. I think that gap is the cleanest reason the stock should not be valued like a mature compounder yet.
Leverage
| Company | Total Debt/Equity % (mrq) | Current Ratio (mrq) | Total Debt (mrq, USD Mil) | Operating Cash Flow TTM (USD Mil) | Free Cash Flow TTM (USD Mil) | Net Debt/EBITDA (TTM) | FCF Margin % (TTM) |
|---|---|---|---|---|---|---|---|
| AMBA | 2.2 | 2.4 | 13.3 | 33.1 | 47.4 | 4.2 | 11.7% |
| MRVL | 29 | 3.3 | 5,277.2 | 2,056.4 | 2,269.7 | 0.5 | 26.0% |
| ALAB | 2.8 | 11.3 | 41.9 | 383.4 | 240 | -4.9 | 24.0% |
| NVDA | 6.6 | 3.4 | 12,814 | 125,648 | 46,335.9 | -0.2 | 18.3% |
| ADI | 25.8 | 1.8 | 8,708.7 | 5,106.5 | 3,868.9 | 0.9 | 30.4% |
| ON | 44.3 | 4.9 | 3,245.8 | 1,396.6 | 1,282.2 | 0.4 | 21.1% |
Source: Yahoo Finance
AMBA’s debt/equity ratio of 2.2% is far below MRVL’s 29.0%, ADI’s 25.8%, and ON’s 44.3%, but its net debt/EBITDA of 4.2x is worse than MRVL’s 0.5x, ADI’s 0.9x, NVDA’s -0.2x, and ON’s 0.4x. The reason is weak earnings power, not a large debt stack, so the balance sheet is not the main threat but it also is not a source of valuation support. In other words, the leverage profile does not offset the profitability gap; it just gives the company time to fix it.
Conclusion
I would put my rating as a Sell because the core tension is now clear: Ambarella has enough growth and liquidity to keep investing, but not enough operating leverage to justify a 7.1x EV/revenue multiple with confidence. The numbers do not yet show the moat translating into durable earnings power, and that is the issue I care about most.
I would raise my rating more toward a Hold if quarterly revenue stays above $100M for two more quarters and operating margin moves into positive territory, because that would show the AI ramp is broadening and the fixed-cost base is finally being absorbed. I would also become more constructive if operating cash flow moves toward $60M–$70M on a trailing basis, since that would pull net debt/EBITDA down materially and make the equity case less dependent on multiple expansion.
The bear case is straightforward as well: if quarterly revenue slips back below $90M or gross margin falls under 58%, I would move further toward a Sell because that would tell me the mix shift is not offsetting manufacturing cost pressure. In that scenario, the path to positive operating margin gets longer, and the current valuation would look increasingly disconnected from the earnings base.
For now, I think the balance sheet buys time, but not enough proof. I want to see the next phase of revenue growth convert into operating leverage before I would argue the stock deserves a better rating.
What’s your take? I rated Ambarella (AMBA) SELL above — but the goal here is to get this right, not just to publish an opinion. What would you add to this analysis, or which risk or catalyst do you think I’m under- or over-weighting? Tell me in the comments.
Sources
- SEC 10-K Annual Report — filed 2026-03-23
- SEC 8-K Filing (2026-05-28)
- SEC 8-K Filing (2026-02-27)
- SEC 8-K Filing (2026-02-26)
- SEC Form 4 Insider Transaction (2026-05-28)
- SEC Form 4 Insider Transaction (2026-05-28)
- SEC Form 4 Insider Transaction (2026-04-22)
- SEC 10-K Annual Report — FY2026
- SEC 10-K Annual Report — FY2025
- SEC 10-K Annual Report — FY2024
- SEC 10-K Annual Report — FY2023
- SEC 10-K Annual Report — FY2022
Data sourced from Yahoo Finance and SEC EDGAR. Not investment advice.
Leave a Comment