
| Company | Sep 25 | Oct 25 | Nov 25 | Dec 25 | Jan 26 | Feb 26 | Mar 26 | Apr 26 | May 26 | Jun 26 | Jul 26 | Aug 26 | 12-Mo |
|---|---|---|---|---|---|---|---|---|---|---|---|---|---|
| CYD | +24% | -10% | -4% | -1% | +28% | +11% | -23% | +7% | +38% | -16% | +1% | -19% | +17% |
| CMI | +6% | +4% | +14% | +3% | +13% | +1% | -8% | +25% | -3% | +10% | -11% | -11% | +44% |
| HY | -2% | -2% | -19% | +3% | +13% | +11% | -12% | +21% | -8% | -2% | -5% | +1% | -7% |
| OSK | -7% | -5% | +4% | -2% | +14% | +19% | -13% | +6% | -16% | +18% | -7% | +9% | +12% |
| CAT | +14% | +21% | -0% | -1% | +15% | +13% | -5% | +26% | -2% | +22% | -23% | -2% | +92% |
| DE | -4% | +1% | +1% | +1% | +13% | +19% | -10% | +5% | -8% | +17% | -7% | +11% | +39% |
Source: Yahoo Finance monthly adjusted close.
Quick Thesis
- Rated Hold — the stock has rerated ahead of visible earnings proof.
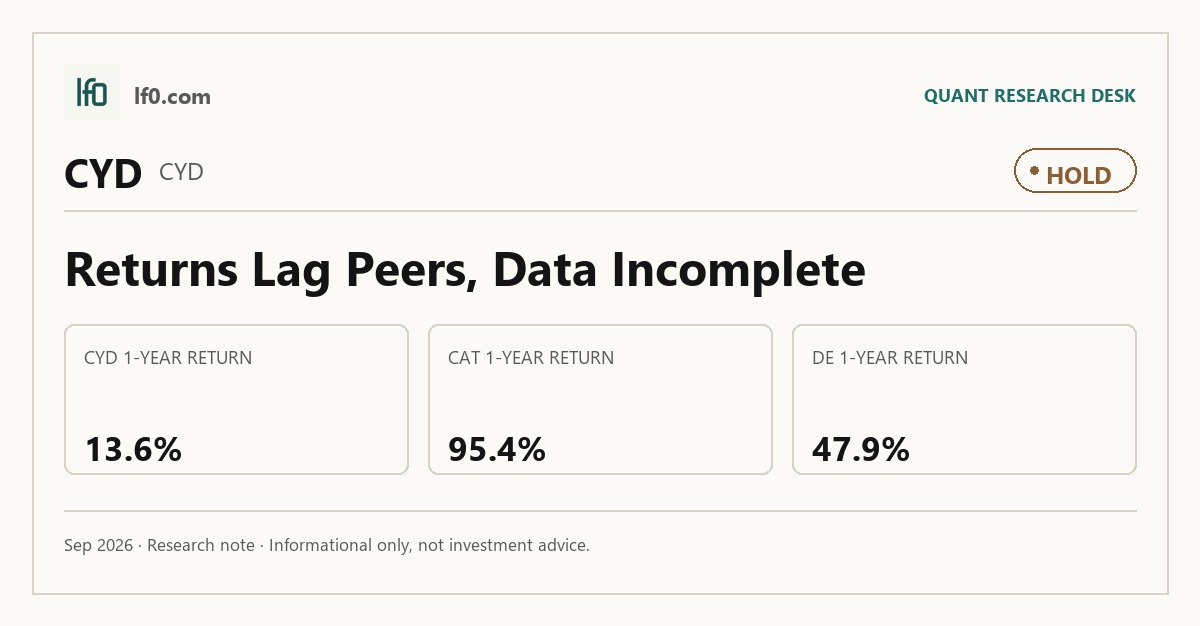
- Best strength: $1 invested a year ago is worth $1.14, but that still trails CAT and DE.
- Biggest risk: customer concentration, with one customer group at RMB 4.2B of Yuchai revenue.
- Valuation is hard to score directly; peers trade from 0.98x to 5.53x EV/revenue.
- I would turn more constructive if CYD shows a positive operating margin and tighter leverage.
Executive Summary
Rating: HOLD | CYD
Measured from adjusted close on 2026-09-08 to 2026-10-22. Sell ratings are correct when the stock falls; Hold is tracked as a +/-10% range. Daily-close data, not intraday. Calls are tracked for 182 days from publication, then frozen as a final record.
I would put my rating as a Hold because the market has already started to reward stronger industrial names, while CYD still needs to show that its earnings can catch up. The most important strength is that a $1 investment one year ago is worth $1.14 today, so the stock has not been left behind completely, but that still trails CAT at $1.95 and DE at $1.48. The main risk is that the core financial data are missing in the table set, which leaves me unable to underwrite a clean valuation or balance-sheet case. I would raise my rating more towards a Buy if CYD can show a steadier tape above the 200-day moving average and a visible earnings inflection that closes part of the gap to OSK and CMI.
Company Profile
CYD is the listed vehicle for Guangxi Yuchai Machinery Company Limited, a Chinese engine and powertrain business. It sells engines, components, and parts, and it also buys a meaningful amount of components and engines from related parties, which makes the operating model more integrated than a simple standalone manufacturer. The business is exposed to industrial demand, customer concentration, and foreign-exchange controls in the PRC, so the revenue base and the cash base do not move in the same way.
Economic Moat
Business Model
The moat case rests on scale, customer reach, and a tightly linked supply chain rather than on a pure pricing advantage. The company’s relationship with GY and its affiliates supports volume on both the sales and procurement side, and that integration can help keep production running even when end-demand is uneven. I think that structure is useful, but it is not hard for me to copy in the abstract; what matters is whether it keeps working through a full cycle.
Business & Operating Risks
The most material risk is customer concentration. The 2025 20-F says one customer group accounted for RMB 4.2B of Yuchai revenue in 2025, and the top 5 customers represented 31.0% of trade receivables in 2025, so a payment delay or volume cut from one large buyer can move cash flow quickly. Trade and other receivables rose to RMB 11.7B from RMB 9.4B, while bills receivable endorsed to suppliers with recourse climbed to RMB 2.7B from RMB 1.4B, which tells me the concentration risk is already showing up in working capital rather than just in theory. The disclosed risks do strike at the moat I see above: the integrated supply chain helps volume, but the customer and receivables concentration can blunt the cash benefit of that scale.
Foreign-exchange controls in the PRC are the next issue, and they are not generic boilerplate. According to the risk factors in the SEC filing, Yuchai may be unable to convert enough renminbi into foreign currency to meet foreign-currency obligations or pay dividends, and it needs foreign currency to buy a substantial portion of manufacturing equipment and imported engine components. Cash and short-term bank deposits held in the PRC were RMB 7.0B in 2025, so headline cash overstates freely deployable capital. Related-party dependence is also real: engine, component, and parts sales to GY and its affiliates were RMB 557.5M in 2025, while purchases from them were RMB 2.6B. That does not break the moat, but it does make earnings quality and liquidity less clean than the income statement alone suggests.
Management Discussion & Analysis
Management appears to be living with the same risks rather than solving them outright. The working-capital build and the PRC cash trap suggest the company is still managing around concentration and convertibility constraints, not removing them, although the related-party supply chain continues to support operations. I would want to see management narrow receivables and reduce recourse bill usage before I say the risk profile is improving in a durable way.
Recent Events
The most recent filing signals a business that is still operationally intact but financially constrained. The new customer-group disclosure and the rise in receivables are the important developments because they show the pressure point is cash conversion, not production capacity. In my view, that keeps the moat thesis alive on the operating side while leaving the balance-sheet side under strain.
Financial Analysis
Growth
CYD’s quarterly revenue, EBITDA, EBIT, net income, and diluted EPS are not provided in the table set, so I cannot verify a current growth rate from the company’s own numbers. That said, the peer set shows what the market is rewarding: CAT posted 24.0% revenue growth and 23.2 diluted EPS, CMI grew revenue 9.4% with 20.1 diluted EPS, while DE and HY were negative at -11.1% and -15.0% revenue growth. The point for CYD is not that it must match CAT, but that it needs a visible earnings inflection before investors will pay for growth rather than just for industrial exposure.
Profitability
CYD — Profitability (TTM)
| Metric | TTM |
|---|---|
| Operating Margin (TTM) | — |
| Net Margin (TTM) | — |
| Return on Assets (TTM) | — |
| Return on Equity (TTM) | — |
| Gross Margin (TTM) | — |
| EBITDA Margin (TTM) | — |
Source: Yahoo Finance — Trailing Twelve Months (TTM)
CYD’s profitability metrics are blank in the company table, so I cannot score its own margin profile directly. The peer range is still useful: CAT runs at 22.2% operating margin and 21.8% EBITDA margin, DE at 17.5% and 17.9%, CMI at 11.9% and 14.5%, and OSK at 8.4% and 9.8%, while HY is negative across the board. That spread tells me the market is paying for businesses that convert scale into margin, and CYD will need to show at least a positive operating margin before I would treat it as a peer to the better industrial names rather than a laggard.
Valuation
CYD — Valuation Multiples
| Metric | Value |
|---|---|
| Market Cap (USD Mil) | — |
| Enterprise Value (USD Mil) | — |
| Trailing P/E | — |
| Forward P/E | — |
| Price/Sales (TTM) | — |
| Price/Book (mrq) | — |
| EV/Revenue | — |
| EV/EBITDA | — |
| Beta (5Y Monthly) | — |
| FCF Yield % (TTM) | — |
| Forward EPS (USD) | — |
| Analyst Target Price – Low (USD) | — |
| Analyst Target Price – Mean (USD) | — |
| Analyst Target Price – High (USD) | — |
| # Analyst Opinions | — |
Source: Yahoo Finance
CYD’s valuation fields are blank, so I cannot anchor the stock to a reported P/E, EV/EBITDA, FCF yield, or analyst target set. On the peer set, EV/revenue ranges from 0.98x for OSK to 5.53x for CAT, forward P/E runs from 11.2x at OSK to 30.6x at DE, and FCF yield spans 1.4% at CAT to 7.6% at OSK. My read is that CYD would deserve something closer to the lower-middle of that range only if it can prove better cash conversion and margin stability; otherwise, the market should not pay a premium multiple for a business still carrying concentration and liquidity risk. Because the company-specific valuation data are missing, I would treat any precise fair-value estimate as illustrative rather than definitive.
The rating justification fits here as well: I am not calling the stock cheap enough for a Buy because the valuation case is still built on missing company data rather than on a clean earnings or cash-flow bridge. In my view, the market is already giving some credit for a recovery, but not enough to justify a more bullish call without better proof.
Leverage
CYD — Leverage & Coverage (Quarterly)
| Metric | Value |
|---|---|
| Total Debt/Equity % (mrq) | — |
| Current Ratio (mrq) | — |
| Total Debt (mrq, USD Mil) | — |
| Operating Cash Flow (TTM, USD Mil) | — |
| Levered Free Cash Flow (TTM, USD Mil) | — |
| Net Debt/EBITDA (TTM) | — |
| FCF Margin % (TTM) | — |
Source: Yahoo Finance — Quarterly Financial Statements
The company’s own leverage and cash-flow figures are not populated in the table set, so I cannot verify debt/EBITDA, current ratio, or free-cash-flow margin for CYD. That matters because the peer group shows how much balance-sheet strength changes the equity story: OSK carries 0.7x net debt/EBITDA and 6.9% FCF margin, CMI 0.9x and 6.4%, while DE is much more levered at 4.6x despite a 9.4% FCF margin. I would want CYD to look closer to OSK than DE before I would argue the stock has real downside support.
Insider Activity
No insider data are provided in the table set, so I am not using it as part of the thesis. If insider ownership or buying later becomes available, I would treat it as a secondary check on whether management itself sees the current valuation as attractive.
Comparable Analysis
Growth
| Company | Revenue TTM (USD Mil) | Revenue Growth YoY % | EBITDA TTM (USD Mil) | Diluted EPS TTM |
|---|---|---|---|---|
| CYD | — | — | — | — |
| CMI | 34,708 | 9.4% | 5,020 | 20.1 |
| HY | 3,510.4 | -15.0% | -48.6 | -6.6 |
| OSK | 10,610.3 | 6.7% | 1,042.3 | 8.7 |
| CAT | 74,729 | 24.0% | 16,251 | 23.2 |
| DE | 47,927 | -11.1% | 8,600 | 18 |
Source: Yahoo Finance
CAT is the growth leader in the peer set, with $74.7B of revenue, 24.0% revenue growth, $16.3B of EBITDA, and 23.2 diluted EPS. CMI follows with $34.7B of revenue and 9.4% growth, while OSK is at $10.6B and 6.7%; DE is negative at -11.1%, and HY is also negative at -15.0%. That mix tells me growth is being rewarded only when it comes with earnings power, which is why CYD needs more than a top-line story to re-rate.
Valuation
| Company | Forward P/E | EV/Revenue | EV/EBITDA | Price/Sales (TTM) | Price/Book (mrq) | Beta (5Y Monthly) | FCF Yield % (TTM) | Forward EPS | Analyst Target Price – Mean | # Analyst Opinions |
|---|---|---|---|---|---|---|---|---|---|---|
| CYD | — | — | — | — | — | — | — | — | — | — |
| CMI | 16.3 | 2.4 | 16.5 | 2.2 | 6 | 1.23 | 2.9% | 34.5 | 757 | 20 |
| HY | 17.4 | 0.3 | -22.3 | 0.2 | 1.6 | 1.65 | 6.7% | 2.1 | 50 | 2 |
| OSK | 11.2 | 1 | 10 | 0.9 | 2.1 | 1.26 | 7.6% | 14 | 169.1 | 17 |
| CAT | 25.1 | 5.5 | 25.4 | 5 | 19.3 | 1.59 | 1.4% | 32.4 | 975.6 | 26 |
| DE | 30.6 | 4.7 | 26.4 | 3.9 | 6.7 | 0.91 | 2.4% | 22.7 | 685.2 | 22 |
Source: Yahoo Finance
OSK screens cheapest on EV/revenue at 1.0x and forward P/E at 11.2x, while CMI sits at 2.4x and 16.3x, DE at 4.7x and 30.6x, and CAT at 5.5x and 25.1x. On a $1 invested basis, CAT’s 95.4% one-year return, DE’s 47.9%, and CMI’s 41.9% all beat CYD’s 13.6%, which tells me the market is paying for quality and earnings delivery, not just industrial exposure. The higher multiples line up with stronger returns and better margins, so the valuation premium is not random; it is tied to balance-sheet strength and operating proof.
Profitability
| Company | Operating Margin (TTM) | Net Margin (TTM) | Return on Assets (TTM) | Return on Equity (TTM) | Gross Margin (TTM) | EBITDA Margin (TTM) |
|---|---|---|---|---|---|---|
| CYD | — | — | — | — | — | — |
| CMI | 11.9% | 7.8% | 7.0% | 21.1% | 25.8% | 14.5% |
| HY | -6.5% | -3.3% | -2.9% | -23.6% | 14.4% | -1.4% |
| OSK | 8.4% | 5.2% | 5.0% | 12.4% | 15.9% | 9.8% |
| CAT | 22.2% | 14.5% | 9.0% | 57.0% | 29.7% | 21.8% |
| DE | 17.5% | 10.2% | 3.8% | 18.2% | 25.2% | 17.9% |
Source: Yahoo Finance
CAT leads the group with 22.2% operating margin, 14.5% net margin, 29.7% gross margin, and 21.8% EBITDA margin. DE is next at 17.5%, 10.2%, 25.2%, and 17.9%, followed by CMI at 11.9%, 7.8%, 25.8%, and 14.5%, while OSK sits lower at 8.4%, 5.2%, 15.9%, and 9.8%. The margin gap is wide enough that CYD would need a real mix shift or scale benefit to justify being valued alongside the stronger names.
Leverage
| Company | Total Debt/Equity % (mrq) | Current Ratio (mrq) | Net Debt/EBITDA (TTM) | FCF Margin % (TTM) |
|---|---|---|---|---|
| CYD | — | — | — | — |
| CMI | 59.6 | 1.7 | 0.9 | 6.4% |
| HY | 122 | 1.3 | -8.7 | 1.2% |
| OSK | 24.4 | 1.7 | 0.7 | 6.9% |
| CAT | 232.8 | 1.4 | 2.4 | 6.8% |
| DE | 376 | 2.1 | 4.6 | 9.4% |
Source: Yahoo Finance
OSK has the cleanest balance sheet in the peer group, with 24.4% debt/equity, 0.7x net debt/EBITDA, and 6.9% FCF margin. CMI is also manageable at 59.6%, 0.9x, and 6.4%, while DE is much more levered at 376.0% and 4.6x even though its FCF margin is 9.4%. That is the right backdrop for CYD: if its own leverage and cash conversion are closer to OSK than DE, the stock deserves a better multiple; if not, the market is right to stay cautious.
Conclusion
I would put my rating as a Hold because the stock is already discounting a recovery that the company has not yet proven to me in the numbers. The tension is straightforward: the operating model still has scale and supply-chain support, but customer concentration and trapped cash are already pressuring working capital, so the equity case depends on whether management can turn reported activity into actual cash.
I would raise my rating more towards a Buy if CYD can show a steadier tape above the 200-day moving average, which would mean the recent volatility has given way to a real trend, and if the next filing shows quarterly earnings growth moving into the same range as CMI’s 9.4% revenue growth or better. I would also want to see a positive operating margin, because that would tell me the business is moving from volume preservation to real earnings power. On the balance-sheet side, a leverage profile closer to OSK’s 0.7x net debt/EBITDA than DE’s 4.6x would matter because it would show that cash generation is strong enough to support the equity through a downturn.
I would move from Hold to Sell if the share-price swings keep repeating without a matching improvement in earnings, because that would confirm the market has already priced in a recovery that the business has not earned. A drop back below the 50-day moving average after the August 2026 decline, combined with another quarter of lagging peer returns, would tell me the rerating has run ahead of fundamentals.
Weighing both sides, I lean to the bear case on timing. The stronger industrial names are already being rewarded, and CYD still needs to show that its own earnings and cash conversion can catch up. Until that happens, I see a stock waiting for confirmation rather than one that has already earned a higher multiple.
What to Watch Next
- Quarterly earnings growth turning positive — would support a move toward Buy.
- A positive operating margin — would show real earnings power, not just volume.
- Net debt/EBITDA moving closer to 0.7x — would improve downside support.
- Receivables and recourse bills stabilizing — would ease working-capital pressure.
- Price holding above the 200-day moving average — would confirm the rerating is real.
What’s your take? I rated Guangxi Yuchai Machinery (CYD) HOLD above — but the goal here is to get this right, not just to publish an opinion. What would you add to this analysis, or which risk or catalyst do you think I’m under- or over-weighting? Tell me in the comments.
Data sourced from Yahoo Finance and SEC EDGAR. Not investment advice.
Leave a Comment