
| Company | Aug 25 | Sep 25 | Oct 25 | Nov 25 | Dec 25 | Jan 26 | Feb 26 | Mar 26 | Apr 26 | May 26 | Jun 26 | Jul 26 | 12-Mo |
|---|---|---|---|---|---|---|---|---|---|---|---|---|---|
| VRRM | -2% | -1% | -6% | -6% | +3% | -14% | -13% | -14% | +4% | -70% | -6% | +24% | -79% |
| AXON | -1% | -4% | +2% | -26% | +5% | -15% | +12% | -22% | -5% | +12% | +25% | -6% | -30% |
| CPRT | +8% | -8% | -4% | -9% | +0% | +4% | -6% | -13% | -0% | -1% | -14% | +3% | -36% |
| GEO | -20% | -1% | -17% | -7% | +2% | -1% | -6% | +12% | +10% | +22% | +30% | +5% | +19% |
| RBA | +6% | -5% | -8% | -1% | +5% | +10% | -11% | -5% | +9% | +2% | +9% | -6% | +2% |
| CAR | -7% | +1% | -15% | -0% | -6% | -10% | -15% | +50% | +24% | -3% | -16% | -7% | -19% |
Source: Yahoo Finance monthly adjusted close.
Quick Thesis
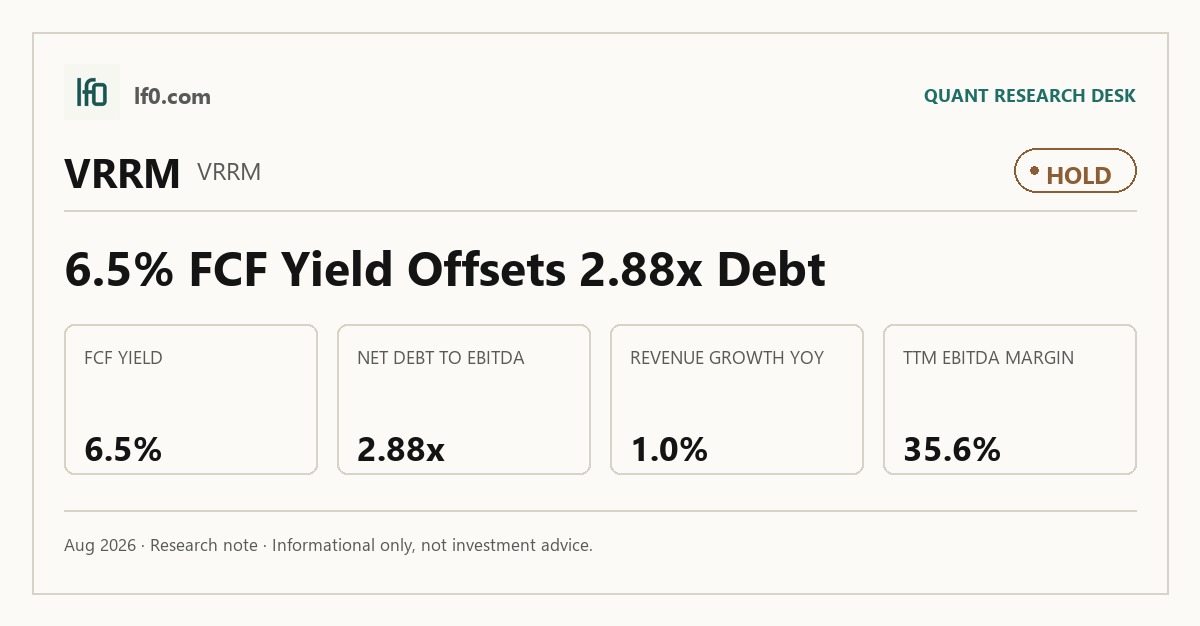
- Rated hold — cash generation is solid, but Q2 2026 earnings weakened sharply.
- TTM EBITDA margin was 35.5%, supporting the moat and the valuation.
- Q2 2026 net income was -$48.2M, highlighting contract and execution risk.
- Valuation is modest at 4.7x EV/EBITDA and 6.5% FCF yield.
- I would turn more constructive if EBITDA margin holds near 35.5% and revenue stabilizes.
Executive Summary
Rating: HOLD | VRRM
Measured from adjusted close on 2026-08-31 to 2026-10-14. Sell ratings are correct when the stock falls; Hold is tracked as a +/-10% range. Daily-close data, not intraday. Calls are tracked for 182 days from publication, then frozen as a final record.
I would put my rating as a Hold because Verra Mobility still generates a 6.5% free cash flow yield and trades at 4.7x EV/EBITDA, but the latest quarter showed a sharp earnings break with Q2 2026 EBIT of -$26.7M and net income of -$48.2M. In my view, that is the key tension: the business has enough recurring cash flow to support the stock, yet the recent quarter shows how quickly contract churn and operating leverage can pressure reported earnings. The $998M NYCDOT renewal helps visibility, but the tighter service terms and the Avis Budget termination show that the franchise is not insulated from customer pushback. I would raise my rating more towards a Buy if EBITDA margin holds near 35.5% and revenue stops slipping, because that would tell me the contract base is stabilizing rather than merely rolling over.
Company Profile
Verra Mobility provides tolling, violation processing, and commercial services that help fleets, municipalities, and drivers manage transportation-related payments and compliance. The company earns revenue from recurring service contracts and transaction activity, which gives it a steadier profile than a pure project-based vendor. That mix matters because the business can scale without needing a large asset base, but it also leaves the company exposed when a large customer or contract changes terms.
Economic Moat
Business Model
I think Verra Mobility’s structural edge comes from embedded workflow and contract relationships rather than from a hard asset base. The NYCDOT renewal is a good example: a five-year base term with a five-year extension option gives the company a long revenue runway, and the contract’s scale supports visibility. The moat is not just the headline size, though. Service-level agreements, service credits, liquidated damages, cybersecurity, and subcontracting requirements make the relationship harder to displace quickly, which is why I view the contract as more durable than a simple one-off win.
Business & Operating Risks
The main disclosed risk is customer concentration, and the Avis Budget termination shows that risk is real rather than theoretical. Avis Budget represented more than 10% of revenue in the three months ended March 31, 2026 and in FY2025, so losing that account directly pressures the commercial services base. The tighter NYCDOT terms do not break the moat, but they do show that Verra Mobility’s embedded position can be negotiated harder by large customers.
Management Discussion & Analysis
Management is responding to those risks, but not all of them are solved. The refinancing pushed the senior secured term loan maturity to October 15, 2032 and lowered the rate by 25 basis points, while the amended revolver now matures on October 17, 2030 with $146.3M available net of letters of credit as of December 31, 2025. That is a sensible response to balance-sheet risk, and the $250.0M share repurchase authorization shows confidence in cash generation, but the buyback posture also tells me management is still prioritizing equity returns over faster deleveraging. The company is addressing financing risk, yet the Avis Budget loss remains unresolved as of the filing date.
Recent Events
The June 5, 2026 Board Transformation Committee is the clearest sign that the board wants a broader reset in cost structure, growth, capital allocation, portfolio mix, financing, and capital spending. I read that as a constructive but also cautionary signal: the board is not just fine-tuning, it is asking whether the current operating model is the right one. The leadership change on May 31, 2026, when Jonathan Keyser became interim CEO after David Roberts exited, reinforces that message. Retention packages for Keyser and CFO Craig Conti help preserve continuity, but they also confirm that the company is still searching for the right operating leader.
Financial Analysis
Growth
VRRM — Financial Growth (Quarterly, USD Mil)
| Metric | 2025-06-30 | 2025-09-30 | 2025-12-31 | 2026-03-31 | 2026-06-30 |
|---|---|---|---|---|---|
| REVENUE (USD Mil) | 236 | 261.9 | 257.9 | 223.6 | 263.6 |
| EBIT (USD Mil) | 69.2 | 81.1 | 47.9 | 55.9 | -26.7 |
| EBITDA (USD Mil) | 98.6 | 110.3 | 77.6 | 85.2 | 2.4 |
| NET INCOME (USD Mil) | 38.6 | 46.8 | 18.9 | 26.7 | -48.2 |
| DILUTED EPS | 0.2 | 0.3 | 0.1 | 0.2 | -0.3 |
Source: Yahoo Finance — Quarterly Financial Statements
Revenue rose to $263.6M in Q2 2026 from $223.6M in Q1 2026, but the more important comparison is year over year: Q2 2026 revenue was up just 1.0%, which tells me growth is positive but not strong enough to carry the thesis on its own. EBITDA fell to $2.4M in Q2 2026 from $85.2M in Q1 2026, and that swing is too large to ignore because it shows how quickly earnings can compress when contract mix or timing moves against the company. I do not see a clean explanation for that drop in the figures provided, so I would want more disclosure before reading too much into it.
Profitability
VRRM — Profitability (TTM)
| Metric | TTM |
|---|---|
| Operating Margin (TTM) | 27.2% |
| Net Margin (TTM) | 4.4% |
| Return on Assets (TTM) | 9.2% |
| Return on Equity (TTM) | 15.4% |
| Gross Margin (TTM) | 55.7% |
| EBITDA Margin (TTM) | 35.5% |
Source: Yahoo Finance — Trailing Twelve Months (TTM)
TTM gross margin was 55.7%, EBITDA margin was 35.5%, operating margin was 27.2%, and net margin was 4.4%. The spread between EBITDA margin and net margin is wide, which tells me depreciation, amortization, interest, and taxes still take a meaningful bite out of reported earnings. ROA was 9.2% and ROE was 15.4%, so the business is producing respectable returns, but the equity return is still helped by leverage rather than by pure operating efficiency alone. That combination fits the moat: the model can produce good margins, yet the recent quarter shows those margins are not immune to contract pressure.
Valuation
VRRM — Valuation Multiples
| Metric | Value |
|---|---|
| Market Cap (USD Mil) | 667 |
| Enterprise Value (USD Mil) | 1,698 |
| Trailing P/E | 16.3 |
| Forward P/E | 4.6 |
| Price/Sales (TTM) | 0.7 |
| Price/Book (mrq) | 3 |
| EV/Revenue | 1.7 |
| EV/EBITDA | 4.7 |
| Beta (5Y Monthly) | 0.41 |
| FCF Yield % (TTM) | 6.5% |
| Forward EPS (USD) | 0.9 |
| Analyst Target Price – Low (USD) | 5 |
| Analyst Target Price – Mean (USD) | 7 |
| Analyst Target Price – High (USD) | 10 |
| # Analyst Opinions | 6 |
Source: Yahoo Finance
Verra Mobility trades at 4.7x EV/EBITDA, 1.7x EV/revenue, 0.7x price/sales, and 16.3x trailing P/E, with a 6.5% FCF yield and a forward P/E of 4.6x. On my read, that is not expensive for a business with a 35.5% EBITDA margin and recurring contract exposure, but it is also not a deep-value setup because the latest quarter showed earnings volatility. I would put fair value in a range of roughly $4–$11 per share based on the peer multiple work and the company’s cash conversion profile. That range sits broadly around the $5–$10 analyst target band from six opinions, so the consensus is not far from where I land, though I weight the recent earnings swing more heavily than the average target appears to. Forward EPS is 0.9, which is modest relative to peers with stronger growth and cleaner earnings quality, so the stock looks cheaper on a multiple basis than on an earnings-quality basis.
Leverage
VRRM — Leverage & Coverage (Quarterly)
| Metric | Value |
|---|---|
| Total Debt/Equity % (mrq) | 486.4 |
| Current Ratio (mrq) | 2.1 |
| Total Debt (mrq, USD Mil) | 1,087.7 |
| Net Debt/EBITDA (TTM) | 2.9 |
| FCF Margin % (TTM) | 4.3% |
Source: Yahoo Finance — Quarterly Financial Statements
Total debt/equity was 486.4%, total debt was $1.1B, and net debt/EBITDA was 2.9x, so leverage is meaningful even if it is not distressed. The current ratio of 2.1 gives the company enough short-term liquidity to absorb a softer quarter, and operating cash flow of $214.9M plus levered free cash flow of $43.3M show that the balance sheet is still supported by cash generation. I would not call this a balance-sheet problem today, but the leverage profile means the equity has less room for execution error than the margin profile alone might suggest.
Insider Activity
Insider activity has been one-sided. The record shows four open-market sales and no open-market purchases, with $862,175 of selling over the 2025-03-01 to 2026-05-18 window. Two insiders did the selling, so this is not broad distribution, but I still read it as a negative signal because there is no offsetting buying to show conviction at current levels.
Comparable Analysis
Growth
| Company | Revenue TTM (USD Mil) | Revenue Growth YoY % | Diluted EPS TTM |
|---|---|---|---|
| VRRM | 1,007 | 11.7% | 0.3 |
| AXON | 3,219.1 | 35.3% | 2.4 |
| CPRT | 4,638.9 | 2.1% | 1.6 |
| GEO | 2,827.3 | 15.1% | 2.1 |
| RBA | 4,847.8 | 11.1% | 2.3 |
| CAR | 11,711 | -1.3% | -18 |
Source: Yahoo Finance
Verra Mobility’s 11.7% TTM revenue growth is ahead of CPRT at 2.1% and CAR at -1.3%, but behind AXON at 35.3% and GEO at 15.1%. RBA is close at 11.1%, which tells me VRRM is not the fastest grower in the group, but it is growing at a respectable mid-teens pace that can support a reasonable multiple if the trend holds.
Valuation
| Company | Trailing P/E | Forward P/E | EV/Revenue | EV/EBITDA | Price/Sales (TTM) | Price/Book (mrq) | Market Cap (USD Mil) | Enterprise Value (USD Mil) | Beta (5Y Monthly) | FCF Yield % (TTM) | Forward EPS | Analyst Target Price – Low | Analyst Target Price – Mean | Analyst Target Price – High | # Analyst Opinions |
|---|---|---|---|---|---|---|---|---|---|---|---|---|---|---|---|
| VRRM | 16.3 | 4.6 | 1.7 | 4.7 | 0.7 | 3 | 667 | 1,698 | 0.41 | 6.5% | 0.9 | 5 | 7 | 10 | 6 |
| AXON | 252.4 | 56.9 | 15.5 | 302.6 | 15.2 | 13.3 | 48,802 | 49,960 | 1.40 | 0.5% | 10.6 | 409.7 | 693.4 | 830 | 19 |
| CPRT | 20.4 | 19.7 | 5.7 | 13.5 | 6.6 | 3.5 | 30,543 | 26,453 | 1.01 | 3.3% | 1.7 | 25 | 40.2 | 55 | 10 |
| GEO | 15.4 | 18.9 | 2 | 11.7 | 1.5 | 2.9 | 4,249 | 5,720 | 0.78 | -0.1% | 1.7 | 31 | 37.8 | 40 | 4 |
| RBA | 37.1 | 17.7 | 4.2 | 15.6 | 3.3 | 2.9 | 15,938 | 20,591 | 0.55 | 3.8% | 4.9 | 104 | 128.9 | 152 | 11 |
| CAR | — | 22.8 | 2.9 | 21.8 | 0.4 | -1.4 | 4,879 | 33,607 | 1.90 | 22.4% | 6 | 94 | 129.1 | 160 | 7 |
Source: Yahoo Finance
VRRM’s 4.7x EV/EBITDA is well below AXON’s 302.6x, CPRT’s 13.5x, GEO’s 11.7x, RBA’s 15.6x, and CAR’s 21.8x, while its 6.5% FCF yield is stronger than AXON’s 0.5%, CPRT’s 3.3%, GEO’s -0.1%, and RBA’s 3.8%. The one exception is CAR’s 22.4% FCF yield, but CAR also carries 18.6x net debt/EBITDA, so that yield comes with a much riskier balance sheet. On a growth-adjusted basis, VRRM looks reasonably priced rather than cheap: its valuation is supported by cash conversion, but the market is not paying a premium for growth.
Profitability
| Company | Operating Margin (TTM) | Net Margin (TTM) | Return on Assets (TTM) | Return on Equity (TTM) | Gross Margin (TTM) | EBITDA Margin (TTM) |
|---|---|---|---|---|---|---|
| VRRM | 27.2% | 4.4% | 9.2% | 15.4% | 55.7% | 35.5% |
| AXON | 5.2% | 6.2% | 0.5% | 6.2% | 59.5% | 5.1% |
| CPRT | 37.5% | 33.5% | 11.3% | 17.6% | 47.5% | 42.3% |
| GEO | 13.9% | 10.3% | 6.0% | 20.1% | 26.0% | 17.3% |
| RBA | 17.7% | 10.0% | 4.1% | 8.1% | 45.8% | 27.3% |
| CAR | 14.9% | -5.4% | 2.7% | — | 27.4% | 13.1% |
Source: Yahoo Finance
VRRM’s 27.2% operating margin and 35.5% EBITDA margin compare well with GEO at 13.9% and 17.3%, RBA at 17.7% and 27.3%, and CAR at 14.9% and 13.1%. CPRT is the standout on profitability at 37.5% operating margin and 42.3% EBITDA margin, so VRRM is strong but not best in class. That matters because the margin profile supports the moat thesis, yet it also shows why the stock should not be valued like a top-tier compounder.
Leverage
| Company | Total Debt/Equity % (mrq) | Current Ratio (mrq) | Total Debt (mrq, USD Mil) | Operating Cash Flow TTM (USD Mil) | Free Cash Flow TTM (USD Mil) | Net Debt/EBITDA (TTM) | FCF Margin % (TTM) |
|---|---|---|---|---|---|---|---|
| VRRM | 486.4 | 2.1 | 1,087.7 | 214.9 | 43.3 | 2.9 | 4.3% |
| AXON | 50.4 | 2.1 | 1,850.6 | 265.8 | 222.2 | 7 | 6.9% |
| CPRT | 1.1 | 7.6 | 93.1 | 1,685.4 | 1,000 | -2.1 | 21.6% |
| GEO | 106.1 | 1.7 | 1,607.2 | 198.7 | -3.6 | 3.2 | -0.1% |
| RBA | 77.6 | 1.3 | 4,695.5 | 860.7 | 603.6 | 3.2 | 12.4% |
| CAR | — | 0.8 | 29,125 | 2,906 | 1,093.1 | 18.6 | 9.3% |
Source: Yahoo Finance
VRRM’s 486.4% debt/equity is high versus AXON at 50.4%, GEO at 106.1%, and RBA at 77.6%, but its 2.9x net debt/EBITDA is far more manageable than CAR’s 18.6x and is close to GEO’s 3.2x and RBA’s 3.2x. The 2.1 current ratio also compares favorably with GEO’s 1.7 and RBA’s 1.3, which tells me VRRM’s leverage is a financing choice, not a distress setup. That balance-sheet profile helps explain why the stock can trade at a lower EV/EBITDA multiple than the faster growers: investors are paying for cash generation, but they are also discounting the leverage.
Conclusion
I would put my rating as a Hold because the stock’s 6.5% FCF yield and 4.7x EV/EBITDA are backed by a 35.5% EBITDA margin, yet the latest quarter showed only 1.0% revenue growth and a sharp drop in EBIT to -$26.7M. The key question is whether the contract base can absorb the Avis Budget loss without dragging margins lower, because if it can, the current valuation still leaves room for upside; if it cannot, the leverage profile will matter much more than it does today.
I would raise my rating more towards a Buy if revenue growth holds at least in the low single digits for two straight quarters and EBITDA margin stays near 35.5%, meaning the company keeps converting revenue into cash at roughly the current rate. That would tell me the NYCDOT renewal and tolling activity are offsetting the customer loss, and it would make the current free cash flow yield look durable rather than temporary. I would also become more constructive if net debt/EBITDA moves below 2.5x, because that would show the balance sheet is becoming less of a constraint on equity value.
I would move from Hold to Sell if revenue turns negative for a full quarter or if net debt/EBITDA rises above 3.5x, which would mean the company is losing the cushion that currently supports the valuation. Free cash flow falling back toward breakeven would be another warning sign, because the present 4.3% FCF margin is one of the few things keeping the stock from looking like a levered, low-growth services name.
Weighing the two sides, I think the cash generation is real, but the burden of proof now sits on management to show that the recent contract changes and leadership reset translate into cleaner earnings. Until I see that in the next quarter or two, I think the stock is more likely to grind than to rerate sharply.
What to Watch Next
- Q3 2026 revenue growth above 1% — would support a move toward Buy.
- EBITDA margin near 35.5% — would show the contract base is still converting to cash.
- Net debt/EBITDA below 2.5x — would reduce balance-sheet pressure.
- Free cash flow staying above breakeven — would confirm the current yield is durable.
- Any further large customer loss — would raise concentration risk and keep the rating at Hold.
What’s your take? I rated Verra Mobility (VRRM) HOLD above — but the goal here is to get this right, not just to publish an opinion. What would you add to this analysis, or which risk or catalyst do you think I’m under- or over-weighting? Tell me in the comments.
Sources
- SEC 10-K Annual Report — filed 2026-02-24
- SEC 8-K Filing (2026-06-08)
- SEC 8-K Filing (2026-06-01)
- SEC 8-K Filing (2026-05-26)
- SEC 8-K Filing (2026-05-20)
- SEC 8-K Filing (2026-05-06)
- SEC 8-K Filing (2026-02-24)
- SEC Form 4 Insider Transaction (2026-06-03)
- SEC Form 4 Insider Transaction (2026-06-02)
- SEC Form 4 Insider Transaction (2026-05-20)
Data sourced from Yahoo Finance and SEC EDGAR. Not investment advice.
Leave a Comment