
| Company | Aug 25 | Sep 25 | Oct 25 | Nov 25 | Dec 25 | Jan 26 | Feb 26 | Mar 26 | Apr 26 | May 26 | Jun 26 | Jul 26 | 12-Mo |
|---|---|---|---|---|---|---|---|---|---|---|---|---|---|
| URBN | -11% | +6% | -10% | +15% | +2% | -6% | -7% | -4% | +11% | +3% | -2% | +5% | -1% |
| CROX | -13% | -4% | -2% | +4% | +1% | -2% | +8% | -8% | +23% | +16% | +2% | +6% | +28% |
| BIRK | +4% | -13% | -12% | +9% | -6% | -8% | +10% | -14% | +8% | +16% | -5% | -10% | -23% |
| GAP | +13% | -3% | +8% | +18% | -5% | +10% | +0% | -14% | +2% | -14% | -12% | +9% | +6% |
| LEVI | +14% | +4% | -12% | +9% | -6% | -4% | +12% | -17% | +21% | +4% | +7% | -1% | +28% |
| AEO | +20% | +32% | -2% | +22% | +29% | -11% | +5% | -32% | +5% | -9% | +9% | +1% | +63% |
Source: Yahoo Finance monthly adjusted close.
Quick Thesis
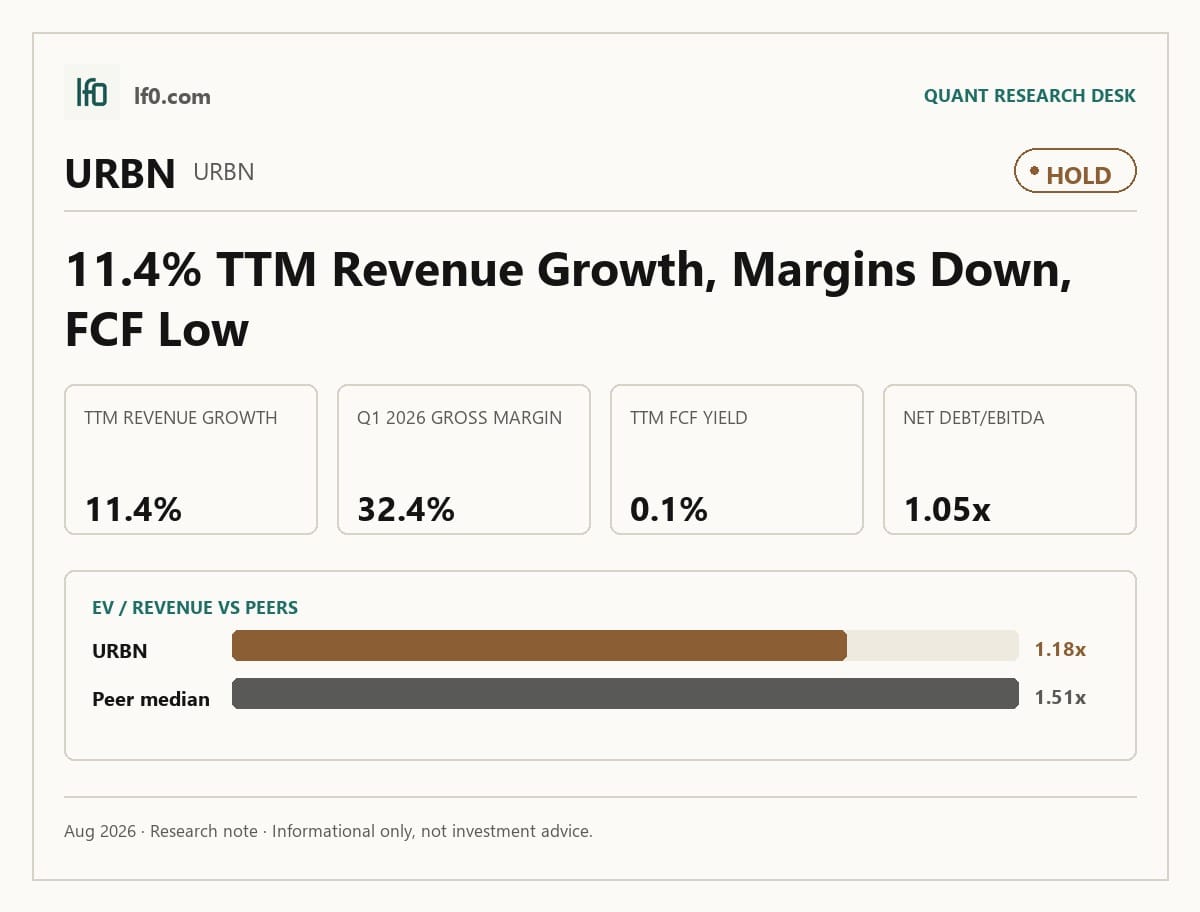
- Rated hold because growth is real, but cash conversion is still too thin.
- TTM revenue growth was 11.4%, ahead of GAP and AEO.
- The main risk is weak free cash flow: FCF yield was 0.1% TTM.
- Valuation is mid-pack at 11.4x forward P/E and 9.9x EV/EBITDA.
- I would turn more constructive if gross margin reclaims 34.0%, meaning markdown pressure is easing.
Executive Summary
Rating: HOLD | URBN
Measured from adjusted close on 2026-08-17 to 2026-10-01. Sell ratings are correct when the stock falls; Hold is tracked as a +/-10% range. Daily-close data, not intraday. Calls are tracked for 182 days from publication, then frozen as a final record.
I would put my rating as a Hold because Urban Outfitters is still growing faster than most apparel peers, but the growth is not yet translating into enough free cash flow to justify a more aggressive call. TTM revenue growth was 11.4%, ahead of GAP at 1.0% and AEO at 9.7%, yet FCF yield was only 0.1% and Q1 2026 gross margin fell to 32.4%, so the market is paying for earnings quality that has not fully shown up in cash. In my view, the key question is whether management can hold gross margin near 36.0% while converting more of that profit into cash. I would raise my rating more toward a Buy if free cash flow margin moved back above 3.0%, meaning annual free cash flow would be roughly $190M on the current revenue base, and if the next two quarters kept revenue growth above 10.0%.
Company Profile
Urban Outfitters is a specialty retailer with a multi-brand model that includes Urban Outfitters, Anthropologie, Free People, and Nuuly. The company sells apparel, accessories, home goods, and subscription rental services through stores, digital channels, and wholesale. That mix matters because it gives URBN more than one way to grow, but it also means execution has to work across fashion, inventory, and digital merchandising at the same time. Nuuly is the clearest growth lever inside the portfolio, while the core retail brands still drive the bulk of sales and margin.
Economic Moat
Business Model
URBN’s structural edge comes from brand differentiation and a diversified retail model rather than from scale alone. Anthropologie and Free People support higher-margin fashion positioning, while Nuuly adds a subscription layer that can deepen customer engagement and smooth demand over time. I feel that this mix is harder to copy quickly than a single-brand apparel concept because it combines lifestyle branding, direct-to-consumer reach, and a rental platform under one operating umbrella.
Business & Operating Risks
The biggest disclosed risk is fashion misjudgment and inventory overhang. According to the risk factors in their SEC 10-K, Urban Outfitters relies heavily on its ability to identify changes in fashion, and if styles are misread the company can be left with unsold inventory or forced into markdowns and promotions. Tariff and import disruption are now a more immediate threat as well: the 2026 10-K says incremental global tariffs were instituted in February 2026, and that higher tariffs, port delays, and transportation costs could pressure margins. Competition is another live issue because the company faces larger digital players and subscription rivals with deeper resources. Taken together, these risks do not break the moat, but they do test whether URBN can keep its brand edge while protecting gross margin.
Management Discussion & Analysis
Management is responding to those risks, but it is doing so by spending rather than by de-risking the model. The company plans about $475M of fiscal 2027 capex and bought the Nuuly fulfillment center in Raymore, Missouri, which gives it more control over a key subscription asset. It also plans to open about 57 new company-owned stores, so the priority remains growth and capacity, not balance-sheet repair. That is sensible if demand stays firm, but it leaves less room for error if tariffs or markdowns intensify. Gross margin improved to 36.0% in fiscal 2026 from 34.7% in fiscal 2025, while selling, general and administrative expenses held at 26.2% of net sales, which tells me the model is still working, but not yet with much operating leverage.
Recent Events
The most important recent event was the May 19, 2026 fifth amendment to the asset-based revolving credit facility, which extends maturity to May 2031 and preserves $350M of liquidity for working capital and general corporate use. That strengthens the balance-sheet side of the thesis because it pushes out refinancing risk and simplifies the credit structure. On June 3, 2026, shareholders re-elected all ten director nominees, ratified Deloitte & Touche LLP for fiscal 2027, and approved executive pay on an advisory basis, which reads as continuity rather than strategic change. The recent 8-Ks therefore support the moat by keeping financing stable, but they do not change the operating challenge around fashion, tariffs, and margin discipline.
Financial Analysis
Growth
URBN — Financial Growth (Quarterly, USD Mil)
| Metric | 2025-04-30 | 2025-07-31 | 2025-10-31 | 2026-01-31 | 2026-04-30 |
|---|---|---|---|---|---|
| REVENUE (USD Mil) | 1,329.5 | 1,504.8 | 1,529.3 | 1,801.8 | 1,481.3 |
| EBIT (USD Mil) | 128.2 | 174.4 | 144.3 | 154.9 | 139.7 |
| EBITDA (USD Mil) | 157.8 | 206.2 | 177.3 | 189.1 | 175.8 |
| NET INCOME (USD Mil) | 108.3 | 143.9 | 116.4 | 96.3 | 115.7 |
| DILUTED EPS | 1.2 | 1.6 | 1.3 | 1.1 | 1.3 |
Source: Yahoo Finance — Quarterly Financial Statements
Revenue was $1.8B in Q1 2026 and $1.5B in Q2 2026, so the latest quarter shows a clear step down from the holiday peak. Over the last four reported quarters, revenue moved from $1.3B to $1.5B to $1.5B to $1.8B and then back to $1.5B, which tells me the business is still growing but remains seasonal and promotion-sensitive. EBITDA followed the same pattern, and that matters because it shows the top line is not yet converting into a smooth earnings run-rate. The Q1 spike and Q2 pullback look seasonal rather than structural, but the deceleration still argues for caution.
Profitability
URBN — Profitability (TTM)
| Metric | TTM |
|---|---|
| Operating Margin (TTM) | 9.0% |
| Net Margin (TTM) | 7.5% |
| Return on Assets (TTM) | 8.4% |
| Return on Equity (TTM) | 18.7% |
| Gross Margin (TTM) | 36.1% |
| EBITDA Margin (TTM) | 12.0% |
Source: Yahoo Finance — Trailing Twelve Months (TTM)
TTM operating margin was 9.0%, net margin was 7.5%, gross margin was 36.1%, and EBITDA margin was 12.0%. I read that as a profitable retailer with decent brand power, but not one with enough pricing leverage to absorb a major cost shock without some margin pressure. ROA was 8.4% and ROE was 18.7%, so capital efficiency is solid and leverage is helping returns without looking excessive. The key point is that the moat is showing up in profitability, but not yet in best-in-class margins.
Valuation
URBN — Valuation Multiples
| Metric | Value |
|---|---|
| Market Cap (USD Mil) | 6,663 |
| Enterprise Value (USD Mil) | 7,455 |
| Trailing P/E | 15 |
| Forward P/E | 11.4 |
| Price/Sales (TTM) | 1.1 |
| Price/Book (mrq) | 2.6 |
| EV/Revenue | 1.2 |
| EV/EBITDA | 9.9 |
| Beta (5Y Monthly) | 1.25 |
| FCF Yield % (TTM) | 0.1% |
| Forward EPS (USD) | 6.8 |
| Analyst Target Price – Low (USD) | 73 |
| Analyst Target Price – Mean (USD) | 86.7 |
| Analyst Target Price – High (USD) | 100 |
| # Analyst Opinions | 13 |
Source: Yahoo Finance
URBN trades at 1.2x EV/revenue, 15.0x trailing P/E, 11.4x forward P/E, and 9.9x EV/EBITDA. On my read, that is a fair multiple for a retailer with 11.4% revenue growth, 7.5% net margin, and only 0.1% FCF yield, but it is not cheap enough to ignore execution risk. The analyst set is meaningful at 13 opinions, and the $73.0–$100 target range with an $86.7 mean sits above the current implied share price of about $77.8, so consensus is modestly more constructive than the stock’s cash generation would justify in my view. I would put fair value in a range of roughly $74-$90, which sits inside the analyst band but below the high end because I weight cash conversion and tariff risk more heavily than the consensus appears to. Forward EPS is $6.8, and that looks reasonable versus peers: it is richer than GAP and AEO on absolute earnings power, but URBN’s lower FCF yield means the market is paying for earnings quality that still needs to prove itself in cash. The valuation case is therefore balanced, not stretched, but the current multiple already assumes the margin profile stays intact.
Leverage
URBN — Leverage & Coverage (Quarterly)
| Metric | Value |
|---|---|
| Total Debt/Equity % (mrq) | 46.1 |
| Current Ratio (mrq) | 1.5 |
| Total Debt (mrq, USD Mil) | 1,204.6 |
| Operating Cash Flow (TTM, USD Mil) | 557.6 |
| Levered Free Cash Flow (TTM, USD Mil) | 4.6 |
| Net Debt/EBITDA (TTM) | 1 |
| FCF Margin % (TTM) | 0.1% |
Source: Yahoo Finance — Quarterly Financial Statements
Total debt was $1.2B, debt/equity was 46.1%, and the current ratio was 1.5, so the balance sheet is manageable. Net debt/EBITDA was 1.0x, which means leverage is not the problem here; cash conversion is. Operating cash flow was $557.6M TTM, but levered free cash flow was only $4.6M, and that gap tells me reinvestment and other cash uses are absorbing most of the operating profit. I do not see refinancing stress, but I do see limited cash flexibility if gross margin weakens again. That is why the leverage profile supports the hold, but not a more bullish call.
Insider Activity
Insider trading has been net negative over the sample period, with 0 open-market purchases versus 259 open-market sales. The sales were broad enough to include senior executives, which is not the signal I want to see when the stock is already asking investors to trust margin durability. At the same time, insiders still hold 33.8% of shares, so alignment is not absent; what matters is that the recent flow has been one-way selling. I take that as a mild caution flag rather than a thesis breaker.
Comparable Analysis
Growth
| Company | Revenue TTM (USD Mil) | Revenue Growth YoY % | EBITDA TTM (USD Mil) | Diluted EPS TTM |
|---|---|---|---|---|
| URBN | 6,317.2 | 11.4% | 756.3 | 5.2 |
| CROX | 4,054.9 | 2.6% | 926.5 | 11.3 |
| BIRK | 2,266.1 | 13.3% | 647.6 | 2.1 |
| GAP | 15,400 | 1.0% | 1,791 | 2.5 |
| LEVI | 6,613.7 | 8.0% | 973.5 | 1.4 |
| AEO | 5,652.9 | 9.7% | 644.2 | 1.6 |
Source: Yahoo Finance
URBN’s 11.4% revenue growth is ahead of GAP at 1.0%, CROX at 2.6%, LEVI at 8.0%, and AEO at 9.7%, while BIRK is slightly faster at 13.3%. That puts URBN near the top of the peer set on growth, and it is doing so from a $6.3B revenue base rather than a much smaller niche base, which makes the growth more meaningful. The growth edge matters more because it is not being matched by a similar cash edge yet.
Valuation
| Company | Trailing P/E | Forward P/E | EV/Revenue | EV/EBITDA | Price/Sales (TTM) | Price/Book (mrq) | Market Cap (USD Mil) | Enterprise Value (USD Mil) | Beta (5Y Monthly) | FCF Yield % (TTM) | Forward EPS | Analyst Target Price – Low | Analyst Target Price – Mean | Analyst Target Price – High | # Analyst Opinions |
|---|---|---|---|---|---|---|---|---|---|---|---|---|---|---|---|
| URBN | 15 | 11.4 | 1.2 | 9.9 | 1.1 | 2.6 | 6,663 | 7,455 | 1.25 | 0.1% | 6.8 | 73 | 86.7 | 100 | 13 |
| CROX | 11.7 | 8.8 | 1.9 | 8.5 | 1.6 | 4.6 | 6,315 | 7,834 | 1.53 | 8.5% | 15 | 95 | 138.2 | 163 | 12 |
| BIRK | 18.6 | 14.2 | 3.6 | 12.7 | 3.1 | 2.2 | 7,000 | 8,240 | 1.30 | 2.2% | 2.8 | 43.1 | 54.3 | 76.3 | 20 |
| GAP | 8.2 | 8 | 0.7 | 5.9 | — | 2 | 7,416 | 10,497 | 2.05 | 12.5% | 2.6 | 20 | 25.9 | 40 | 18 |
| LEVI | 16.1 | 13.2 | 1.5 | 10.3 | 1.3 | 3.8 | 8,678 | 9,996 | 1.33 | 6.8% | 1.7 | 25 | 28.3 | 34 | 15 |
| AEO | 10.2 | 8.3 | 0.8 | 7 | — | 1.6 | 2,710 | 4,480 | 1.32 | 5.3% | 1.9 | 16 | 19.5 | 31 | 10 |
Source: Yahoo Finance
URBN’s 1.2x EV/revenue and 11.4x forward P/E sit between cheaper names like GAP at 0.7x and 8.0x and richer names like CROX at 1.9x and 8.8x. On a growth-adjusted basis, I think URBN looks reasonable rather than cheap, because its 11.4% growth is better than most peers but its 0.1% FCF yield is far weaker than CROX, GAP, LEVI, or AEO. A $1 investment in URBN over the past year would be worth about $1.0 today, versus $1.6 in CROX and $1.3 in LEVI and AEO, so the market has not rewarded URBN’s growth the way it has rewarded the stronger cash generators. That is why my fair-value range stays below the top of the analyst band.
Profitability
| Company | Operating Margin (TTM) | Net Margin (TTM) | Return on Assets (TTM) | Return on Equity (TTM) | Gross Margin (TTM) | EBITDA Margin (TTM) |
|---|---|---|---|---|---|---|
| URBN | 9.0% | 7.5% | 8.4% | 18.7% | 36.1% | 12.0% |
| CROX | 24.2% | 14.6% | 12.0% | 42.3% | 57.5% | 22.9% |
| BIRK | 29.0% | 14.8% | 6.7% | 12.4% | 57.5% | 28.6% |
| GAP | 12.7% | 6.2% | 6.8% | 27.6% | 40.5% | 11.6% |
| LEVI | 9.0% | 9.7% | 7.2% | 25.4% | 61.7% | 14.7% |
| AEO | 2.4% | 5.0% | 6.8% | 17.6% | 38.2% | 11.4% |
Source: Yahoo Finance
URBN’s 36.1% gross margin and 12.0% EBITDA margin trail CROX and BIRK by a wide margin, but they are broadly in line with GAP and LEVI on operating profitability. ROE of 18.7% and ROA of 8.4% are respectable, though not peer-leading, which tells me URBN is efficient without being exceptional. The margin profile is good enough to support the brand portfolio, but not so strong that I would pay a premium multiple without better cash conversion.
Leverage
| Company | Total Debt/Equity % (mrq) | Current Ratio (mrq) | Total Debt (mrq, USD Mil) | Operating Cash Flow TTM (USD Mil) | Free Cash Flow TTM (USD Mil) | Net Debt/EBITDA (TTM) | FCF Margin % (TTM) |
|---|---|---|---|---|---|---|---|
| URBN | 46.1 | 1.5 | 1,204.6 | 557.6 | 4.6 | 1 | 0.1% |
| CROX | 122 | 1.5 | 1,689.2 | 762.6 | 533.9 | 1.6 | 13.2% |
| BIRK | 69 | 3.8 | 1,934 | 400.3 | 154.7 | 1.9 | 6.8% |
| GAP | 154.4 | 1.8 | 5,642 | 1,646 | 928.5 | 1.7 | 6.0% |
| LEVI | 101 | 1.6 | 2,295.6 | 773.9 | 590.2 | 1.4 | 8.9% |
| AEO | 114.1 | 1.5 | 1,874.7 | 445.6 | 144 | 2.8 | 2.5% |
Source: Yahoo Finance
URBN’s 46.1% debt/equity and 1.0x net debt/EBITDA are lighter than CROX, BIRK, GAP, LEVI, and AEO on most leverage measures, and the 1.5 current ratio is adequate. The catch is that URBN’s 0.1% FCF yield is far weaker than the peer group, so the balance sheet is safer than the cash return profile. That combination explains part of the valuation gap: investors are paying less for URBN than for CROX because URBN has less cash yield, even though its leverage is also lower.
Conclusion
I would put my rating as a Hold because the real tension is between a solid brand-led growth profile and a cash conversion rate that is still too thin to support a higher multiple. URBN has the kind of revenue growth and profitability that can justify ownership, but the latest numbers do not yet show that growth turning into enough free cash flow to make the stock clearly cheap.
I would raise my rating more toward a Buy if free cash flow margin moved back above 3.0%, meaning the business would be generating roughly $190M of annual free cash flow on the current revenue base, and if gross margin held near 36.0% for two more quarters. That would tell me the tariff and markdown pressure is being absorbed without breaking the earnings model, and it would make the current 11.4x forward P/E easier to own. I would also become more constructive if management showed that Nuuly and the store base can keep growing without pushing leverage above 1.5x net debt/EBITDA, because that would confirm the expansion is funding itself rather than leaning on the balance sheet.
I would move from Hold to Sell if gross margin slipped below 34.0% for two consecutive quarters, because that would suggest the Q1 2026 decline was not temporary and that inventory or tariff pressure is still working through the income statement. I would also turn more cautious if net debt/EBITDA moved above 1.5x, since that would mean the balance sheet is starting to absorb the cash shortfall instead of cushioning it.
For now, I think the bull case is real but the bear case is more likely to show up first. The stock can work if management turns 11.4% revenue growth into cleaner cash generation, but until that happens I would stay on the sidelines rather than pay for a rerating that has not been earned yet.
What to Watch Next
- Free cash flow margin above 3.0% — would support a move toward Buy.
- Gross margin near 36.0% for two quarters — would show markdown pressure is easing.
- Gross margin below 34.0% for two quarters — would push the rating toward Sell.
- Net debt/EBITDA above 1.5x — would signal less balance-sheet flexibility.
- Nuuly and store growth without leverage creep — would confirm expansion is self-funding.
What’s your take? I rated Urban Outfitters (URBN) HOLD above — but the goal here is to get this right, not just to publish an opinion. What would you add to this analysis, or which risk or catalyst do you think I’m under- or over-weighting? Tell me in the comments.
Sources
- SEC 10-K Annual Report — filed 2026-04-01
- SEC 8-K Filing (2026-06-05)
- SEC 8-K Filing (2026-05-26)
- SEC 8-K Filing (2026-05-21)
- SEC 8-K Filing (2026-02-26)
- SEC 8-K Filing (2026-01-12)
- SEC Form 4 Insider Transaction (2026-06-04)
- SEC Form 4 Insider Transaction (2026-06-04)
- SEC Form 4 Insider Transaction (2026-06-04)
- SEC 10-K Annual Report — FY2026
- SEC 10-K Annual Report — FY2025
- SEC 10-K Annual Report — FY2024
- SEC 10-K Annual Report — FY2023
- SEC 10-K Annual Report — FY2022
Data sourced from Yahoo Finance and SEC EDGAR. Not investment advice.
Leave a Comment