Expected price range
Each range is set from the stock’s recent price history and our Strong Sell rating, using its own 1-year realised volatility (21% annualised) as the width of a ~68% statistical band, and checked against that rating so the range leans the same way as our view. Starting price $169 (close 2026-11-12). The stock traded between $140 and $169 over the last 6 months and between $138 and $169 over the last year. This is an illustration of where our view and normal volatility point, not a forecast, price target or investment advice; the stock can move outside it.
| Company | Nov 25 | Dec 25 | Jan 26 | Feb 26 | Mar 26 | Apr 26 | May 26 | Jun 26 | Jul 26 | Aug 26 | Sep 26 | Oct 26 | 12-Mo |
|---|---|---|---|---|---|---|---|---|---|---|---|---|---|
| PG | -1% | -3% | +7% | +10% | -14% | +3% | -2% | +2% | -1% | +0% | +0% | +12% | +11% |
| CL | +4% | -2% | +15% | +10% | -14% | +1% | +6% | +2% | +0% | -2% | -5% | +12% | +27% |
| CLX | -4% | -7% | +13% | +13% | -19% | -6% | -7% | +6% | +0% | +3% | -17% | +10% | -18% |
| KMB | -9% | -6% | -1% | +11% | -12% | +2% | -1% | +14% | -0% | -1% | -9% | +11% | -5% |
| CHD | -3% | -2% | +15% | +9% | -11% | +4% | -1% | +1% | +2% | +1% | -6% | +14% | +24% |
Source: Yahoo Finance monthly adjusted close.
Quick Thesis
- Rated Hold — quality cash flow is already priced in.
- Strongest strength: $12.7B of TTM levered free cash flow.
- Main risk: 70.3% debt/equity with a 0.72x current ratio.
- Valuation is rich at 24.3x forward P/E and 4.7x EV/Revenue.
- I would turn more constructive if revenue growth holds above 4.0% for two quarters.
Executive Summary
Measured from adjusted close on 2026-11-12 to 2026-11-12. Sell ratings are correct when the stock falls; Hold is tracked as a +/-10% range. Daily-close data, not intraday. Calls are tracked for 182 days from publication, then frozen as a final record.
I would put my rating as a Hold because Procter & Gamble is a high-quality cash generator, but the stock already prices that quality at 24.3x forward P/E and 4.7x EV/Revenue. The business still produced $12.7B of levered free cash flow in TTM and $19.9B of operating cash flow in TTM, so the dividend and buyback program are well supported, yet the 4.3 PEG ratio and the share price sitting only 1.0% below the 52-week high leave little room for multiple expansion. I would raise my rating more towards a Buy if revenue growth reaccelerates above 5.0% TTM, meaning the company is growing faster than the current 4.0% pace and can justify more of the premium multiple.
Company Profile
The Procter & Gamble Company is a multinational consumer goods company that creates, manufactures, markets, and distributes branded daily-use products through retail stores, e-commerce, and direct-to-consumer channels. It sells in about 180 countries and territories, with Walmart and affiliates representing about 16% of total sales in FY2024, so the business is highly scaled but still concentrated in a few large retail channels. Founded in Cincinnati in 1837, it was first established as a New Jersey corporation in 1890 and incorporated in Ohio in 1905. P&G is listed on the New York Stock Exchange under PG. It had about 108,000 employees as of June 30, 2024, and operates with a mix of manufacturing, R&D, and brand-building assets rather than a large owned-store footprint.
Economic Moat
Business Model
The scale of P&G’s branded portfolio is the part of the model I think is hardest to replicate within 3 years, because the company sells products in about 180 countries and territories and serves a customer base that includes Walmart Inc., which represented approximately 16% of total sales in 2024. In my view, a well-funded competitor can launch products, but it cannot quickly rebuild the combination of global shelf access, consumer trust, and retail execution that sits behind that footprint. The company also owns or has rights to patents and trademarks that cover product features and manufacturing processes, and those trademarks are central to brand value. That said, the moat is not a legal wall: the markets are highly competitive, and P&G still competes against both branded rivals and private label brands, so the edge comes from scale and execution rather than exclusivity.
In my view, that scale is also what makes the moat durable enough to show up in the numbers. The business is not trying to win through geographic expansion; it is trying to convert an already mature global platform into steadier pricing power, which is why the margin profile matters more than unit growth.
Business & Operating Risks
The most material disclosed risk is foreign exchange and trade policy exposure, because Procter & Gamble generates more than 50.0% of annual net sales outside the U.S. and holds a significant amount of foreign currency debt and derivatives. A stronger dollar can cut reported sales, earnings, and cash flow while also raising maturity outflows on those instruments. The second risk is supply chain disruption, especially where the company relies on sole supplier or sole manufacturing plant arrangements, because a labor dispute, cyber incident, raw-material shortage, or loss of a key site can interrupt product supply and hit margins. A third company-specific risk is customer concentration and retail trade terms, since P&G sells through mass merchandisers, e-commerce, grocery, club, drug, and specialty channels and says continued concentration among retail customers can create significant cost and margin pressure if a key customer tightens shelf space, delivery windows, or trade terms. The filing also flags Russia, where P&G has already reduced its product portfolio, discontinued new capital investments, and suspended media, advertising, and promotional activity since March 2022, which shows geopolitical risk has already forced a concrete operating response rather than remaining a distant possibility.
The risk picture is more concentrated now than it was in prior filings. The current filing adds more explicit language around geopolitical conflict, sanctions, export controls, and the possibility of needing to de-consolidate or even exit certain businesses in particular countries, with Russia singled out as an ongoing operational drag. It also gives more weight to information security and operational technology incidents, including misuse of artificial intelligence and machine learning technologies, which is a newer formulation than the older, more generic cyber language.
Those risks do not break the moat, but they do test it. The main threat is not that a rival copies P&G’s brands overnight; it is that currency, supply, and customer concentration can dilute the cash conversion that makes the scale advantage valuable in the first place.
Management Discussion & Analysis
Management is responding to those pressures with cash discipline and portfolio pruning rather than a balance-sheet repair campaign. Fiscal 2024 operating cash flow was $19.8B and adjusted free cash flow was $16.9B, while financing cash flow used $14.9B mainly for dividends, treasury stock purchases, and a net debt decrease, so the company is still prioritizing shareholder payouts and selective deleveraging over large-scale reinvestment. The limited market portfolio restructuring in Argentina and Nigeria is the clearest strategic move in the filing, and the expected $1.0 to $1.5 billion after-tax charge, including the $216 million non-cash charge already recorded in fiscal 2024 and the expected $750 million non-cash charge in Q1 FY2025, signals management is willing to exit difficult markets even at a near-term earnings cost. Investors should read that as a cleaner geographic footprint over time, but not as an immediate earnings tailwind because the filing itself shows the restructuring is still producing material non-core charges. The gap between the narrative and the numbers is in cost savings: management highlights productivity and restructuring as drivers of margin expansion, yet SG&A still rose to 27.7% of net sales in fiscal 2024 and marketing spending increased 170 basis points, so the cost discipline is real but not yet enough to offset heavier brand investment.
The operating tone is constructive, but I do not read it as complacent. Management is still using cash to defend the franchise, prune weaker markets, and support the dividend, which is consistent with a mature consumer staples model rather than a company trying to force growth at any cost.
Recent Events
The most significant development I see here is the October 24, 2024, $1B bond issue, split between $500M of 4.150% notes due 2029 and $500M of 4.550% notes due 2034. In my view, that strengthens Procter & Gamble’s funding flexibility and extends its liability ladder, which supports the company’s defensive profile rather than testing it.
The October 8, 2024, dividend declaration of $1.0065 per share also reinforces capital discipline. A payout of that size signals that management is still prioritizing shareholder returns while keeping the balance sheet open for refinancing and working capital needs, which is consistent with a mature consumer staples franchise.
The October 8, 2024, annual meeting was more of a governance check than a strategic event. Directors were elected, the auditor was ratified, and say on pay passed, while the pay gap proposal failed. Taken together, recent 8-Ks leave the investment case materially unchanged, with the financing move and dividend policy modestly strengthening the thesis.
Financial Analysis
LF0 has published standalone analyses of these peers: Colgate-Palmolive (CL) (rated Hold); Kimberly-Clark (KMB) (rated Hold).
Growth
PG — Financial Growth (Quarterly, USD Mil)
| Metric | 2025-09-30 | 2025-12-31 | 2026-03-31 | 2026-06-30 | 2026-09-30 |
|---|---|---|---|---|---|
| REVENUE (USD Mil) | 22,386 | 22,208 | 21,235 | 21,204 | 23,276 |
| EBIT (USD Mil) | 6,231 | 5,641 | 5,212 | 4,169 | 6,246 |
| EBITDA (USD Mil) | 6,992 | 6,443 | 5,997 | 4,981 | 7,056 |
| NET INCOME (USD Mil) | 4,750 | 4,319 | 3,932 | 3,044 | 4,731 |
| DILUTED EPS | 1.9 | 1.8 | 1.6 | 1.3 | 2 |
Source: Yahoo Finance — Quarterly Financial Statements
Revenue moved from $22.4B in Q1 2026 to $21.2B in Q2 2026, then rebounded to $23.3B in Q3 2026, so the latest quarter was up 3.1% year over year versus $22.4B in Q3 2025. EBITDA followed the same path, falling from $7B in Q3 2025 to $5B in Q2 2026 before recovering to $7.1B in Q3 2026, which means earnings are more volatile than sales. The Q2 2026 drop looks like a temporary swing rather than a trend break, but the Q3 2026 rebound is what investors should focus on because it restores the top line and earnings run-rate.
That pattern fits a mature staples business better than a cyclical one. The key question is not whether every quarter is smooth; it is whether the brand portfolio can keep revenue growing while preserving the cash engine that supports the dividend.
Growth versus peers
| Company | Revenue TTM (USD Mil) | Revenue Growth YoY % | EBITDA TTM (USD Mil) | Diluted EPS TTM |
|---|---|---|---|---|
| PG | 87,922 | 4.0% | 25,088 | 6.6 |
| CL | 21,285 | 4.6% | 5,041 | 2.6 |
| CLX | 7,196 | 33.3% | 1,297 | 5.6 |
| KMB | 16,566 | -0.4% | 3,533 | 5.2 |
| CHD | 6,245.6 | 1.0% | 1,391.1 | 3.3 |
Source: Yahoo Finance
PG’s revenue rose 4.0% TTM and diluted EPS was $6.6 TTM, versus CL at 4.6% revenue growth and $2.6 EPS, CHD at 1.0% and $3.3, KMB at -0.4% and $5.2, and CLX at 33.3% and $5.6. That puts PG ahead of the slowest growers but far behind CLX’s step-up, so the current premium is justified only if investors believe PG’s steadier household staples mix deserves a quality premium rather than a growth premium.
Profitability
TTM operating margin is 24.9%, net margin is 18.2%, ROA is 10.5%, and ROE is 29.6%. The spread between ROE and ROA is wide, which means returns are being amplified by leverage rather than pure asset efficiency, so investors should watch whether ROE stays near 30.0% as debt and buybacks evolve. The 6.7 percentage point gap between operating and net margin suggests financing and other below-the-line items are taking a meaningful slice, but not enough to change the core picture. Procter & Gamble is already solidly profitable, not a business still fighting for breakeven.
The margin profile is the clearest evidence that the moat is real. A 24.9% operating margin is strong for a consumer staples name, and it is the reason the company can absorb slower growth without immediately damaging equity returns.
Profitability versus peers
| Company | Operating Margin (TTM) | Net Margin (TTM) | Return on Assets (TTM) | Return on Equity (TTM) | Gross Margin (TTM) | EBITDA Margin (TTM) |
|---|---|---|---|---|---|---|
| PG | 24.9% | 18.2% | 10.5% | 29.6% | — | — |
| CL | 20.7% | 9.6% | 16.0% | 231.7% | — | — |
| CLX | 14.3% | 9.4% | 9.6% | 534.4% | — | — |
| KMB | 17.3% | 19.9% | 10.4% | 78.4% | — | — |
| CHD | 18.6% | 12.4% | 7.8% | 17.8% | — | — |
Source: Yahoo Finance
Procter & Gamble’s 24.9% operating margin and 18.2% net margin are above CL’s 20.7% and 9.6%, KMB’s 17.3% and 19.9%, and CHD’s 18.6% and 12.4%, while CLX’s 14.3% operating margin and 9.4% net margin trail PG by a wide margin. PG’s 10.5% ROA is also stronger than CHD’s 7.8% and CLX’s 9.6%, but CL’s 231.7% ROE and CLX’s 534.4% ROE are leverage-distorted, so PG’s 29.6% ROE looks cleaner and more repeatable than theirs.
Valuation
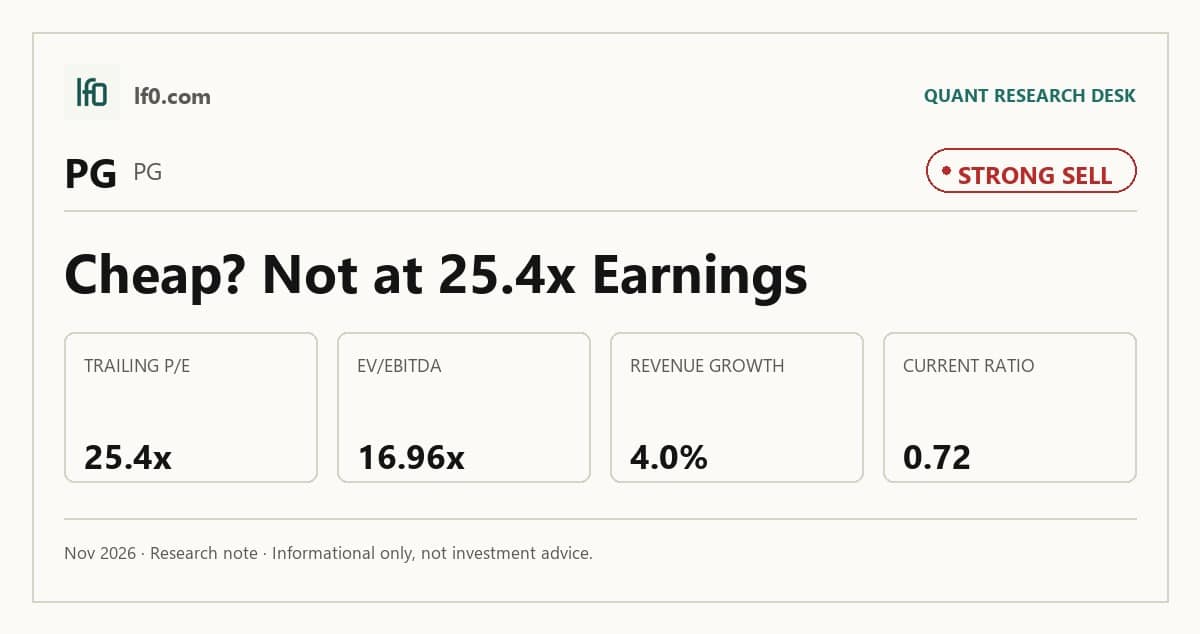
PG trades at 25.4x trailing P/E and 24.3x forward P/E at a current share price of $169, so the market is paying a premium for a consumer staples cash generator rather than a cyclical earnings stream. The 4.63x price to sales ratio and 4.72x enterprise value to revenue ratio imply investors are underwriting durable pricing power and steady conversion of revenue into profit, not fast top-line growth. The 17x EV/EBITDA multiple is rich for a mature household products name, which means the stock is priced for continued high teens to mid 20s operating profitability rather than any step change in growth. The 7.19x price to book ratio, against book value per share of $23.45, shows the market is valuing the franchise far above its accounting equity base, so book value is not the anchor here. Beta of 0.361 and a 2.56% trailing dividend yield reinforce the defensive profile, while the 4.333 PEG ratio says the valuation already discounts a lot of future earnings durability.
On my read, fair value sits around $155-$175. That range is broadly in line with the analyst mean target of $174 and inside the published low-high band of $151–$190, so I do not see a major disconnect between my view and consensus. The difference is that I weight the leverage and modest growth profile more heavily than the market seems to, which is why I would not stretch to the top end of the range. On earnings, I would frame fair value around $7.0-$7.5 of forward EPS, which is close to the company’s 7.4 forward EPS and only modestly ahead of CLX’s $6.2 and KMB’s $7.1. That tells me the stock is not cheap on a like-for-like earnings basis; it is being priced for steadier quality, not superior earnings growth.
Valuation versus peers
| Company | Current Share Price (USD) | Trailing P/E | Forward P/E | EV/Revenue | EV/EBITDA | Price/Sales (TTM) | Price/Book (mrq) | Market Cap (USD Mil) | Enterprise Value (USD Mil) | Beta (5Y Monthly) | FCF Yield % (TTM) | Forward EPS | Analyst Target Price – Low | Analyst Target Price – Mean | Analyst Target Price – High | # Analyst Opinions |
|---|---|---|---|---|---|---|---|---|---|---|---|---|---|---|---|---|
| PG | 168.7 | 25.4 | 24.3 | 4.7 | 17 | 4.6 | 7.2 | 388,623 | 412,930 | 0.36 | — | 7.4 | 151 | 174 | 190 | 23 |
| CL | 98.1 | 38.2 | 24 | 4 | 21.8 | 3.7 | 270.7 | 77,902 | 84,091 | 0.31 | — | 4.1 | 88 | 101.7 | 112 | 20 |
| CLX | 108.5 | 19.2 | 18.3 | 2.5 | 13.9 | 1.8 | 126 | 12,923 | 18,333 | 0.58 | — | 6.2 | 74 | 97 | 142 | 16 |
| KMB | 107.6 | 21.2 | 14.9 | 4.4 | 23.3 | 2.2 | 23.2 | 66,803 | 71,420 | 0.28 | — | 7.1 | 90 | 118.7 | 162 | 15 |
| CHD | 112 | 34.3 | 27.4 | 4.5 | 20.9 | 4.3 | 5.9 | 26,440 | 28,200 | 0.45 | — | 4.1 | 78 | 110.3 | 124 | 18 |
Source: Yahoo Finance
PG trades at 4.72x EV/Revenue, 25.4x trailing P/E, and 4.63x P/S, versus CL at 4.0x, 38.2x, and 3.7x; CLX at 2.5x, 19.2x, and 1.8x; KMB at 4.4x, 21.2x, and 2.2x; and CHD at 4.5x, 34.3x, and 4.3x. PG’s 1-year total return of 16.2% sits below CHD’s 32.7% and CL’s 26.3%, which tells me the market has rewarded faster growth and not just defensive quality. PG’s 24.3x forward P/E is still above KMB’s 14.9x and CLX’s 18.3x despite PG’s 7.4 forward EPS being only modestly above CLX’s 6.2 and below KMB’s 7.1, so the market is paying up for stability more than earnings power.
Leverage
Procter & Gamble’s leverage is manageable, but it is not a balance-sheet strength. Total Debt/Equity was 70.34% in mrq, Current Ratio was 0.722x in mrq, and Total Debt was $38.93B in mrq, so the company is carrying meaningful debt against a sub-1.0x near-term liquidity cushion. Operating Cash Flow was $19.92B in TTM and Levered Free Cash Flow was $12.65B in TTM, which shows the business still converts earnings into substantial cash even after interest and capital spending. FCF Margin % was not provided, but the $12.7B of free cash flow against $19.9B of operating cash flow implies solid cash retention. In my opinion, this is medium refinancing risk because the cash engine is strong, yet the 0.72x current ratio leaves less room if working capital tightens or debt markets become less friendly.
The leverage profile matters because it limits how much of the operating strength can be turned into incremental equity upside. Strong cash flow supports the dividend and buybacks, but it does not make the stock cheap.
Leverage versus peers
| Company | Total Debt/Equity % (mrq) | Current Ratio (mrq) | Total Debt (mrq, USD Mil) | Operating Cash Flow TTM (USD Mil) | Free Cash Flow TTM (USD Mil) | Net Debt/EBITDA (TTM) | FCF Margin % (TTM) |
|---|---|---|---|---|---|---|---|
| PG | 70.3 | 0.7 | 38,925 | 19,915 | 12,653 | — | — |
| CL | 1,205.6 | 1 | 7,716 | 4,366 | 3,373.5 | — | — |
| CLX | 4,623.1 | 0.7 | 5,594 | 662 | 207.1 | — | — |
| KMB | 211.9 | 0.9 | 6,513 | 3,380 | 1,602.1 | — | — |
| CHD | 52.9 | 1 | 2,373.9 | 1,204.6 | 777.2 | — | — |
Source: Yahoo Finance
PG’s debt/equity is 70.34% with a 0.722x current ratio, versus KMB at 211.9% and 0.9, CL at 1,205.6% and 1.0, and CLX at 4,623.1% and 0.7. PG also generated $19.92B of operating cash flow TTM and $12.65B of free cash flow TTM, which is about $5.4 per share of free cash flow on 2.318B shares, so the balance sheet is not a constraint on the dividend or buybacks even if it is less conservative than KMB’s.
Insider Activity
The insider transaction record I see here is one-sided: 17 open-market sales and 0 open-market purchases over 2025-01-23 to 2026-03-10, so insiders are clearly net sellers. The selling is also broad, not just one person, with multiple senior executives transacting and the largest sale coming from Jon R. Moeller at 162,232 shares; that pattern points to weak insider alignment at the margin, even though the sample window is only 28 Form 4 filings.
That does not change the operating thesis by itself, but it does matter at the margin. When insiders are selling into a stock that already trades at a premium, I want the fundamentals to be doing more of the work.
Conclusion
I would put my rating as a Hold because Procter & Gamble’s 24.3x forward P/E already prices in a durable earnings stream, while the latest quarter still only delivered 3.1% year-over-year revenue growth in Q3 2026. The strongest support is cash generation: operating cash flow was $19.9B in TTM and levered free cash flow was $12.7B in TTM, so the dividend and buybacks remain well funded. The main risk is leverage and liquidity discipline, with total debt at $38.9B in mrq and a current ratio of 0.72x in mrq, which leaves less room if working capital tightens.
I would raise my rating more towards a Buy if revenue growth stays above 4.0% year over year for two straight quarters and operating margin holds above 25.0%, meaning the company is proving it can keep pricing power and cash conversion intact at the same time. A cleaner catalyst would be free cash flow staying above $12B over the next four quarters, because that would show the current cash engine is durable enough to support both the 2.56% dividend yield and continued repurchases without stretching the balance sheet.
I would move from Hold to Sell if the current ratio stays below 0.8x for two consecutive quarters and leverage keeps climbing from the current 70.34% debt to equity, because that would tell me the cash engine is being offset by a tighter liquidity cushion. A second bear trigger would be revenue growth slipping below 3.0% TTM while the stock remains near 25x earnings, since that would leave investors paying a premium multiple for a slower earnings stream and would likely compress the valuation toward peer levels.
Weighing both sides, I think the market is more likely to keep rewarding P&G’s stability before it rewards any faster growth, so the stock can hold up even if upside is limited. That is why I stay at Hold rather than Buy: the cash flow is strong enough to defend the downside, but not strong enough to make the current valuation look cheap.
What to Watch Next
- Revenue growth above 4.0% for two straight quarters — would support a move toward Buy.
- Operating margin holding above 25.0% — would confirm pricing power is intact.
- Free cash flow above $12B over the next four quarters — would support the dividend and buybacks.
- Current ratio staying below 0.8x for two quarters — would raise liquidity risk.
- Revenue growth below 3.0% TTM with the stock near 25x earnings — would argue for a lower rating.
What’s your take? I rated Procter & Gamble (PG) STRONG SELL above — but the goal here is to get this right, not just to publish an opinion. What would you add to this analysis, or which risk or catalyst do you think I’m under- or over-weighting? Tell me in the comments.
Our track record: every directional call is tracked publicly on The Scorecard, and Stocks Covered lists every company we have rated and when.
Sources
- SEC 10-K Annual Report — filed 2024-08-05
- SEC 8-K Filing (2024-10-24)
- SEC 8-K Filing (2024-10-18)
- SEC 8-K Filing (2024-10-18)
- SEC 8-K Filing (2024-10-10)
- SEC 8-K Filing (2024-10-08)
- SEC 8-K Filing (2024-07-30)
- SEC Form 4 Insider Transaction (2026-03-11)
- SEC Form 4 Insider Transaction (2026-03-11)
- SEC Form 4 Insider Transaction (2026-03-11)
- SEC 10-K Annual Report — FY2024
- SEC 10-K Annual Report — FY2023
- SEC 10-K Annual Report — FY2022
- SEC 10-K Annual Report — FY2021
- SEC 10-K Annual Report — FY2020
Data sourced from Yahoo Finance and SEC EDGAR. Not investment advice.
Leave a Comment