
Expected price range
Each range is set from the stock’s recent price history and our Strong Sell rating, using its own 1-year realised volatility (51% annualised) as the width of a ~68% statistical band, and checked against that rating so the range leans the same way as our view. Starting price $83.35 (close 2026-11-04). The stock traded between $74.26 and $113 over the last 6 months and between $74.26 and $234 over the last year. This is an illustration of where our view and normal volatility point, not a forecast, price target or investment advice; the stock can move outside it.
| Company | Nov 25 | Dec 25 | Jan 26 | Feb 26 | Mar 26 | Apr 26 | May 26 | Jun 26 | Jul 26 | Aug 26 | Sep 26 | Oct 26 | 12-Mo |
|---|---|---|---|---|---|---|---|---|---|---|---|---|---|
| FLUT | -10% | +3% | -23% | -36% | -4% | +6% | -10% | +5% | +2% | -4% | -26% | +11% | -64% |
| DKNG | +8% | +4% | -20% | -13% | -9% | +8% | +5% | +3% | -7% | +3% | -22% | +10% | -32% |
| PENN | -10% | -1% | -13% | +22% | -4% | +16% | +8% | +13% | -4% | -19% | -12% | +8% | -3% |
| RSI | +9% | +5% | -9% | +12% | +10% | +29% | -10% | +17% | -10% | -4% | -21% | -40% | -29% |
| SGHC | +0% | +11% | -21% | +13% | +1% | +20% | -4% | +9% | +3% | -3% | -16% | -6% | +1% |
| NKE | +0% | -1% | -3% | +1% | -14% | -16% | +4% | -10% | +2% | -6% | -8% | +9% | -38% |
Source: Yahoo Finance monthly adjusted close.
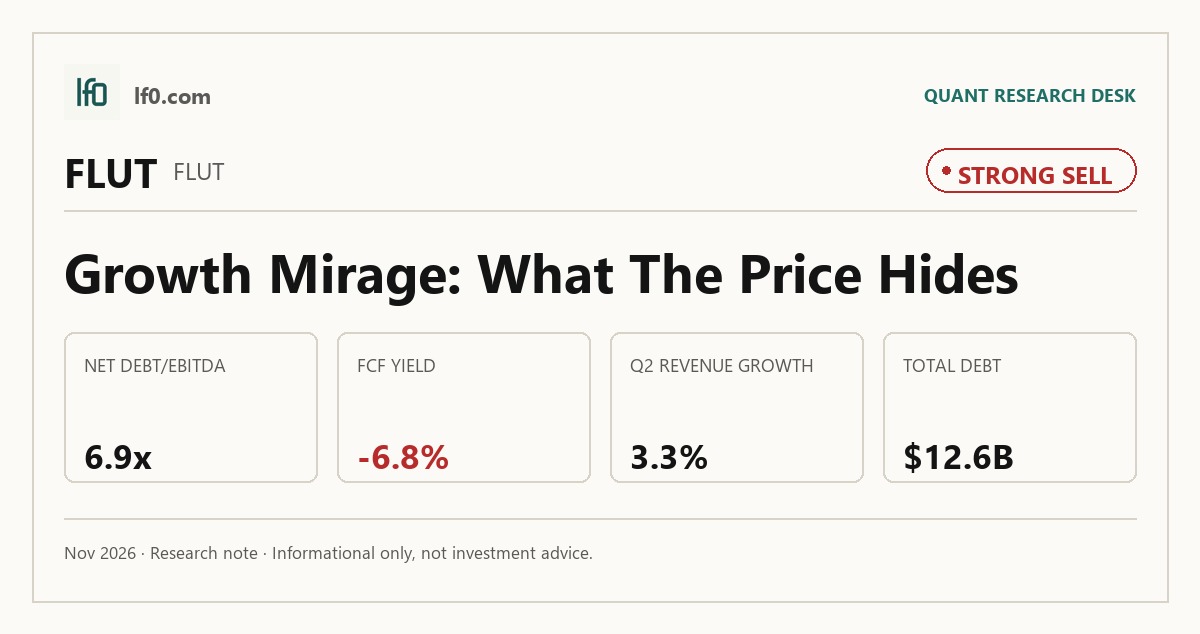
Quick Thesis
- Rated Strong Sell — scale is real, but free cash flow is still negative and leverage is heavy.
- Strongest support: $1.3B of operating cash flow TTM.
- Biggest risk: $12.6B of debt and 6.9x net debt/EBITDA.
- Valuation is mixed: 12.3x forward P/E, but -6.8% FCF yield.
- I would turn more constructive if FCF margin turns positive and net debt/EBITDA falls below 5.0x.
Executive Summary
Rating: STRONG SELL | FLUT
Measured from adjusted close on 2026-11-04 to 2026-11-04. Sell ratings are correct when the stock falls; Hold is tracked as a +/-10% range. Daily-close data, not intraday. Calls are tracked for 182 days from publication, then frozen as a final record.
I rate Flutter a Strong Sell. It has a genuine platform advantage, but the current numbers show too much leverage and too little cash conversion to own the equity at this price. The company’s scale is impressive, yet TTM free cash flow was -$990M and net debt/EBITDA was 6.9x, so the equity is still financing growth and integration rather than compounding cash for shareholders.
I would raise my rating if free cash flow turns positive and stays there while net debt/EBITDA falls below 6.0x, because that would show the acquisition-heavy phase is starting to self-fund. If EBITDA margin moves from 9.3% TTM into the low teens on a $17.2B revenue base, the deleveraging path would shorten meaningfully and the market would have a cleaner earnings story to underwrite.
Company Profile
Flutter Entertainment plc operates online sportsbook, iGaming, exchange betting, daily fantasy sports, and related wagering products through brands including FanDuel, Sky Betting & Gaming, Sportsbet, PokerStars, Paddy Power, Sisal, Snai, tombola, Betfair, TVG, Adjarabet, MaxBet, and Betnacional. The business is now a global operator with about 100 markets, 1,127 retail shops, and a U.S. footprint that includes FanDuel sportsbook in 25 states or territories and iGaming in 5.
The mix matters because Flutter earns revenue from both digital and retail channels, but the investment case is increasingly tied to the online stack. In my view, that gives the company more operating leverage than a traditional bookmaker, while also making the platform more exposed to regulation, tax changes, and product access rules.
Economic Moat
Business Model
I think Flutter’s moat is built on a shared technology stack and customer data layer that can be reused across sportsbook, iGaming, exchange betting, DFS, and prediction markets. According to their SEC filings, the company spent $991M on technology research and development in fiscal 2025 and employed about 7,500 technologists, including roughly 3,500 software engineers, which supports a proprietary platform that is hard to replicate quickly.
That scale also feeds a second advantage: 15.9 million average monthly players were active, so product changes can be tested across a very large user base. I also see a regulatory moat in licensed market access, because Flutter holds approvals across the U.S., Great Britain, Ireland, Australia, Italy, Brazil, Spain, Malta, Gibraltar, and other jurisdictions, and those permissions are not easy to rebuild from scratch.
Business & Operating Risks
The biggest disclosed risk is regulatory and tax change, because it can hit Flutter’s revenue base directly and at scale. The UK budget raised the online iGaming tax rate from 21% to 40% effective April 2026 and online sports betting from 15% to 25% effective April 2027, while Illinois introduced a progressive sports-betting tax up to 40% plus a per-wager fee.
The next most material risk is product and market access disruption from regulation, not generic competition. The filing points to the Wire Act, prediction markets scrutiny, and the possibility that states or countries restrict online betting access, and Flutter voluntarily surrendered its Nevada gaming license and registrations in 2025 to pursue prediction markets. That is a real trade-off between growth initiatives and existing licenses, and it shows the moat is being tested at the edges rather than broken at the core.
A third risk is payment, data, and platform dependence, because Flutter’s business is operationally fragile at the transaction layer. The company depends on payment processors and multi-currency transfer systems, and the June 2025 Paddy Power and Betfair data incident involved unauthorized access to customer personal information. I do not think these risks threaten the shared-platform moat itself, but they do pressure the economics around it by raising compliance costs and making customer trust more expensive to maintain.
Management Discussion & Analysis
Management is clearly prioritizing growth and control of core assets over balance-sheet repair. It completed the $1.553B Boyd Gaming transaction to buy the remaining 5% of FanDuel, acquired 56% of NSX Group for BRL 3,799M, and bought Snai for about €2.3B, which tells me the capital allocation focus is market share and product breadth.
That strategy is partly working, but it is not yet self-funding. U.S. revenue rose 20% to $7B in fiscal 2025 and International revenue rose 14% to $9.4B, yet net loss widened to $407M and operating cash flow fell to $1.2B, so scale is still outrunning earnings quality. The company also launched FanDuel Predicts in December 2025 and January 2026, and I view that as an upside option rather than a base-case earnings driver.
The key point is that management is responding to the moat-related risks with more product breadth and more market access, not with a defensive retrenchment. That is sensible, but the numbers show the response has not yet translated into durable free cash flow.
Recent Events
The most important recent event is the May 6, 2026 leadership change at FanDuel, where Amy Howe exited and Christian Genetski took over day-to-day leadership. Because FanDuel is the core U.S. growth engine, I see that as a meaningful execution test rather than a routine personnel update.
The May 29, 2026 annual meeting was more constructive for governance. Shareholders approved amendments that align the articles more closely with U.S. public company practice, including plurality voting in contested elections and board flexibility on size, while the preferred-share proposal failed. That improves governance discipline, but it also limits financial flexibility, so I read it as a modest positive rather than a major catalyst.
Financial Analysis
Growth
FLUT — Financial Growth (Quarterly, USD Mil)
| Metric | 2025-06-30 | 2025-09-30 | 2025-12-31 | 2026-03-31 | 2026-06-30 |
|---|---|---|---|---|---|
| REVENUE (USD Mil) | 4,187 | 3,794 | 4,737 | 4,304 | 4,326 |
| EBIT (USD Mil) | 335 | -664 | 337 | 401 | -125 |
| EBITDA (USD Mil) | 704 | -245 | 772 | 817 | 274 |
| NET INCOME (USD Mil) | 25 | -760 | 23 | 216 | -272 |
| DILUTED EPS | 0.6 | -3.9 | -0.1 | 1.2 | -1.6 |
Source: Yahoo Finance — Quarterly Financial Statements
Revenue moved from $4.2B in Q2 2025 to $4.3B in Q2 2026, so the top line is still growing, but only modestly. EBITDA fell to $274M from $704M over the same period, and net income swung to a $272M loss from a $25M profit, which tells me the operating line is much weaker than the revenue trend suggests.
That gap matters because it shows growth is not yet converting cleanly into earnings. I would not read the quarter-to-quarter volatility as a demand collapse, but I do think it reinforces that the business is still absorbing tax, marketing, and integration pressure.
Profitability
FLUT — Profitability (TTM)
| Metric | TTM |
|---|---|
| Operating Margin (TTM) | -3.3% |
| Net Margin (TTM) | -4.4% |
| Return on Assets (TTM) | -0.2% |
| Return on Equity (TTM) | -7.9% |
| Gross Margin (TTM) | 42.5% |
| EBITDA Margin (TTM) | 9.2% |
Source: Yahoo Finance — Trailing Twelve Months (TTM)
TTM gross margin of 42.5% shows the core betting and iGaming take is healthy, but EBITDA margin of 9.3% leaves a wide gap to the bottom line. Operating margin was -3.3% TTM and net margin was -4.4% TTM, so the business is still below breakeven on a GAAP basis.
Return on assets was -0.2% TTM and return on equity was -7.9% TTM, which tells me capital efficiency is still poor even before leverage is considered. The moat described above is real, but it has not yet translated into the kind of margin structure that would justify a premium on earnings alone.
Valuation
FLUT — Valuation Multiples
| Metric | Value |
|---|---|
| Current Share Price (USD) | 84.5 |
| Market Cap (USD Mil) | 14,666 |
| Enterprise Value (USD Mil) | 26,101 |
| Forward P/E | 12.3 |
| Price/Sales (TTM) | 0.9 |
| Price/Book (mrq) | 1.7 |
| EV/Revenue | 1.5 |
| EV/EBITDA | 16.4 |
| FCF Yield % (TTM) | -6.8% |
| Forward EPS (USD) | 6.9 |
| Analyst Target Price – Low (USD) | 84 |
| Analyst Target Price – Mean (USD) | 125.8 |
| Analyst Target Price – High (USD) | 246 |
| # Analyst Opinions | 33 |
Source: Yahoo Finance
Flutter trades at 12.3x forward P/E, 16.4x EV/EBITDA, 1.5x EV/revenue, 0.9x price/sales, and 1.7x price/book, with a 1.1 beta and a -6.8% FCF yield. On the numbers here, I think fair value sits in a broad $75-$110 range, which is below the $125.8 analyst mean but still within the $84 to $246 analyst target band across 33 opinions.
I am below the consensus mean because I weight cash conversion and leverage more heavily than the market appears to. The company’s forward EPS of 6.9 looks solid on paper, but with negative free cash flow and 6.9x net debt/EBITDA, I do not think the earnings multiple should be read in isolation.
Leverage
FLUT — Leverage & Coverage (Quarterly)
| Metric | Value |
|---|---|
| Operating Cash Flow (TTM, USD Mil) | 1,330 |
| Levered Free Cash Flow (TTM, USD Mil) | -990 |
| Net Debt/EBITDA (TTM) | 6.9 |
| FCF Margin % (TTM) | -5.8% |
Source: Yahoo Finance — Quarterly Financial Statements
Leverage is the clearest financial risk. Total debt to equity was 134.5% mrq, current ratio was 0.9, total debt was $12.6B, and net debt/EBITDA was 6.9x TTM.
Operating cash flow was $1.3B TTM, but levered free cash flow was -$990M and FCF margin was -5.8%, so the balance sheet is still funding losses rather than harvesting cash. That is why I view the leverage profile as a constraint on valuation: the business can grow, but equity holders do not yet get the full benefit of that growth.
Insider Activity
The insider tape is net selling. The raw transaction list shows multiple director sales and one small purchase, which is not the kind of open-market buying that would make me more constructive.
I do not put too much weight on one week of trades, but the direction is still worth noting. In a company with negative free cash flow and elevated leverage, insider buying would have been a cleaner signal than what I see here.
Comparable Analysis
LF0 has published standalone analyses of these peers: DraftKings (DKNG) (rated Hold); PENN Entertainment (PENN) (rated Sell).
Growth
| Company | Revenue TTM (USD Mil) | Revenue Growth YoY % | Diluted EPS TTM |
|---|---|---|---|
| FLUT | 17,161 | 3.3% | -4.3 |
| DKNG | 6,222.5 | -4.6% | -0.3 |
| PENN | 7,159.9 | 5.2% | -6.4 |
| RSI | 1,474.9 | 38.8% | 0.3 |
| SGHC | 2,431 | 18.1% | 0.7 |
| NKE | 45,891 | -4.3% | 2.1 |
Source: Yahoo Finance
Flutter’s revenue growth was 3.3% TTM, below RSI at 38.8% and SGHC at 18.1%, while DKNG was -4.6%, PENN was 5.2%, and NKE was -4.3%. That puts Flutter in the middle of the pack on size but not on acceleration, so the market is not paying for growth leadership here.
Valuation
| Company | Current Share Price (USD) | Trailing P/E | Forward P/E | EV/Revenue | EV/EBITDA | Price/Sales (TTM) | Price/Book (mrq) | Market Cap (USD Mil) | Enterprise Value (USD Mil) | FCF Yield % (TTM) | Forward EPS | Analyst Target Price – Low | Analyst Target Price – Mean | Analyst Target Price – High | # Analyst Opinions |
|---|---|---|---|---|---|---|---|---|---|---|---|---|---|---|---|
| FLUT | 84.5 | — | 12.3 | 1.5 | 16.4 | 0.9 | 1.7 | 14,666 | 26,101 | -6.8% | 6.9 | 84 | 125.8 | 246 | 33 |
| DKNG | 23.5 | — | 13.7 | 1.9 | 96.2 | 1.9 | 20.5 | 11,689 | 11,819 | 4.0% | 1.7 | 20 | 33.2 | 58 | 36 |
| PENN | 17.6 | — | 13.5 | 1.7 | 14.1 | 0.3 | 1.2 | 2,363 | 12,341 | -2.3% | 1.3 | 17 | 23.5 | 28 | 19 |
| RSI | 12.2 | 34.9 | 14.8 | 0.8 | 6 | 1.9 | 7.2 | 2,825 | 1,224 | 5.3% | 0.8 | 15 | 23.2 | 28 | 14 |
| SGHC | 11.7 | 16.2 | 13.6 | 2.2 | 9 | 2.4 | 7.4 | 5,934 | 5,233 | 4.9% | 0.9 | 13 | 18.7 | 22 | 9 |
| NKE | 40.7 | 19.6 | 26.1 | 1.3 | 12.2 | 1.3 | 4 | 60,474 | 59,912 | 2.9% | 1.6 | 19 | 36.4 | 60 | 37 |
Source: Yahoo Finance
Flutter’s 12.3x forward P/E is below DKNG at 13.7x, PENN at 13.5x, RSI at 14.8x, and SGHC at 13.6x, but its -6.8% FCF yield is the weakest in the group. On a growth-adjusted basis, that combination makes the stock look less cheap than the headline earnings multiple suggests, because the market is paying for a larger earnings base while still waiting for cash conversion to improve.
Using the peer EV/revenue range of 0.8x to 2.2x on Flutter’s $17.2B revenue gives an implied enterprise value of about $14.3B to $36.9B. After net debt, that translates to a very wide per-share range, which tells me the peer set is not tight enough to pin down fair value with precision.
Profitability
| Company | Operating Margin (TTM) | Net Margin (TTM) | Return on Assets (TTM) | Return on Equity (TTM) | Gross Margin (TTM) | EBITDA Margin (TTM) |
|---|---|---|---|---|---|---|
| FLUT | -3.3% | -4.4% | -0.2% | -7.9% | 42.5% | 9.2% |
| DKNG | -4.7% | -2.7% | -2.4% | -21.1% | 76.1% | 2.0% |
| PENN | 7.9% | -12.7% | 1.7% | -37.6% | 35.2% | 12.2% |
| RSI | 11.1% | 2.6% | 14.1% | 32.5% | 35.5% | 13.9% |
| SGHC | 25.1% | 15.1% | 26.5% | 49.5% | 32.2% | 23.8% |
| NKE | 7.9% | 6.7% | 6.9% | 21.6% | 43.4% | 10.7% |
Source: Yahoo Finance
Flutter’s gross margin of 42.5% is respectable, but its EBITDA margin of 9.3% trails SGHC at 23.8%, RSI at 13.9%, PENN at 12.2%, and NKE at 10.7%. Operating margin was -3.3% and net margin was -4.4%, so the company is still behind the better operators on both operating discipline and bottom-line conversion.
Return on equity was -7.9% and return on assets was -0.2%, which is weaker than every profitable peer in the set. That spread reinforces my view that Flutter’s moat is real, but the economics are still not as efficient as the best names in the group.
Leverage
| Company | Total Debt/Equity % (mrq) | Current Ratio (mrq) | Total Debt (mrq, USD Mil) | Operating Cash Flow TTM (USD Mil) | Free Cash Flow TTM (USD Mil) | Net Debt/EBITDA (TTM) | FCF Margin % (TTM) |
|---|---|---|---|---|---|---|---|
| FLUT | 134.5 | 0.9 | 12,581 | 1,330 | -990 | 6.9 | -5.8% |
| DKNG | 336.5 | 1 | 1,916 | 671 | 461.7 | 7.6 | 7.4% |
| PENN | 596.7 | 0.9 | 11,062.2 | 651.2 | -54.3 | 11.7 | -0.8% |
| RSI | 1.2 | 2.2 | 4.5 | 212.4 | 149.3 | -1.9 | 10.1% |
| SGHC | 12.9 | 1.8 | 107 | 449 | 292.9 | -0.8 | 12.0% |
| NKE | 73.1 | 2.1 | 11,125 | 2,781 | 1,766.9 | 0.6 | 3.9% |
Source: Yahoo Finance
Flutter’s total debt to equity of 134.5% and net debt/EBITDA of 6.9x are high versus RSI at 1.2% and -1.9x, SGHC at 12.9% and -0.8x, and NKE at 73.1% and 0.6x. DKNG is also levered at 336.5% and 7.6x, but Flutter’s negative FCF margin of -5.8% leaves less room for error than the cleaner balance sheets in the peer set.
That is why I think the valuation gap is partly a leverage gap. Investors are paying for Flutter’s scale, but they are also underwriting a slower path to balance-sheet flexibility than they get with the stronger cash generators.
Conclusion
I rate Flutter a Strong Sell because, although its scale advantage is real, the cash flow inflection has not shown up yet. The company has a strong platform, broad market access, and a large earnings base, yet TTM free cash flow is still -$990M and net debt/EBITDA is 6.9x, so the equity is not yet self-funding and leverage leaves little margin for error.
The bull case is straightforward: if FanDuel’s U.S. scale and the new prediction markets push lift EBITDA margin into the low teens and free cash flow turns positive, the balance sheet would start to repair itself and the market could justify a higher multiple. I would reconsider the rating if free cash flow stays positive and net debt/EBITDA falls below 6.0x, because that would show the acquisition-heavy phase is finally paying for itself.
The bear case is just as clear. If tax changes and product-access pressure push EBITDA margin back below 8.0% or keep free cash flow negative through the next two reporting periods, the current 12.3x forward P/E will start to look less like a growth multiple and more like a trap on a still-levered balance sheet. In that scenario, the downside case would extend further.
I lean to the bear case arriving first because the cash flow repair is still ahead of the stock, while the regulatory and tax headwinds are already in the numbers. Until the company proves that scale can convert into durable free cash flow, I think the market is paying for a future that has not yet been earned.
What to Watch Next
- Free cash flow turning positive — would support raising the rating.
- Net debt/EBITDA below 6.0x — would show the balance sheet is repairing.
- EBITDA margin in the low teens — would signal better operating leverage.
- UK tax changes and U.S. state fees — would test whether margin pressure is getting worse.
- FanDuel execution after the leadership change — would show whether the core U.S. engine is intact.
What’s your take? I rated Flutter Entertainment (FLUT) STRONG SELL above — but the goal here is to get this right, not just to publish an opinion. What would you add to this analysis, or which risk or catalyst do you think I’m under- or over-weighting? Tell me in the comments.
Our track record: every directional call is tracked publicly on The Scorecard, and Stocks Covered lists every company we have rated and when.
Sources
- SEC 10-K Annual Report — filed 2026-02-26
- SEC 8-K Filing (2026-06-01)
- SEC 8-K Filing (2026-06-01)
- SEC 8-K Filing (2026-05-06)
- SEC 8-K Filing (2026-05-06)
- SEC 8-K Filing (2026-05-01)
- SEC 8-K Filing (2026-04-29)
- SEC Form 4 Insider Transaction (2026-06-05)
- SEC Form 4 Insider Transaction (2026-06-03)
- SEC Form 4 Insider Transaction (2026-06-03)
- SEC 10-K Annual Report — FY2026
- SEC 10-K Annual Report — FY2025
- SEC 10-K Annual Report — FY2024
Data sourced from Yahoo Finance and SEC EDGAR. Not investment advice.
Leave a Comment