
Expected price range
Each range is set from the stock’s recent price history and our Buy rating, using its own 1-year realised volatility (52% annualised) as the width of a ~68% statistical band, and checked against that rating so the range leans the same way as our view. Starting price $39.97 (close 2026-10-30). The stock traded between $25.73 and $41.29 over the last 6 months and between $17.57 and $41.29 over the last year. This is an illustration of where our view and normal volatility point, not a forecast, price target or investment advice; the stock can move outside it.
| Company | Oct 25 | Nov 25 | Dec 25 | Jan 26 | Feb 26 | Mar 26 | Apr 26 | May 26 | Jun 26 | Jul 26 | Aug 26 | Sep 26 | 12-Mo |
|---|---|---|---|---|---|---|---|---|---|---|---|---|---|
| SM | -16% | -9% | -1% | +4% | +19% | +36% | -0% | -1% | -14% | +25% | +14% | -9% | +41% |
| CHRD | -9% | +5% | -1% | +8% | +8% | +33% | +2% | -9% | -13% | +23% | +6% | -9% | +41% |
| VIST | +41% | +1% | -1% | +24% | -5% | +31% | -2% | -0% | -14% | +10% | +1% | -9% | +90% |
| MTDR | -12% | +8% | +0% | +7% | +14% | +23% | +0% | -15% | -7% | +0% | +17% | -11% | +18% |
| RRC | -6% | +11% | -10% | +7% | +9% | +10% | -4% | -10% | -4% | +8% | +3% | -10% | -1% |
| MGY | -6% | +4% | -5% | +17% | +10% | +13% | -4% | -9% | -7% | +1% | +5% | -13% | +1% |
Source: Yahoo Finance monthly adjusted close.
Quick Thesis
- Rated Buy — cash flow is already covering the merger and debt load.
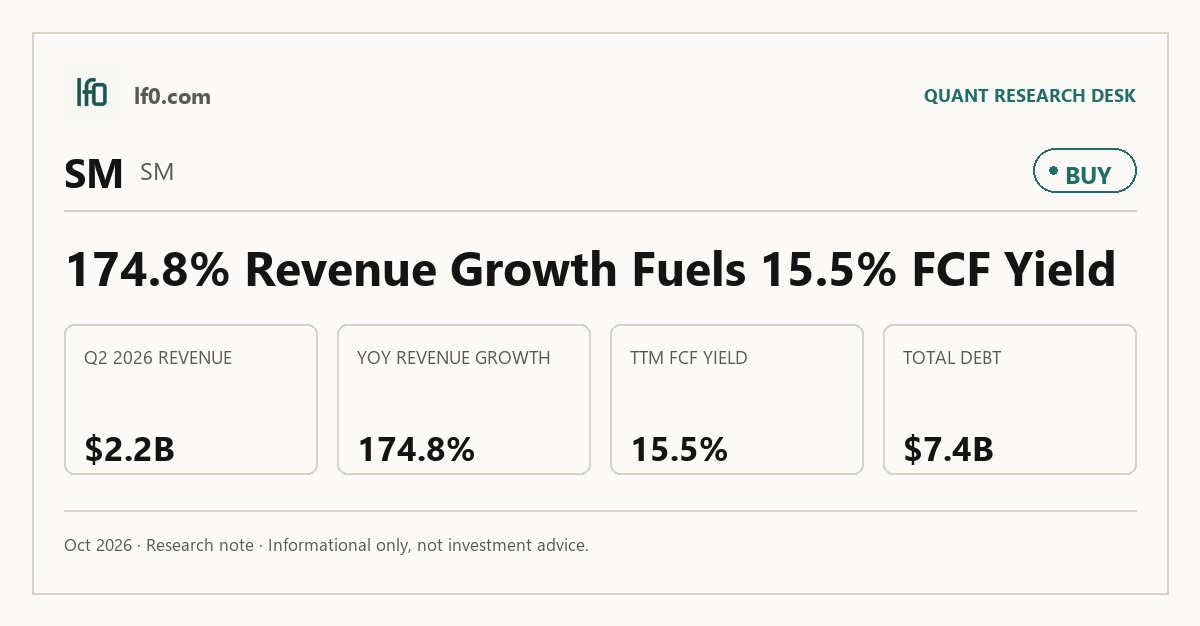
- TTM free cash flow was $1.5B, with a 15.5% FCF yield.
- Total debt was $7.4B and current ratio was 0.6, so liquidity is tight.
- SM trades at 5.1x EV/EBITDA, below what its growth and margins justify.
- I would raise my rating if net debt/EBITDA stays below 2.0x and the South Texas sale closes on schedule.
Executive Summary
Rating: BUY | SM
Measured from adjusted close on 2026-10-30 to 2026-10-30. Sell ratings are correct when the stock falls; Hold is tracked as a +/-10% range. Daily-close data, not intraday. Calls are tracked for 182 days from publication, then frozen as a final record.
I would put my rating as a Buy because SM Energy is already turning the Civitas Merger into cash, not just scale. TTM free cash flow was $1.5B, FCF yield was 15.5%, and net debt/EBITDA was 2.1x, so the equity has real cash support even after a stock-funded acquisition. The key risk is that leverage is still high enough that any slip in integration or commodity pricing would show up quickly in equity value, especially with total debt at $7.4B and a current ratio of 0.6.
I would raise my rating more towards a Strong Buy if the company keeps FCF margin near 29.7% and uses the South Texas divestiture proceeds to cut debt, because that would show the merged portfolio is funding deleveraging rather than merely absorbing it. If EBITDA holds near the current run rate and debt falls by roughly $900M, the balance sheet would look materially safer and the current multiple would start to look too low.
Company Profile
SM Energy is an independent oil and gas producer focused on U.S. shale assets. Its revenue comes from crude oil, natural gas, and natural gas liquids production, so cash generation is tied directly to commodity prices and well productivity rather than to long-duration contracts or recurring fees. The Civitas Merger expanded the asset base materially, and the South Texas divestiture is now part of management’s effort to sharpen the portfolio and reduce leverage.
Economic Moat
Business Model
The moat case here is not a classic network effect or brand premium; it is a portfolio-quality and operating-efficiency advantage. SM’s TTM gross margin of 86.5% and EBITDA margin of 64.6% suggest the company is extracting strong wellhead economics from its asset base, and that is consistent with a shale operator that can high-grade capital into the best acreage. In my view, the Civitas combination should widen that edge if management can keep the merged portfolio focused on the highest-return barrels.
Business & Operating Risks
The most material disclosed risk is integration risk from the Civitas Merger. The filing says the deal could disrupt ongoing business, require significant management time, and expose the company to unknown liabilities and unforeseen expenses, which matters because the moat depends on management converting a larger asset base into lower unit costs and stronger cash flow. Commodity price volatility is the other major threat: lower oil, gas, or NGL prices would pressure earnings, cash flow, and borrowing capacity, and that would directly test the operating advantage rather than just the balance sheet. The South Texas divestiture risk is more about execution than the moat itself, because if the sale slips, the company loses a planned source of deleveraging, but the core operating edge is still intact.
Management Discussion & Analysis
Management is responding to those risks with balance-sheet repair and portfolio pruning. The South Texas sale and the note redemptions show that the company is actively using asset sales and cash flow to reduce leverage, while the capital program remains funded by operating cash rather than by new equity. That tells me management is treating the merger as a cash-conversion exercise, not as a reason to chase growth for its own sake.
Recent Events
The most important recent event was the April 30, 2026 completion of the South Texas divestiture, which brought in about $900M of net cash proceeds. That is a meaningful de-risking step because the company immediately tied the proceeds to debt reduction, and it makes the post-merger balance sheet look more manageable. The May and June 2026 redemptions of the 2026 Senior Notes further reduced near-term refinancing pressure, so recent events support the moat thesis by showing that management is using the larger platform to repair the capital structure rather than stretch it.
Financial Analysis
Growth
SM — Financial Growth (Quarterly, USD Mil)
| Metric | 2025-06-30 | 2025-09-30 | 2025-12-31 | 2026-03-31 | 2026-06-30 |
|---|---|---|---|---|---|
| REVENUE (USD Mil) | 785 | 811 | 702.3 | 1,477 | 2,156 |
| EBIT (USD Mil) | 296 | 247.2 | 184.3 | -297 | 1,500 |
| EBITDA (USD Mil) | 589 | 572.5 | 503.1 | 135 | 2,092 |
| NET INCOME (USD Mil) | 202 | 155.1 | 109 | -335 | 1,071 |
| DILUTED EPS | 1.8 | 1.4 | 0.9 | -1.7 | 4.5 |
Source: Yahoo Finance — Quarterly Financial Statements
Revenue rose from $702.3M in Q4 2025 to $1.5B in Q1 2026 and then to $2.2B in Q2 2026, which reflects the Civitas Merger closing and the larger production base coming through the income statement. The Q2 2026 figure was up 174.8% year over year, and EBITDA reached $2.1B versus $589M a year earlier, so the growth profile is clearly strong enough to support the thesis. The Q1 loss does not change that view for me; it looks like a timing and integration quarter rather than a sign that demand weakened.
Profitability
SM — Profitability (TTM)
| Metric | TTM |
|---|---|
| Operating Margin (TTM) | 60.3% |
| Net Margin (TTM) | 20.2% |
| Return on Assets (TTM) | 6.9% |
| Return on Equity (TTM) | 16.1% |
| Gross Margin (TTM) | 86.5% |
| EBITDA Margin (TTM) | 64.6% |
Source: Yahoo Finance — Trailing Twelve Months (TTM)
TTM operating margin of 60.3%, gross margin of 86.5%, and EBITDA margin of 64.6% point to a business with strong underlying well economics. Net margin of 20.2% is lower because depreciation, interest, and other below-EBITDA items still take a meaningful bite, but the spread between EBITDA margin and net margin is exactly why deleveraging matters here. ROE of 16.1% versus ROA of 6.9% also tells me leverage is amplifying returns, so the equity case improves if management can keep cash generation high while debt comes down.
Valuation
SM — Valuation Multiples
| Metric | Value |
|---|---|
| Current Share Price (USD) | 40 |
| Market Cap (USD Mil) | 9,511 |
| Enterprise Value (USD Mil) | 16,227 |
| Trailing P/E | 7.1 |
| Forward P/E | 4.6 |
| Price/Sales (TTM) | 1.9 |
| Price/Book (mrq) | 1.2 |
| EV/Revenue | 3.3 |
| EV/EBITDA | 5.1 |
| Beta (5Y Monthly) | 0.96 |
| FCF Yield % (TTM) | 15.5% |
| Forward EPS (USD) | 8.7 |
| Analyst Target Price – Low (USD) | 35 |
| Analyst Target Price – Mean (USD) | 46.2 |
| Analyst Target Price – High (USD) | 60 |
| # Analyst Opinions | 18 |
Source: Yahoo Finance
SM trades at 5.1x EV/EBITDA, 7.1x trailing P/E, and 4.6x forward P/E, which is not demanding for a company with a 15.5% FCF yield and a 2.1x net debt/EBITDA ratio. On the analysis here, I would put fair value in a range of about $35–$60 per share, which is broadly in line with the analyst target range of $35–$60 and a mean target of $46.2 across 18 opinions. I think the market is already giving credit for the merger-driven earnings step-up, but it is not fully paying for the cash flow durability yet. Forward EPS is 8.69, which looks reasonable against peers that trade at richer multiples despite weaker growth or lower cash yield; that makes SM look inexpensive on a growth-adjusted basis rather than just on a headline multiple basis.
Leverage
SM — Leverage & Coverage (Quarterly)
| Metric | Value |
|---|---|
| Total Debt/Equity % (mrq) | 95.1 |
| Current Ratio (mrq) | 0.6 |
| Total Debt (mrq, USD Mil) | 7,433 |
| Operating Cash Flow (TTM, USD Mil) | 2,700 |
| Levered Free Cash Flow (TTM, USD Mil) | 1,472.1 |
| Net Debt/EBITDA (TTM) | 2.1 |
| FCF Margin % (TTM) | 29.7% |
Source: Yahoo Finance — Quarterly Financial Statements
Leverage is the main constraint on the story. Total debt was $7.4B, total debt/equity was 95.1%, and the current ratio was 0.6, so the balance sheet is still tight even after the divestiture and note redemptions. Against that, operating cash flow was $2.7B TTM, levered free cash flow was $1.5B TTM, and FCF margin was 29.7%, which gives the company room to keep repairing the balance sheet if execution stays on track. The key point is that cash generation and leverage have to move together; if they do, the equity can rerate, but if cash conversion slips, the debt load will matter much more quickly.
Insider Activity
Insider activity is mixed. The record shows net buying from the CEO and directors over the period, but it is concentrated in a small number of transactions and offset by a larger sale in May 2026. With insider ownership at 0.9%, I do not read this as a strong governance signal either way; it is modest alignment, not high-conviction ownership.
Comparable Analysis
LF0 has published standalone analyses of these peers: Range Resources (RRC) (rated Hold).
Growth
| Company | Revenue TTM (USD Mil) | Revenue Growth YoY % | EBITDA TTM (USD Mil) | Diluted EPS TTM |
|---|---|---|---|---|
| SM | 4,962 | 176.1% | 3,205 | 5.6 |
| CHRD | 5,959 | 84.1% | 2,665.2 | 14.9 |
| VIST | 4,113.9 | 83.4% | 2,570.8 | 7.1 |
| MTDR | 3,839.7 | 26.8% | 2,400.6 | 5.8 |
| RRC | 3,399.4 | 19.7% | 1,663.5 | 3.8 |
| MGY | 1,479.9 | 50.1% | 1,028.1 | 2.3 |
Source: Yahoo Finance
SM’s revenue growth of 176.1% TTM is well ahead of CHRD at 84.1%, VIST at 83.4%, MTDR at 26.8%, RRC at 19.7%, and MGY at 50.1%. Diluted EPS of 5.6 TTM is below CHRD’s 14.9 and VIST’s 7.1, but the growth rate is the point here: SM is still in the steep part of the earnings ramp, which is why the market is willing to look through the merger noise.
Valuation
| Company | Current Share Price (USD) | Trailing P/E | Forward P/E | EV/Revenue | EV/EBITDA | Price/Sales (TTM) | Price/Book (mrq) | Market Cap (USD Mil) | Enterprise Value (USD Mil) | Beta (5Y Monthly) | FCF Yield % (TTM) | Forward EPS | Analyst Target Price – Low | Analyst Target Price – Mean | Analyst Target Price – High | # Analyst Opinions |
|---|---|---|---|---|---|---|---|---|---|---|---|---|---|---|---|---|
| SM | 40 | 7.1 | 4.6 | 3.3 | 5.1 | 1.9 | 1.2 | 9,511 | 16,227 | 0.96 | 15.5% | 8.7 | 35 | 46.2 | 60 | 18 |
| CHRD | 155.8 | 10.5 | 7.8 | 1.6 | 3.5 | 1.4 | 1 | 8,524 | 9,294 | 0.47 | 11.3% | 20 | 150 | 181.9 | 228 | 16 |
| VIST | 71.2 | 10 | 6.2 | 2.7 | 4.3 | 1.9 | 3 | 7,873 | 11,112 | — | 9.6% | 11.4 | 74 | 93.4 | 124.1 | 12 |
| MTDR | 60.6 | 10.4 | 5.9 | 3.1 | 5 | 2 | 1.3 | 7,498 | 12,020 | 0.97 | -12.1% | 10.2 | 59 | 71.1 | 101 | 20 |
| RRC | 54.9 | 14.6 | 13.2 | 4 | 8.1 | 3.8 | 2.6 | 12,826 | 13,511 | 0.71 | 3.2% | 4.2 | 40 | 49.6 | 67 | 20 |
| MGY | 26.5 | 11.6 | 8.5 | 4.3 | 6.2 | 4.9 | 2.2 | 7,285 | 6,331 | 0.79 | 4.6% | 3.1 | 26 | 33.1 | 39 | 17 |
Source: Yahoo Finance
SM’s 5.1x EV/EBITDA sits above CHRD at 3.5x and VIST at 4.3x, but below RRC at 8.1x and MGY at 6.2x. That spread is easier to justify when you pair it with SM’s 15.5% FCF yield, which is stronger than every named peer in the set, and with the fact that its growth rate is also the highest. On a peer-multiple basis, the implied value range is wide, but the market is not paying a premium for SM’s growth the way it often does for lower-yield names; that is why I think the stock still has room if cash flow holds.
Profitability
| Company | Operating Margin (TTM) | Net Margin (TTM) | Return on Assets (TTM) | Return on Equity (TTM) | Gross Margin (TTM) | EBITDA Margin (TTM) |
|---|---|---|---|---|---|---|
| SM | 60.3% | 20.2% | 6.9% | 16.1% | 86.5% | 64.6% |
| CHRD | 34.7% | 14.2% | 5.4% | 10.3% | 48.1% | 44.7% |
| VIST | 45.6% | 19.8% | 11.9% | 26.8% | 81.3% | 62.5% |
| MTDR | 49.2% | 18.8% | 5.9% | 13.6% | 82.4% | 62.5% |
| RRC | 31.4% | 26.2% | 10.6% | 19.6% | 52.3% | 48.9% |
| MGY | 50.7% | 28.8% | 11.8% | 20.9% | 82.2% | 69.5% |
Source: Yahoo Finance
SM’s operating margin of 60.3% and EBITDA margin of 64.6% are at or near the top of the group, ahead of CHRD at 34.7% and 44.7%, VIST at 45.6% and 62.5%, MTDR at 49.2% and 62.5%, RRC at 31.4% and 48.9%, and MGY at 50.7% and 69.5%. The important point is that SM’s margin strength is not just a revenue effect; its gross margin of 86.5% is also best in class, which tells me the operating edge is structural rather than purely cyclical.
Leverage
| Company | Total Debt/Equity % (mrq) | Current Ratio (mrq) | Total Debt (mrq, USD Mil) | Operating Cash Flow TTM (USD Mil) | Free Cash Flow TTM (USD Mil) | Net Debt/EBITDA (TTM) | FCF Margin % (TTM) |
|---|---|---|---|---|---|---|---|
| SM | 95.1 | 0.6 | 7,433 | 2,700 | 1,472.1 | 2.1 | 29.7% |
| CHRD | 18 | 1.2 | 1,502.8 | 2,587.6 | 961.2 | 0.3 | 16.1% |
| VIST | 99.1 | 0.7 | 3,725.3 | 2,299.8 | 756.2 | 1.1 | 18.4% |
| MTDR | 69.1 | 0.7 | 4,319.6 | 2,603.8 | -907.8 | 1.8 | -23.6% |
| RRC | 18.8 | 0.7 | 918.3 | 1,419.3 | 410.4 | 0.6 | 12.1% |
| MGY | 19.2 | 1.6 | 413.1 | 1,037.1 | 332.5 | 0.1 | 22.5% |
Source: Yahoo Finance
SM’s net debt/EBITDA of 2.1x is higher than CHRD at 0.3x, VIST at 1.1x, RRC at 0.6x, and MGY at 0.1x, but still manageable against the company’s cash generation. The current ratio of 0.6 is weaker than most peers, so the balance sheet is less flexible than the operating metrics suggest. That is why SM’s valuation should be read alongside leverage, not in isolation: the market is paying for strong cash flow, but it is also discounting the fact that the capital structure still needs work.
Conclusion
I would put my rating as a Buy because the central tension is no longer whether SM can generate cash; it is whether that cash is enough to de-lever fast enough after the Civitas Merger. The numbers say yes for now: TTM free cash flow was $1.5B, FCF yield was 15.5%, and the South Texas divestiture has already produced about $900M of proceeds that can go straight to debt reduction. That is why I think the risk is manageable rather than thesis-breaking.
The bull case gets stronger if management keeps FCF margin near 29.7% and uses the divestiture proceeds to push net debt/EBITDA below 2.0x, because that would show the larger asset base is funding balance-sheet repair. I would also become more constructive if the company can keep the current ratio from slipping further while the post-merger integration costs fade, since that would tell me the merger is creating a cleaner cash profile rather than a more complicated one.
The bear case is straightforward: if integration costs or commodity weakness pull FCF margin below 20% for two consecutive quarters, the debt load would start to dominate the equity story. I would also turn more cautious if the South Texas sale failed to translate into lower debt and the current ratio stayed near 0.6, because then the market would be left waiting for deleveraging that has not yet shown up in the balance sheet.
Weighing both sides, I think the cash flow and asset-sale catalysts are likely to show up before the downside case does. That is enough for a Buy, but not enough for a Strong Buy until the company proves that the merger is reducing leverage as quickly as it is adding scale.
What to Watch Next
- FCF margin near 29.7% — would support a stronger de-leveraging case.
- Net debt/EBITDA below 2.0x — would confirm the balance sheet is improving.
- South Texas sale proceeds applied to debt — would show merger cash is being used well.
- Current ratio staying above 0.6 — would reduce near-term liquidity pressure.
- Two straight quarters of FCF margin below 20% — would weaken the thesis materially.
What’s your take? I rated SM Energy (SM) BUY above — but the goal here is to get this right, not just to publish an opinion. What would you add to this analysis, or which risk or catalyst do you think I’m under- or over-weighting? Tell me in the comments.
Our track record: every directional call is tracked publicly on The Scorecard, and Stocks Covered lists every company we have rated and when.
Sources
- SEC 10-K Annual Report — filed 2026-02-26
- SEC 8-K Filing (2026-06-01)
- SEC 8-K Filing (2026-05-22)
- SEC 8-K Filing (2026-05-12)
- SEC 8-K Filing (2026-05-06)
- SEC 8-K Filing (2026-04-30)
- SEC 8-K Filing (2026-04-17)
- SEC Form 4 Insider Transaction (2026-05-22)
- SEC Form 4 Insider Transaction (2026-03-13)
- SEC Form 4 Insider Transaction (2026-02-06)
Data sourced from Yahoo Finance and SEC EDGAR. Not investment advice.
Leave a Comment