
Expected price range
Each range is set from the stock’s recent price history and our Hold rating, using its own 1-year realised volatility (48% annualised) as the width of a ~68% statistical band, and checked against that rating so the range leans the same way as our view. Starting price $12.66 (close 2026-10-27). The stock traded between $6.47 and $14.38 over the last 6 months and between $6.22 and $14.38 over the last year. This is an illustration of where our view and normal volatility point, not a forecast, price target or investment advice; the stock can move outside it.
| Company | Oct 25 | Nov 25 | Dec 25 | Jan 26 | Feb 26 | Mar 26 | Apr 26 | May 26 | Jun 26 | Jul 26 | Aug 26 | Sep 26 | 12-Mo |
|---|---|---|---|---|---|---|---|---|---|---|---|---|---|
| AVAH | +2% | +3% | -13% | +3% | -12% | -13% | +2% | +10% | +20% | +10% | +43% | -8% | +40% |
| ADUS | -1% | +3% | -11% | -4% | +0% | -10% | +3% | -5% | +10% | +15% | -1% | -4% | -6% |
| EVH | -21% | -37% | -5% | -20% | +1% | -30% | +64% | +5% | +37% | -43% | +46% | -22% | -59% |
| ALHC | -3% | +14% | +3% | +14% | -15% | -8% | +28% | -32% | +55% | -38% | -10% | -39% | -53% |
| LFST | -11% | +33% | +8% | +0% | +2% | -12% | +19% | +2% | +39% | -2% | +18% | -3% | +119% |
| AMN | +2% | -15% | -5% | +35% | -9% | -6% | +12% | +42% | +12% | +4% | +2% | +5% | +85% |
Source: Yahoo Finance monthly adjusted close.
Quick Thesis
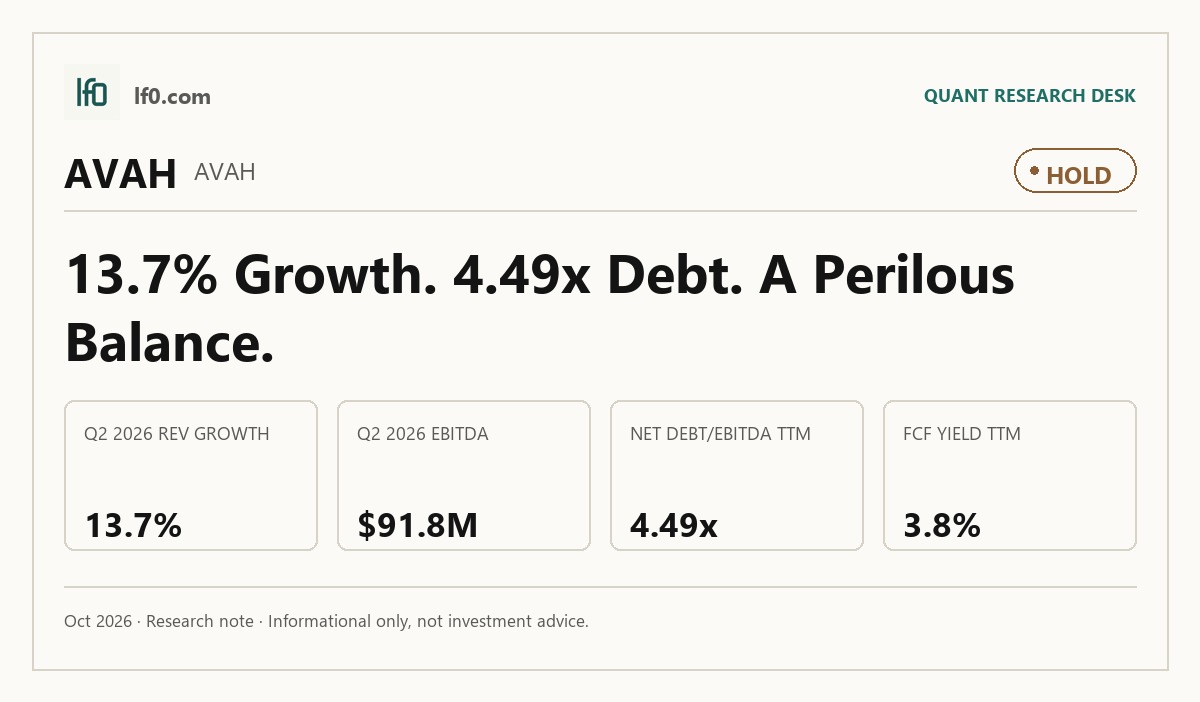
- Rated Hold — growth is real, but 4.5x net debt/EBITDA still limits equity upside.
- Revenue reached $670.5M in Q2 2026, with EBITDA at $91.8M.
- The main risk is leverage: total debt was $1.5B and FCF yield was only 3.8%.
- Valuation is fair to slightly rich at 13.7x EV/EBITDA versus peers.
- I would turn more constructive if net debt/EBITDA falls below 4.0x, meaning leverage is moving into a safer range.
Executive Summary
Rating: HOLD | AVAH
Measured from adjusted close on 2026-10-27 to 2026-10-27. Sell ratings are correct when the stock falls; Hold is tracked as a +/-10% range. Daily-close data, not intraday. Calls are tracked for 182 days from publication, then frozen as a final record.
I would put my rating as a Hold because Aveanna is still growing fast enough to support the thesis, but the balance sheet has not yet caught up with that growth. Revenue rose 13.7% year over year in Q2 2026 to $670.5M, and EBITDA reached $91.8M, which tells me the operating model is working. The problem is that net debt/EBITDA remains 4.5x and FCF yield is only 3.8%, so the equity still depends on continued margin discipline and refinancing benefits rather than on a truly self-funding capital structure. I would become more constructive if net debt/EBITDA falls below 4.0x, meaning leverage is moving toward a safer range, and if free cash flow margin moves closer to 6%, which would show cash generation is finally outrunning debt service and integration spending.
Company Profile
Aveanna Healthcare Holdings provides home-based care, with a focus on pediatric and medically complex patients. The business earns revenue through skilled nursing and related home health services, so volume growth and reimbursement rates matter as much as headline demand. The company is still in expansion mode, and the recent acquisition of Family First Holding adds pediatric home care scale in seven states. That makes Aveanna more of a scaled care platform than a pure local provider, but it also means execution and reimbursement discipline remain central to the investment case.
Economic Moat
Business Model
Aveanna’s moat is not built on a proprietary product; it comes from scale in a fragmented home-care market, where staffing, payer relationships, and local operating density matter. The company’s ability to grow revenue while keeping EBITDA positive suggests that the platform has enough reach to absorb fixed costs better than a smaller operator. I also think the acquisition strategy reinforces that edge, because adding locations and patient volume can improve referral density and scheduling efficiency if integration goes well.
Business & Operating Risks
The main disclosed risks are reimbursement pressure, labor intensity, and acquisition integration, all of which can compress margins quickly in a service business like this. Those risks do not destroy the moat outright, but they do test whether Aveanna can keep its scale advantage while absorbing higher overhead and financing costs. The Family First acquisition and the refinancing both increase the burden on execution, so the moat is intact only if management keeps converting scale into cash rather than just into revenue.
Management Discussion & Analysis
Management is clearly responding to those risks by refinancing debt, extending maturities, and continuing to buy growth, which tells me the team is trying to protect flexibility while expanding the platform. The June 1, 2026 Family First acquisition was funded with cash on hand and borrowings under the securitization facility, so this is not a de-leveraging story; it is a deliberate choice to keep scaling while the balance sheet is still heavy. That said, the company has also shown it can improve margins, and the latest numbers suggest management is at least partially offsetting integration risk with operating discipline.
Recent Events
The most important recent event is the Family First Holding acquisition, which adds pediatric home care scale and should deepen Aveanna’s presence in a core end market. The May 26, 2026 refinancing matters because it cut applicable interest rate margins by 0.50% and refinanced $1.3B of term loans plus a $250M revolver, which lowers near-term financing pressure even though leverage remains high. I view those moves as supportive of the moat only if they translate into better cash conversion; otherwise they simply extend the runway without changing the underlying economics.
Financial Analysis
Growth
AVAH — Financial Growth (Quarterly, USD Mil)
| Metric | 2025-06-30 | 2025-09-30 | 2025-12-31 | 2026-03-31 | 2026-06-30 |
|---|---|---|---|---|---|
| REVENUE (USD Mil) | 589.6 | 621.9 | 662.5 | 647.9 | 670.5 |
| EBIT (USD Mil) | 80.1 | 48.5 | 70.9 | 73.2 | 84.2 |
| EBITDA (USD Mil) | 87.1 | 55.7 | 78 | 80.8 | 91.8 |
| NET INCOME (USD Mil) | 27 | 14.1 | 178.8 | 41.7 | 40.3 |
| DILUTED EPS | 0.1 | 0.1 | 0.8 | 0.2 | 0.2 |
Source: Yahoo Finance — Quarterly Financial Statements
Revenue rose from $589.6M in Q2 2025 to $670.5M in Q2 2026, a 13.7% increase, while EBITDA increased to $91.8M from $87.1M. That combination tells me growth is still translating into operating scale, not just top-line expansion, and it is consistent with the platform-building strategy described above. The quarter-to-quarter dip in early 2026 looks more like normal volatility than a broken trend, but I would still want to see the current run rate hold above $650M before calling the growth profile durable.
Profitability
AVAH — Profitability (TTM)
| Metric | TTM |
|---|---|
| Operating Margin (TTM) | 12.6% |
| Net Margin (TTM) | 10.6% |
| Return on Assets (TTM) | 9.7% |
| Return on Equity (TTM) | 198.6% |
| Gross Margin (TTM) | 32.0% |
| EBITDA Margin (TTM) | 12.0% |
Source: Yahoo Finance — Trailing Twelve Months (TTM)
TTM operating margin was 12.6%, net margin was 10.6%, gross margin was 32.0%, and EBITDA margin was 12.0%. The key point is that Aveanna is already past the low-margin startup phase, but the spread between gross margin and operating margin shows that overhead and clinical staffing still absorb a large share of gross profit. ROA of 9.7% is solid, while ROE of 198.6% is inflated by leverage, so I would not treat the headline equity return as proof of exceptional operating quality. The margin profile supports the moat thesis, but only if the company can keep converting gross profit into cash rather than into more debt service.
Valuation
AVAH — Valuation Multiples
| Metric | Value |
|---|---|
| Current Share Price (USD) | 12.7 |
| Market Cap (USD Mil) | 2,762 |
| Enterprise Value (USD Mil) | 4,272 |
| Trailing P/E | 10 |
| Forward P/E | 13.9 |
| Price/Sales (TTM) | 1.1 |
| Price/Book (mrq) | 9.6 |
| EV/Revenue | 1.6 |
| EV/EBITDA | 13.7 |
| Beta (5Y Monthly) | 1.95 |
| FCF Yield % (TTM) | 3.8% |
| Forward EPS (USD) | 0.9 |
| Analyst Target Price – Low (USD) | 13 |
| Analyst Target Price – Mean (USD) | 15.1 |
| Analyst Target Price – High (USD) | 16 |
| # Analyst Opinions | 10 |
Source: Yahoo Finance
Aveanna trades at 13.7x EV/EBITDA, 1.6x EV/revenue, 10.0x trailing P/E, and 13.9x forward P/E, with a current share price of $12.7 and a market cap of $2.8B. On my read, that is not expensive for a business growing revenue 13.7% and producing positive EBITDA, but it is not cheap enough to ignore the balance sheet either, especially with net debt/EBITDA still at 4.5x and FCF yield at 3.8%. I would put fair value in a range of roughly $13–$16 per share, which sits around the analyst mean target of $15.1 and inside the published $13–$16 consensus band; that tells me the market and the Street are broadly aligned, but the stock is already close to the low end of that range. On earnings power, forward EPS of 0.908 implies a 13.9x forward multiple, which is reasonable versus peers with stronger balance sheets, but not obviously cheap enough to compensate for Aveanna’s leverage. The rating justification that follows from that is simple: the stock is not priced for distress, yet it also is not discounted enough to give me a wide margin of safety.
Leverage
AVAH — Leverage & Coverage (Quarterly)
| Metric | Value |
|---|---|
| Total Debt/Equity % (mrq) | 522.7 |
| Current Ratio (mrq) | 1.2 |
| Total Debt (mrq, USD Mil) | 1,505.3 |
| Operating Cash Flow (TTM, USD Mil) | 168.2 |
| Levered Free Cash Flow (TTM, USD Mil) | 103.8 |
| Net Debt/EBITDA (TTM) | 4.5 |
| FCF Margin % (TTM) | 4.0% |
Source: Yahoo Finance — Quarterly Financial Statements
Total debt was $1.5B, total debt/equity was 522.7%, and net debt/EBITDA was 4.5x, so the balance sheet remains the clearest constraint on the equity. Current ratio was 1.2, which means liquidity is adequate but not generous, and operating cash flow of $168.2M with levered free cash flow of $103.8M shows the business is still generating cash even after debt service and reinvestment. I would not call this a balance-sheet repair story yet; the refinancing improved terms and maturity profile, but the leverage load is still heavy enough that any stumble in reimbursement or integration would show up quickly in equity value.
Insider Activity
The insider record is one-sided: 197 open-market sales totaling $165.2M and no open-market purchases in the period shown. That pattern does not tell me the business is broken, but it does tell me insiders are not leaning in at current levels, which is a caution flag when leverage is already elevated. I would rather see insider buying or at least a pause in selling before I read the ownership structure as supportive of a higher multiple.
Comparable Analysis
Growth
| Company | Revenue TTM (USD Mil) | Revenue Growth YoY % | EBITDA TTM (USD Mil) | Diluted EPS TTM |
|---|---|---|---|---|
| AVAH | 2,602.8 | 13.7% | 311.2 | 1.3 |
| ADUS | 1,476.4 | 8.0% | 160.5 | 5.7 |
| EVH | 2,097 | 46.9% | 61 | -4.5 |
| ALHC | 4,577.3 | 31.6% | 87.4 | 0.2 |
| LFST | 1,584.8 | 26.1% | 135 | 0.1 |
| AMN | 3,434.3 | 2.3% | 307.3 | 2.7 |
Source: Yahoo Finance
Aveanna’s 13.7% revenue growth is ahead of ADUS at 8.0% and AMN at 2.3%, but below EVH at 46.9%, ALHC at 31.6%, and LFST at 26.1%. That puts AVAH in the middle of the group: faster than the mature names, but not fast enough to justify a premium on growth alone. The fact that this growth is coming with positive EBITDA makes it more credible than the fastest growers with weak earnings.
Valuation
| Company | Current Share Price (USD) | Trailing P/E | Forward P/E | EV/Revenue | EV/EBITDA | Price/Sales (TTM) | Price/Book (mrq) | Market Cap (USD Mil) | Enterprise Value (USD Mil) | Beta (5Y Monthly) | FCF Yield % (TTM) | Forward EPS | Analyst Target Price – Low | Analyst Target Price – Mean | Analyst Target Price – High | # Analyst Opinions |
|---|---|---|---|---|---|---|---|---|---|---|---|---|---|---|---|---|
| AVAH | 12.7 | 10 | 13.9 | 1.6 | 13.7 | 1.1 | 9.6 | 2,762 | 4,272 | 1.95 | 3.8% | 0.9 | 13 | 15.1 | 16 | 10 |
| ADUS | 121 | 21.2 | 16.1 | 1.5 | 13.9 | 1.5 | 1.9 | 2,258 | 2,226 | 0.83 | 5.1% | 7.5 | 96 | 134.1 | 155 | 13 |
| EVH | 4.4 | — | 10.9 | 0.7 | 22.4 | 0.2 | 1.3 | 496 | 1,367 | 1.02 | 25.6% | 0.4 | 3 | 5.8 | 8 | 12 |
| ALHC | 8 | 42.1 | 12.3 | 0.3 | 14.5 | 0.4 | 6.2 | 1,659 | 1,265 | 1.14 | 11.4% | 0.7 | 9 | 12.3 | 26 | 13 |
| LFST | 13.1 | 101 | 30.5 | 3.3 | 38.8 | 3.1 | 3.4 | 4,991 | 5,238 | 1.24 | 3.5% | 0.4 | 12 | 14.4 | 18 | 10 |
| AMN | 46.3 | 17.3 | 49.3 | 0.7 | 7.5 | 0.5 | 2.4 | 1,792 | 2,312 | 0.40 | 24.9% | 0.9 | 28 | 36.6 | 43 | 7 |
Source: Yahoo Finance
AVAH trades at 1.6x EV/revenue and 13.7x EV/EBITDA, versus ADUS at 1.5x and 13.9x, AMN at 0.7x and 7.5x, ALHC at 0.3x and 14.5x, LFST at 3.3x and 38.8x, and EVH at 0.7x and 22.4x. On a peer basis, that looks fair rather than cheap, especially because AVAH’s 3.8% FCF yield trails ADUS at 5.1%, AMN at 24.9%, and ALHC at 11.4%. The market is paying for a steadier growth profile, but it is not giving Aveanna a valuation premium for balance-sheet strength, which is exactly why I keep the rating at Hold.
Profitability
| Company | Operating Margin (TTM) | Net Margin (TTM) | Return on Assets (TTM) | Return on Equity (TTM) | Gross Margin (TTM) | EBITDA Margin (TTM) |
|---|---|---|---|---|---|---|
| AVAH | 12.6% | 10.6% | 9.7% | 198.6% | 32.0% | 12.0% |
| ADUS | 9.7% | 7.1% | 6.3% | 9.7% | 32.0% | 10.9% |
| EVH | -1.3% | -24.1% | -0.8% | -67.0% | 17.2% | 2.9% |
| ALHC | 3.2% | 0.9% | 3.1% | 20.0% | 12.6% | 1.9% |
| LFST | 7.2% | 3.2% | 2.3% | 3.4% | 33.6% | 8.5% |
| AMN | 4.0% | 3.1% | 4.4% | 15.6% | 27.8% | 8.9% |
Source: Yahoo Finance
AVAH’s 12.6% operating margin and 10.6% net margin are stronger than ADUS at 9.7% and 7.1%, AMN at 4.0% and 3.1%, and ALHC at 3.2% and 0.9%, while EVH remains negative. Gross margin at 32.0% is also competitive, which tells me the issue is not service economics alone but how much overhead the company needs to carry to support growth. In other words, Aveanna is better than most peers at turning gross profit into operating profit, but the leverage profile keeps that advantage from translating into a cleaner equity story.
Leverage
| Company | Total Debt/Equity % (mrq) | Current Ratio (mrq) | Total Debt (mrq, USD Mil) | Operating Cash Flow TTM (USD Mil) | Free Cash Flow TTM (USD Mil) | Net Debt/EBITDA (TTM) | FCF Margin % (TTM) |
|---|---|---|---|---|---|---|---|
| AVAH | 522.7 | 1.2 | 1,505.3 | 168.2 | 103.8 | 4.5 | 4.0% |
| ADUS | 9.5 | 1.7 | 108.8 | 162.4 | 116.2 | 0.1 | 7.9% |
| EVH | 253.2 | 1.2 | 970.4 | 54.3 | 126.8 | 14 | 6.0% |
| ALHC | 124.7 | 1.7 | 330.5 | 205.6 | 188.6 | -4.2 | 4.1% |
| LFST | 32.1 | 1.4 | 474.1 | 217.9 | 172.4 | 1.8 | 10.9% |
| AMN | 104.7 | 1.1 | 775.8 | 470.8 | 445.8 | 1.3 | 13.0% |
Source: Yahoo Finance
AVAH’s 522.7% debt/equity and 4.5x net debt/EBITDA are far heavier than ADUS at 9.5% and 0.1x, LFST at 32.1% and 1.8x, and AMN at 104.7% and 1.3x. Its 4.0% FCF margin is also below ADUS at 7.9%, LFST at 10.9%, and AMN at 13.0%, so the balance sheet is not just levered; it is also less forgiving than the stronger peers. That is why the valuation does not deserve a premium, even though the growth and margin profile is respectable.
Conclusion
I would put my rating as a Hold because the core tension is still unresolved: Aveanna is growing, but the leverage load is still heavy enough to cap how much of that growth reaches equity holders. The latest quarter shows the operating model is working, and the refinancing lowered interest pressure, yet net debt/EBITDA remains 4.5x and free cash flow yield is only 3.8%, so the improvement is real but not yet decisive.
I would raise my rating more toward a Buy if revenue can stay above $650M per quarter for the next two quarters and free cash flow margin moves toward 6%, because that would show the business is converting scale into cash fast enough to reduce leverage without sacrificing growth. I would also want to see net debt/EBITDA fall below 4.0x, meaning the company is moving into a safer range where one bad quarter would not threaten the thesis. On the downside, I would move from Hold to Sell if revenue falls back below $600M per quarter for two consecutive quarters or if net debt/EBITDA stays above 4.5x after the Family First integration, because that would tell me the acquisition is adding size without improving equity protection.
My final view is that the bull case is credible, but the bear case still has enough weight to keep me cautious. Until the next two quarters show that the acquisition and refinancing are producing sustained cash generation rather than just buying time, I do not see enough asymmetry to move beyond Hold.
What to Watch Next
- Revenue above $650M per quarter — would support a move toward Buy.
- Free cash flow margin near 6% — would show cash generation is outrunning debt service.
- Net debt/EBITDA below 4.0x — would signal a safer leverage profile.
- Revenue below $600M for two straight quarters — would weaken the growth case.
- Net debt/EBITDA still above 4.5x after Family First integration — would keep refinancing risk elevated.
What’s your take? I rated Aveanna Healthcare (AVAH) HOLD above — but the goal here is to get this right, not just to publish an opinion. What would you add to this analysis, or which risk or catalyst do you think I’m under- or over-weighting? Tell me in the comments.
Our track record: every directional call is tracked publicly on The Scorecard, and Stocks Covered lists every company we have rated and when.
Sources
- SEC 10-K Annual Report — filed 2026-03-19
- SEC 8-K Filing (2026-06-02)
- SEC 8-K Filing (2026-05-29)
- SEC 8-K Filing (2026-05-28)
- SEC 8-K Filing (2026-05-15)
- SEC 8-K Filing (2026-05-14)
- SEC 8-K Filing (2026-03-20)
- SEC Form 4 Insider Transaction (2026-06-05)
- SEC Form 4 Insider Transaction (2026-06-05)
- SEC Form 4 Insider Transaction (2026-06-05)
- SEC 10-K Annual Report — FY2026
- SEC 10-K Annual Report — FY2025
- SEC 10-K Annual Report — FY2024
- SEC 10-K Annual Report — FY2023
- SEC 10-K Annual Report — FY2022
Data sourced from Yahoo Finance and SEC EDGAR. Not investment advice.
Leave a Comment