Expected price range
Each range is a ~68% statistical band built from the stock’s own 1-year realised volatility (110% annualised), centred on a path that closes a quarter of the gap to our fair-value midpoint by 3 months and half by 6 months. Starting price $10.45 (close 2026-10-22). This is an illustration of where our view and normal volatility point, not a forecast, price target or investment advice; the stock can move outside it.
| Company | Oct 25 | Nov 25 | Dec 25 | Jan 26 | Feb 26 | Mar 26 | Apr 26 | May 26 | Jun 26 | Jul 26 | Aug 26 | Sep 26 | 12-Mo |
|---|---|---|---|---|---|---|---|---|---|---|---|---|---|
| LUNR | +13% | -20% | +71% | +17% | -13% | +13% | +37% | +73% | -51% | -42% | +24% | -7% | +35% |
| RKLB | +31% | -33% | +66% | +15% | -14% | -7% | +28% | +74% | -29% | -36% | -2% | +9% | +45% |
| RDW | -12% | -30% | +38% | +55% | -23% | -6% | +8% | +167% | -50% | -30% | +24% | -2% | +16% |
| PL | +4% | -12% | +66% | +27% | -3% | +16% | +32% | +38% | -35% | -38% | -3% | -17% | +26% |
| MDA | — | — | — | — | — | — | +21% | +46% | -8% | -27% | -4% | +3% | +17% |
| KTOS | -1% | -16% | -0% | +36% | -16% | -18% | -11% | +2% | -22% | -7% | +9% | -16% | -53% |
Source: Yahoo Finance monthly adjusted close.
Quick Thesis
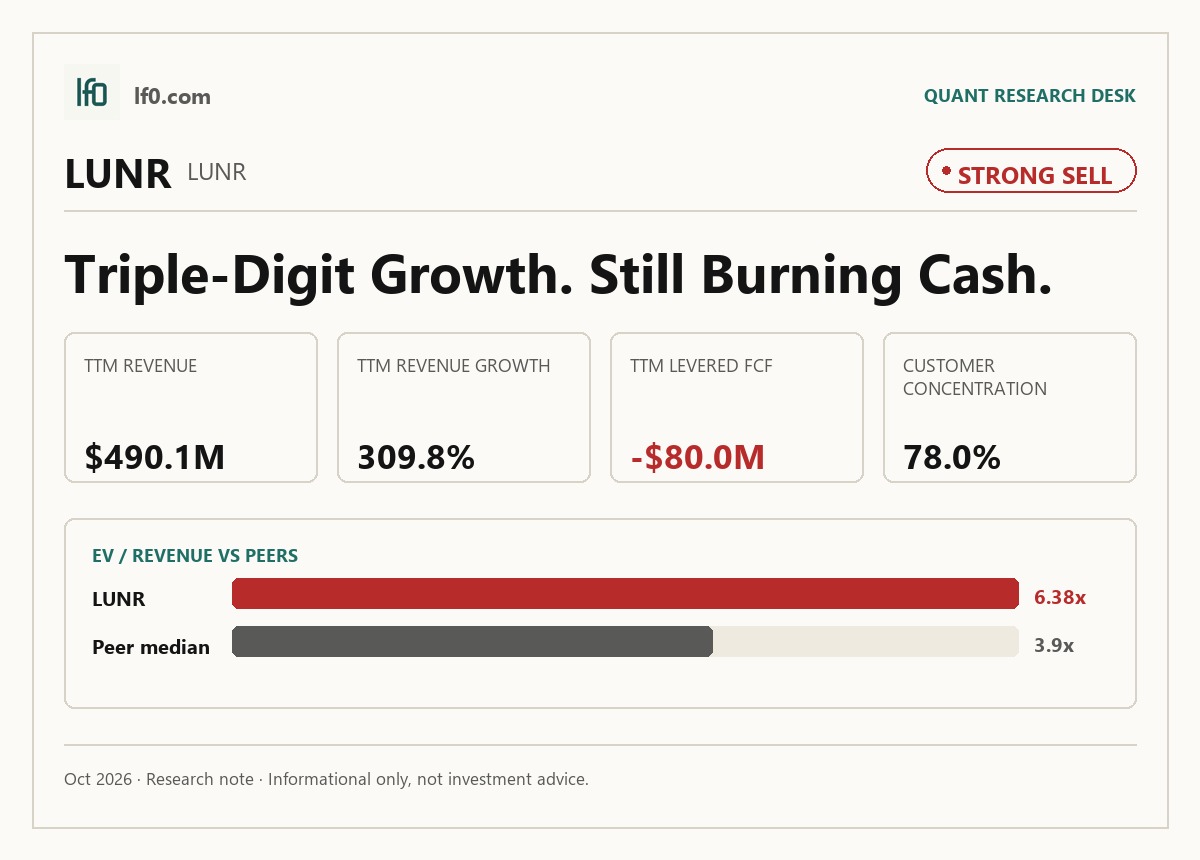
- Rated strong sell — growth is real, but cash burn and concentration risk still dominate.
- Revenue reached $203.4M in Q2 2026, yet TTM operating margin stayed at -18.1%.
- The key risk is customer concentration: 78.0% of 2025 revenue came from one customer.
- Valuation is rich at 6.4x EV/Revenue despite negative free cash flow.
- I would improve the rating only if quarterly revenue stays above $180M and EBITDA loss narrows materially.
Executive Summary
Rating: STRONG SELL | LUNR
We’ll begin tracking this call’s performance since publication once sufficient adjusted-close data is available.
I would put my rating as a strong sell because Intuitive Machines has scaled revenue, but the business still has not converted that scale into durable earnings or cash flow. Revenue reached $203.4M in Q2 2026 and $490.1M TTM, yet TTM operating margin was -18.1% and levered free cash flow was -$80M, so the core issue is not demand but monetization. The stock already trades at 6.4x EV/Revenue, which leaves little room for execution misses when 78.0% of 2025 revenue still came from one customer. I would raise my rating only if quarterly revenue holds above $180M for two more quarters and the EBITDA loss narrows materially from the current -$43.4M, because that would show the higher run rate is durable rather than timing-driven.
Company Profile
Intuitive Machines, Inc. is a space infrastructure and services company founded in 2013 that designs, builds, integrates, and operates spacecraft, landers, satellites, surface systems, and mission networks for civil, national security, and commercial customers. It earns revenue through mission delivery, spacecraft manufacturing, network connectivity, mission operations, hosted payload services, and data relay contracts across low Earth orbit, geostationary orbit, cislunar space, and deep space. The company went public via a business combination with Inflection Point Acquisition Corp. in 2023, then acquired KinetX, Inc. in October 2025 and Lanteris Space Holdings LLC in January 2026, expanding its navigation and satellite manufacturing capabilities. It operates from sites in Texas, Maryland, Arizona, Colorado, and California, with a lunar operations and production center in Houston and a mechanisms and robotics facility in Glen Burnie. Intuitive Machines is listed on Nasdaq under LUNR.
Economic Moat
Business Model
The flight-proven lunar systems and deep-space communications stack is the most defensible part of Intuitive Machines’ model, because I feel that a competitor would struggle to recreate the combination of NASA flight heritage, connected lunar infrastructure, and mission operations experience within 3 years. The company ties that edge to four CLPS awards, the first U.S. soft lunar landing since 1972 on February 22, 2024, and one of two NASA Near Space Network Direct-to-Earth data services awards for the lunar vicinity and beyond, with the sole award for Near Space Network data relay services. I think the hardest-to-replicate element is not any single spacecraft, but the integrated Build, Connect, Operate system that turns delivered hardware into persistent communications, navigation, and operations capability across LEO, GEO, cislunar space, and deep space. Secondary support comes from the Lanteris 1300-class spacecraft platform, which the filing describes as the world’s most popular GEO satellite with over 95 spacecraft still operational and in service, and from the KinetX acquisition, which added deep-space navigation capability. Competitors named in the filing include Lockheed Martin, Blue Origin, Astrobotic, Firefly Aerospace, KSAT, SSC, Telespazio, Airbus, Astranis, Northrop Grumman, SpaceX, and Voyager, so the market is crowded, but the company’s NASA contract depth and flight heritage still look differentiated. The moat is real, but it is still contract-led rather than self-sustaining, which is why the financials matter so much.
Business & Operating Risks
The most material disclosed risk is customer concentration: approximately 78.0% of 2025 revenue and 90.0% of 2024 revenue came from one major customer, so any delay, default, or change in ordering patterns from that counterparty would hit revenue almost immediately. According to the risk factors in their SEC 10-K, a large customer that defaults or otherwise fails to perform could reduce revenues and results of operations, and the financial data already shows how exposed the model is because one customer still dominates the top line. The second risk is launch and mission execution, especially for lunar landers and the new satellite constellation. The 10-K says the company may experience delayed lunar launches, launch failures, failure of lunar landers to reach their planned locations, and failure of landers to conduct all mission milestones, while the NSN contract requires at least one satellite in lunar orbit and five satellites to complete the constellation. A third risk is dependence on U.S. government funding and procurement timing, because continuing resolutions or budget delays could hurt revenues, earnings, and cash flows. Taken together, these risks do threaten the moat: the managed-network advantage only matters if the company can keep the anchor customer, launch reliably, and convert government awards into repeatable operating throughput.
Management Discussion & Analysis
Management is responding to those risks by broadening the platform, but the operating data still shows the gap between ambition and execution. The company issued $345M of 2.5% convertible senior notes due 2030 and completed a $175M equity raise at $15.12 per share in February 2026, which tells me the balance sheet is being fortified for the Lanteris acquisition rather than de-risked through deleveraging. According to management’s discussion in the 10-K, the company also used $403.3M of cash and 22,991,028 shares to buy Lanteris, formerly Maxar Space Systems, a spacecraft manufacturer serving national security, commercial and civil customers, and that is a clear bet on vertical integration and larger contract scope. The problem is that 2025 revenue fell to $210.1M from $228M in 2024 while general and administrative expense rose to $92.6M from $53.3M, so the acquisition and hiring push is running ahead of the current earnings base. Backlog was $213.1M at December 31, 2025, down from $328.3M at December 31, 2024, even though management expects 60.0% to 65.0% of that backlog to convert in 2026, which means the near-term revenue bridge is thinner than the broader platform narrative suggests. Cash and cash equivalents were $582.6M at December 31, 2025, so the capital raises buy time, but they do not yet prove the operating model has scaled.
Recent Events
The most significant development I see is the $175M equity raise completed on February 27, 2026, because it gives Intuitive Machines more balance-sheet flexibility to fund its lunar and space systems work, but it also adds dilution that investors will need to see offset by contract wins or execution gains. The required resale registration by April 1, 2026 reinforces that this was financing for growth, not a sign of distress, so I view it as supportive of the operating platform but not a free pass on capital discipline.
The May 14, 2026 Goonhilly Earth Station acquisition agreement is more strategically important. Intuitive Machines agreed to buy the UK ground station and satellite communications business for £37M, split between cash and stock, and the deal also ties in a planned U.S. acquisition that still needs FCC approval and other closing conditions. In my view, that broadens the company from lunar services into a more diversified communications and ground infrastructure footprint, which strengthens the competitive position if management can close the regulatory steps and integrate the assets cleanly.
The June 2, 2026 sales agreement for up to $500M of Class A stock is the clearest near-term capital signal, because it gives the company a large at-the-market funding channel through a syndicate of nine agents. The June 4, 2026 annual meeting then re-elected both Class III directors and ratified Grant Thornton LLP, which is routine governance rather than a strategic change. Recent 8-Ks therefore strengthen funding optionality, but they also leave the investment case more dependent on disciplined capital deployment than it was before.
Financial Analysis
Growth
LUNR — Financial Growth (Quarterly, USD Mil)
| Metric | 2025-06-30 | 2025-09-30 | 2025-12-31 | 2026-03-31 | 2026-06-30 |
|---|---|---|---|---|---|
| REVENUE (USD Mil) | 50.3 | 51 | 43.3 | 183.6 | 203.4 |
| EBIT (USD Mil) | -38.1 | -8.6 | -53 | -47.6 | -58.4 |
| EBITDA (USD Mil) | -37.4 | -7.8 | -51.6 | -34.6 | -43.4 |
| NET INCOME (USD Mil) | -25.2 | -6.8 | -39.9 | -37.4 | -46.4 |
| DILUTED EPS | -0.2 | -0.1 | -0.3 | -0.2 | -0.3 |
Source: Yahoo Finance — Quarterly Financial Statements
Revenue jumped from $50.3M in Q2 2025 to $51M in Q3 2025, then slipped to $43.3M in Q4 2025 before surging to $183.6M in Q1 2026 and $203.4M in Q2 2026. That means the business moved from a sub-$51M quarterly run rate to a much larger level in the latest two quarters, but the step-up is lumpy rather than smooth. EBITDA did not keep pace: it improved from -$37.4M in Q2 2025 to -$7.8M in Q3 2025, then worsened to -$51.6M in Q4 2025 and stayed negative at -$34.6M in Q1 2026 and -$43.4M in Q2 2026, so earnings are still lagging revenue. I read the growth signal as contract-driven timing rather than steady scaling, which is consistent with the company’s moat but not yet enough to prove operating leverage.
Profitability
LUNR — Profitability (TTM)
| Metric | TTM |
|---|---|
| Operating Margin (TTM) | -18.1% |
| Net Margin (TTM) | -26.6% |
| Gross Margin (TTM) | 16.4% |
| EBITDA Margin (TTM) | -15.2% |
Source: Yahoo Finance — Trailing Twelve Months (TTM)
TTM gross margin was 16.4%, TTM EBITDA margin was -15.2%, TTM operating margin was -18.1%, and TTM net margin was -26.6%. The gap between gross margin and operating margin is wide, which means the core service layer still covers direct costs but not the overhead needed to scale, so investors should focus on whether operating leverage can improve as programs mature. TTM ROA was -5.5% and TTM ROE was -30.8%, and the much deeper ROE loss versus ROA shows returns are being amplified by leverage rather than driven by durable asset productivity. The profitability profile is still far from the moat’s promise: the company has the technical edge, but the economics have not yet caught up.
Valuation
LUNR — Valuation Multiples
| Metric | Value |
|---|---|
| Current Share Price (USD) | 10.4 |
| Market Cap (USD Mil) | 1,687 |
| Enterprise Value (USD Mil) | 3,127 |
| Forward P/E | -67.4 |
| Price/Sales (TTM) | 3.4 |
| EV/Revenue | 6.4 |
| EV/EBITDA | -42 |
| FCF Yield % (TTM) | -4.7% |
| Forward EPS (USD) | -0.2 |
| Analyst Target Price – Low (USD) | 13 |
| Analyst Target Price – Mean (USD) | 29 |
| Analyst Target Price – High (USD) | 43 |
| # Analyst Opinions | 9 |
Source: Yahoo Finance
Intuitive Machines trades on a revenue multiple because earnings are still deeply negative. The stock is at $10.4 per share, with a market cap of $1.69e+03 and enterprise value of $3.13e+03, which implies 6.4x EV/Revenue and 3.4x Price/Sales on TTM revenue. That multiple says the market is paying for a transition from one-off lunar and space systems work toward a recurring infrastructure model, but it is already assuming meaningful execution because EV/Revenue above 6x is rich for a business with TTM operating margin of -18.1% and FCF margin of -16.3%. Forward P/E is -67.4x because forward EPS is -$0.155, so earnings are still expected to be negative, and FCF Yield is -4.7%, which tells me the business is still burning cash rather than generating it. Price/Book is -6.1x because book value per share is -$1.714, so accumulated losses have pushed equity below zero and the multiple itself is not a useful cheap or expensive signal. Beta is 1.86, which tells me the stock is priced as a high-volatility name, not a defensive compounder.
On the analysis here, I would put fair value in a range of roughly $4.6-$108.9 per share using peer EV/Revenue as a reference, but that range is too wide to be a clean anchor on its own. The more useful read is that my range sits below the $29 analyst mean target because I weight cash burn and customer concentration more heavily than the consensus appears to. With 9 analyst opinions, there is a real consensus to compare against, and the gap matters: the street is clearly giving more credit to the platform than I am. I would also frame the implied EPS range as still negative, roughly around the current -$0.2 forward EPS, which is cheap only if the company can move from contract growth to positive operating earnings. Relative to peers, that is not a rich earnings setup; it is a hope-for-improvement setup.
Leverage
LUNR — Leverage & Coverage (Quarterly)
| Metric | Value |
|---|---|
| Total Debt/Equity % (mrq) | 52.8 |
| Current Ratio (mrq) | 1.7 |
| Total Debt (mrq, USD Mil) | 481.4 |
| FCF Margin % (TTM) | -16.3% |
Source: Yahoo Finance — Quarterly Financial Statements
Intuitive Machines’ leverage is elevated and the cash story is weak. Total Debt/Equity was 52.82% in mrq, Current Ratio was 1.658x in mrq, and Total Debt was $481.4M in mrq, so the balance sheet is not distressed today but it is not flexible either. Operating Cash Flow was -$126.4M TTM and Levered Free Cash Flow was -$80M TTM, which means EBITDA is not converting into cash and the business is still funding operations with external capital. Net Debt/EBITDA was -1.5x TTM, helped by cash on hand, but FCF Margin was -16.3% TTM, so the operating model is still consuming cash rather than generating it. The near-term liquidity cushion is real, yet the medium-term refinancing risk remains high unless the company turns the revenue step-up into cash generation.
Insider Activity
The insider transaction record I see here is one-sided: 57 open-market sales and 0 open-market purchases over 2024-12-30 to 2026-06-08, so insiders are clearly net sellers. The selling is concentrated, with Kamal Seyed Ghaffarian accounting for most of the recent open-market activity, while William John Jr Liquori adds a smaller sale; that pattern points to limited alignment support from insider buying. This is a bear signal because the activity is broad enough in dollar terms and entirely one-way, even though the sample is limited to the Form 4 filings shown here.
Comparable Analysis
LF0 has published standalone analyses of these peers: Redwire (RDW) (rated Sell); Planet Labs (PL) (rated Sell).
Growth
| Company | Revenue TTM (USD Mil) | Revenue Growth YoY % | Diluted EPS TTM |
|---|---|---|---|
| LUNR | 490.1 | 309.8% | -0.9 |
| RKLB | 769.1 | 62.0% | -0.3 |
| RDW | 426.3 | 89.6% | -1.4 |
| PL | 378.3 | 58.1% | -1.1 |
| MDA | 1,871.6 | 33.6% | 0.6 |
| KTOS | 1,522.5 | 30.5% | 0.2 |
Source: Yahoo Finance
LUNR’s revenue grew 309.8% TTM to $490.1M, far ahead of RKLB’s 62.0%, RDW’s 89.6%, PL’s 58.1%, MDA’s 33.6%, and KTOS’s 30.5%, while its diluted EPS was -$0.9 versus RKLB at -$0.3 and KTOS at $0.2. That is a real top-line premium, yet the earnings line still shows a business that is scaling faster than it is converting that scale into profit, so investors should treat the growth rate as evidence of demand, not proof that the model is already working.
Valuation
| Company | Current Share Price (USD) | Forward P/E | EV/Revenue | EV/EBITDA | Price/Sales (TTM) | Price/Book (mrq) | FCF Yield % (TTM) | Forward EPS | Analyst Target Price – Low | Analyst Target Price – Mean | Analyst Target Price – High | # Analyst Opinions |
|---|---|---|---|---|---|---|---|---|---|---|---|---|
| LUNR | 10.4 | -67.4 | 6.4 | -42 | 3.4 | -6.1 | -4.7% | -0.2 | 13 | 29 | 43 | 9 |
| RKLB | 51.2 | 890.9 | 37 | -189.2 | 42.6 | 8.8 | -0.8% | 0.1 | 64 | 102.2 | 150 | 20 |
| RDW | 8.1 | -25.4 | 3.7 | -12.9 | 4.8 | 1.2 | -1.3% | -0.3 | 8 | 14.3 | 20 | 9 |
| PL | 13.1 | -10,464 | 11.6 | -90.7 | 12.6 | 8.4 | 1.1% | 0 | 17 | 30.3 | 50 | 11 |
| MDA | 26.8 | 17.4 | 2.3 | 20.2 | 2.3 | 2.8 | -3.3% | 1.5 | 40.8 | 46.8 | 49.9 | 3 |
| KTOS | 38.3 | 33.9 | 3.9 | 68.3 | 4.7 | 2.1 | -1.7% | 1.1 | 50 | 95 | 150 | 25 |
Source: Yahoo Finance
LUNR trades at 6.4x EV/Revenue and 3.4x Price/Sales, versus RKLB at 37.0x and 42.6x, RDW at 3.7x and 4.8x, PL at 11.6x and 12.6x, MDA at 2.3x and 2.3x, and KTOS at 3.9x and 4.7x; its FCF Yield is -4.7%, worse than PL’s 1.1% and far below the cash-generative profile investors usually want before paying a premium. Using peer EV/Revenue of 2.3x to 37.0x on LUNR’s $490.1M revenue gives an implied enterprise value of about $1.1B to $18.1B, or roughly $4.6 to $108.9 per share after netting LUNR’s $367.4M cash and $481.4M debt and dividing by 161.4M shares. That wide range shows the stock is being priced on a very different growth assumption than MDA or KTOS, but the negative FCF yield says the market is still paying ahead of cash conversion. In other words, the valuation premium is not being backed by the same level of balance-sheet safety that supports some of the lower-multiple peers.
Profitability
| Company | Operating Margin (TTM) | Net Margin (TTM) | Gross Margin (TTM) | EBITDA Margin (TTM) |
|---|---|---|---|---|
| LUNR | -18.1% | -26.6% | 16.4% | -15.2% |
| RKLB | -24.6% | -21.5% | 37.3% | -19.6% |
| RDW | -18.9% | -57.3% | 22.7% | -28.4% |
| PL | -12.0% | -95.1% | 55.5% | -12.8% |
| MDA | 6.1% | 5.7% | 28.6% | 11.4% |
| KTOS | -0.2% | 2.0% | 23.0% | 5.7% |
Source: Yahoo Finance
LUNR’s gross margin is 16.4%, below RDW’s 22.7%, KTOS’s 23.0%, MDA’s 28.6%, and RKLB’s 37.3%, while its operating margin is -18.1% and EBITDA margin is -15.2%, better than RDW’s -18.9% and -28.4% but still far from MDA’s 6.1% operating margin and 11.4% EBITDA margin. Because LUNR’s gross margin is also low, this looks like a cost-of-revenue issue as much as an opex issue, which means the path to durable profitability is harder than a simple scale story would suggest. The margin gap to peers matters more here because the company is already valued for growth, not for current earnings.
Leverage
| Company | Total Debt/Equity % (mrq) | Current Ratio (mrq) | Total Debt (mrq, USD Mil) | FCF Margin % (TTM) |
|---|---|---|---|---|
| LUNR | 52.8 | 1.7 | 481.4 | -16.3% |
| RKLB | 3.8 | 5.5 | 133.7 | -32.8% |
| RDW | 5.5 | 3.9 | 90.3 | -6.1% |
| PL | 88.4 | 2.8 | 498.6 | 13.7% |
| MDA | 20 | 0.8 | 378.3 | -7.6% |
| KTOS | 5.7 | 5.5 | 193.6 | -7.8% |
Source: Yahoo Finance
LUNR’s debt/equity is 52.8%, below PL’s 88.4% and above RKLB’s 3.8%, while its net debt/EBITDA is -1.5x because cash exceeds debt on a net basis, unlike RKLB’s 14.4x and PL’s 7.6x. That said, LUNR’s FCF margin is -16.3%, worse than RDW’s -6.1% and PL’s 13.7%, so the balance sheet is a cushion, not a source of self-funding. The lower leverage helps explain why LUNR can still command a premium multiple, but the cash burn keeps that premium from looking fully earned.
Conclusion
I would put my rating as a strong sell because the central tension is no longer whether Intuitive Machines can win work, but whether it can turn that work into cash before the balance sheet has to do more of the heavy lifting. Revenue has stepped up to $203.4M in Q2 2026 and $490.1M TTM, which is enough to show the platform is real, yet TTM operating margin is still -18.1% and levered free cash flow is -$80M, so the numbers still say the business is consuming capital rather than compounding it. The customer concentration risk is also still too high at 78.0% of 2025 revenue from one customer, which means the moat is not yet broad enough to absorb a setback without visible damage.
I would move the rating more toward a buy if quarterly revenue stays above $180M for two more quarters and EBITDA loss narrows materially from the current -$43.4M, because that would show the higher run rate is durable and that the Lanteris and KinetX additions are starting to earn their keep. A positive operating margin would be the clearest sign that the company is finally absorbing overhead instead of adding it, and that is the threshold I would want to see before giving the stock more credit. On the other side, I would move from strong sell toward a sell if quarterly revenue falls back below $100M or if customer concentration remains near 78.0% while backlog keeps slipping from $213.1M, because that would mean the business is still too dependent on one counterparty and too exposed to timing risk. Another warning sign would be another quarter of negative operating cash flow near the current -$126.4M TTM pace, since that would keep the company reliant on external capital even after the recent equity raise and convertible issuance.
Weighing both sides, I still think the market is paying ahead of the proof. The company has built a more interesting platform than it had a year ago, but until the revenue step-up shows through in margins and cash flow, I do not think the current valuation is justified.
What to Watch Next
- Quarterly revenue above $180M — would support a stronger case that the higher run rate is durable.
- EBITDA loss narrowing from -$43.4M — would show operating leverage is starting to work.
- Operating margin turning positive — would confirm the business is absorbing overhead instead of adding it.
- Customer concentration below 78.0% — would reduce single-counterparty risk.
- Operating cash flow improving from -$126.4M TTM — would lower reliance on external capital.
What’s your take? I rated Intuitive Machines (LUNR) STRONG SELL above — but the goal here is to get this right, not just to publish an opinion. What would you add to this analysis, or which risk or catalyst do you think I’m under- or over-weighting? Tell me in the comments.
Sources
- SEC 10-K Annual Report — filed 2026-03-19
- SEC 8-K Filing (2026-06-08)
- SEC 8-K Filing (2026-06-03)
- SEC 8-K Filing (2026-05-14)
- SEC 8-K Filing (2026-03-19)
- SEC 8-K Filing (2026-02-27)
- SEC 8-K Filing (2026-02-25)
- SEC Form 4 Insider Transaction (2026-06-08)
- SEC Form 4 Insider Transaction (2026-06-08)
- SEC Form 4 Insider Transaction (2026-06-08)
- SEC 10-K Annual Report — FY2026
- SEC 10-K Annual Report — FY2025
- SEC 10-K Annual Report — FY2024
- SEC 10-K Annual Report — FY2023
- SEC 10-K Annual Report — FY2022
Data sourced from Yahoo Finance and SEC EDGAR. Not investment advice.
Leave a Comment