Expected price range
Each range is a ~68% statistical band built from the stock’s own 1-year realised volatility (27% annualised), centred on a path that closes a quarter of the gap to our fair-value midpoint by 3 months and half by 6 months. Starting price $23.40 (close 2026-10-19). This is an illustration of where our view and normal volatility point, not a forecast, price target or investment advice; the stock can move outside it.
| Company | Oct 25 | Nov 25 | Dec 25 | Jan 26 | Feb 26 | Mar 26 | Apr 26 | May 26 | Jun 26 | Jul 26 | Aug 26 | Sep 26 | 12-Mo |
|---|---|---|---|---|---|---|---|---|---|---|---|---|---|
| KHC | -5% | +5% | -5% | -2% | +4% | -7% | +1% | +6% | +0% | +9% | -1% | -10% | -7% |
| HRL | -12% | +8% | +2% | +5% | +4% | -12% | -4% | +8% | +7% | +2% | -13% | -9% | -15% |
| KR | -6% | +6% | -7% | +1% | +9% | +6% | -6% | -8% | -11% | +4% | +0% | +2% | -11% |
| KO | +4% | +6% | -4% | +7% | +9% | -6% | +4% | +0% | +4% | +8% | +1% | -2% | +33% |
| GIS | -6% | +2% | -2% | +1% | -2% | -18% | -4% | -4% | +3% | +5% | +15% | -22% | -32% |
| CPB | -3% | +1% | -9% | +2% | -4% | -17% | -5% | +2% | +5% | +0% | +8% | -16% | -33% |
Source: Yahoo Finance monthly adjusted close.
Quick Thesis
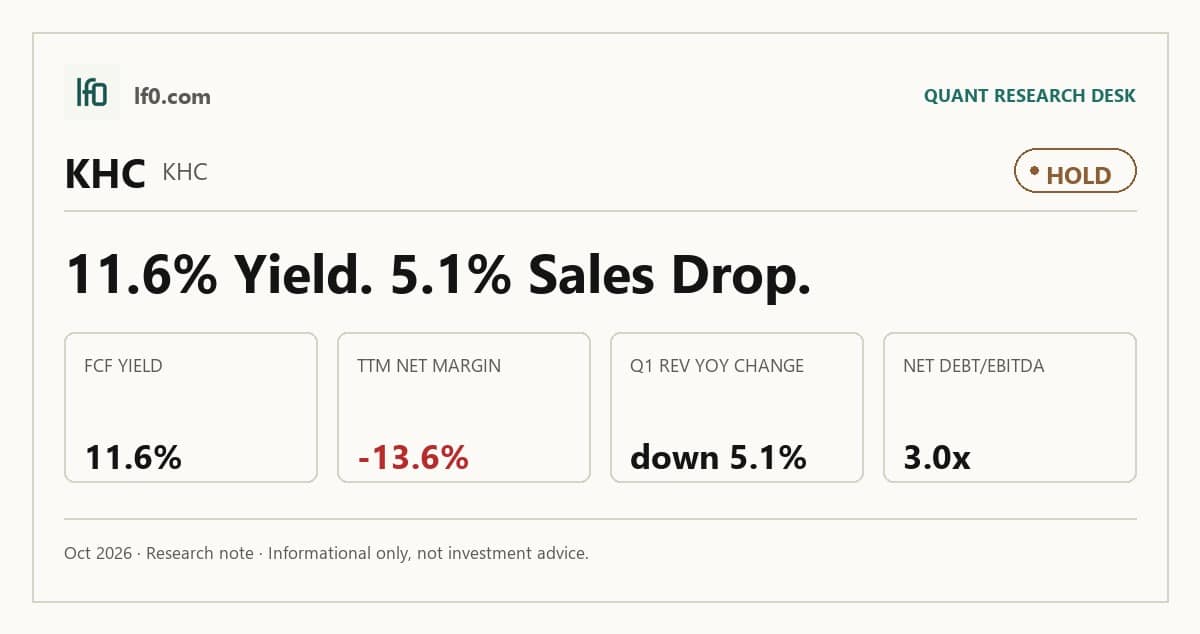
- Hold — cash generation is strong, but revenue is still flat to down and net margin is negative.
- FCF yield is 11.6%, supported by $3.3B of levered free cash flow TTM.
- Main risk: $19B of debt and a 2.97x net debt/EBITDA load.
- Valuation looks fair, with EV/EBITDA at 8.1x and forward P/E at 11.4x.
- I would turn more constructive if revenue holds positive for two quarters and FCF margin stays above 13%.
Executive Summary
Rating: HOLD | KHC
Measured from adjusted close on 2026-10-19 to 2026-10-19. Sell ratings are correct when the stock falls; Hold is tracked as a +/-10% range. Daily-close data, not intraday. Calls are tracked for 182 days from publication, then frozen as a final record.
I would put my rating as a Hold because Kraft Heinz has enough cash generation to support the stock, but not enough operating momentum to justify a more bullish call. The company still produces an 11.6% FCF yield and $3.3B of levered free cash flow TTM, yet revenue fell 5.1% year over year in Q1 2026 and TTM net margin was -13.6%, so the market is paying for stability rather than an earnings inflection.
The key tension is that the balance sheet is serviceable, but the top line is not yet proving durable. I would raise my rating more toward a Buy if revenue turns positive for two consecutive quarters and levered free cash flow stays at or above 13% of sales, because that would show the cash yield is being backed by real demand rather than cost control alone.
Company Profile
The Kraft Heinz Company makes packaged food and beverages and sells them through retail, club, convenience, foodservice, and e-commerce channels. It generated about $25B of net sales in 2025 across eight consumer platforms: Taste Elevation, Easy Ready Meals, Substantial Snacking, Desserts, Hydration, Cheese, Coffee, and Meats.
The company was formed on July 2, 2015, when Kraft Foods Group merged with a Heinz subsidiary. It operates in North America, Europe and Pacific Developed Markets, West and East Emerging Markets, and Asia Emerging Markets, with about 35,000 employees in 40 countries and 62% of staff in production roles.
Economic Moat
Business Model
The brand portfolio is the core advantage here. Kraft Heinz manages eight consumer-driven product platforms, and the most important names in the portfolio include Kraft, Oscar Mayer, Heinz, Philadelphia, Lunchables, Velveeta, Ore-Ida, Capri Sun, Maxwell House, Kool-Aid, and Jell-O in North America, with Heinz, Golden Circle, Plasmon, Wattie’s, Master, ABC, Quero, and Pudliszki across international markets. I feel that this is the hardest element for a well-funded competitor to replicate within three years because the value sits in trademark equity, shelf presence, and distribution reach rather than in a single plant or product line.
The company also benefits from centralized commodity sourcing, preferred supplier relationships, and a broad sales network that reaches grocery, club, convenience, foodservice, and e-commerce channels. That combination helps defend availability and pricing discipline, which is the real moat in a mature packaged-food business.
Business & Operating Risks
The most material risk is pricing power erosion from private label and retailer consolidation. Kraft Heinz says competitors can offer products at prices at or below those typically offered by the company, while larger retailers can demand lower pricing, more favorable terms, increased promotional programs, or tailored product offerings. That pressure hits both revenue and margin, so the moat is being tested at the shelf rather than in manufacturing.
Consumer preference shifts are the second major risk, especially health and wellness trends, including preferences potentially associated with weight-loss drugs, plus negative perceptions around ingredients, additives, preservatives, and packaging materials. Kraft Heinz also committed to remove Food, Drug & Cosmetic colors from its U.S. portfolio by the end of 2027, which makes reformulation execution part of the moat test rather than a side issue. The disclosed risks do not break the brand moat outright, but they do mean the moat only holds if the company keeps its brands relevant and priced competitively.
Management Discussion & Analysis
Management is responding to those risks with a more defensive capital allocation stance. The board paused the planned Separation on February 11, 2026, while the company still closed the Italy infant and specialty food sale for about $146M on December 31, 2025, so the message is that management will prune non-core assets but is not forcing a larger structural split.
The 2026 capital plan is cautious, with expected capital expenditures of about $950M and no draw on the $4B Senior Credit Facility. That tells me management is prioritizing liquidity, maintenance, and cost improvement rather than a growth push, which is sensible given the pricing and mix pressure already visible in the numbers. The risk response is real, but it is still defensive rather than transformative.
Recent Events
The most important recent development is the May 7, 2026 tender offer for up to $1.1B of the 4.375% Senior Notes due 2046, followed by the May 21, 2026 issuance of €1.0B of new 2031 and 2034 notes. I see that as active liability management, not just routine refinancing, because it pushes maturities out and reduces near-term pressure on the capital structure.
The June 8, 2026 partial redemption notice for $1B of the 3.875% Senior Notes due 2027 is even more relevant. It removes a near-term maturity from the path and supports the managed-cost advantage of the business by keeping financing risk from overwhelming the operating model. The May 14, 2026 annual meeting was routine, so the debt actions are the main event here.
Financial Analysis
Growth
KHC — Financial Growth (Quarterly, USD Mil)
| Metric | 2025-06-30 | 2025-09-30 | 2025-12-31 | 2026-03-31 | 2026-06-30 |
|---|---|---|---|---|---|
| REVENUE (USD Mil) | 6,352 | 6,237 | 6,354 | 6,047 | 6,262 |
| EBIT (USD Mil) | -7,927 | 1,047 | 1,135 | 1,246 | 921 |
| EBITDA (USD Mil) | -7,686 | 1,292 | 1,386 | 1,491 | 1,182 |
| NET INCOME (USD Mil) | -7,824 | 615 | 651 | 798 | -5,460 |
| DILUTED EPS | -6.6 | 0.5 | 0.6 | 0.7 | -4.6 |
Source: Yahoo Finance — Quarterly Financial Statements
Revenue was $6B in Q1 2026 versus $6.4B in Q1 2025, down 5.1% year over year, after $6.3B in Q2 2025, $6.2B in Q3 2025, and $6.4B in Q4 2025. That pattern looks like a flat to slightly lower top line rather than a reacceleration, so I do not read the latest quarter as a new growth run rate.
EBITDA fell to $1.2B in Q2 2026 from $1.3B a year earlier, while net income swung to a $5.5B loss from a $0.8B profit. The net loss is the bigger issue for equity holders, because it shows that operating stability is not yet translating into clean per-share earnings growth.
Profitability
KHC — Profitability (TTM)
| Metric | TTM |
|---|---|
| Operating Margin (TTM) | 15.5% |
| Net Margin (TTM) | -13.6% |
| Return on Assets (TTM) | 3.6% |
| Return on Equity (TTM) | -8.8% |
| Gross Margin (TTM) | 33.5% |
| EBITDA Margin (TTM) | 22.1% |
Source: Yahoo Finance — Trailing Twelve Months (TTM)
TTM gross margin of 33.5% and EBITDA margin of 22.1% show Kraft Heinz still clears a healthy amount of profit before overhead, but the 11.4-point gap between them means selling, marketing, and corporate costs are still heavy relative to revenue. That matters because the business is not struggling at the product level; it is struggling to convert gross profit into durable equity returns.
TTM operating margin of 15.5% is solid for a packaged-food company, yet TTM net margin of -13.6% shows the business is still absorbing large below-the-line charges that wipe out operating profit. TTM return on assets of 3.6% and TTM return on equity of -8.8% tell the same story: asset use is modestly productive, but equity holders are not yet seeing durable earnings power.
Valuation
KHC — Valuation Multiples
| Metric | Value |
|---|---|
| Current Share Price (USD) | 23.7 |
| Market Cap (USD Mil) | 28,080 |
| Enterprise Value (USD Mil) | 44,524 |
| Trailing P/E | — |
| Forward P/E | 11.4 |
| Price/Sales (TTM) | 1.1 |
| Price/Book (mrq) | 0.8 |
| EV/Revenue | 1.8 |
| EV/EBITDA | 8.1 |
| Beta (5Y Monthly) | 0.11 |
| FCF Yield % (TTM) | 11.6% |
| Forward EPS (USD) | 2.1 |
| Analyst Target Price – Low (USD) | 19 |
| Analyst Target Price – Mean (USD) | 24.8 |
| Analyst Target Price – High (USD) | 41 |
| # Analyst Opinions | 18 |
Source: Yahoo Finance
KHC screens as a value name on cash generation, not on earnings. The main anchor is FCF Yield (TTM) of 11.6%, which implies the market is paying about 8.6x levered free cash flow for a business that still produces $3.3B of levered free cash flow and $4.6B of operating cash flow TTM. At the current share price of $23.7, that cash yield is attractive, but the market is also pricing in only modest durability because the stock is not being awarded a growth multiple.
The rest of the tape is mixed. Forward P/E is 11.4x, Price/Sales (TTM) is 1.1x, EV/Revenue is 1.8x, and EV/EBITDA is 8.1x. Price/Book (mrq) is 0.8x, which tells me the market is discounting the equity relative to book value rather than paying up for asset growth. The analyst target range of $19.0 to $41.0, with a mean of $24.8 across 18 opinions, brackets the current price closely, so there is coverage but not a strong consensus edge.
On my read, fair value sits around $22-$28 per share. That range sits close to the $24.8 analyst mean, which tells me the Street is broadly aligned with a cash-flow-supported but not especially exciting setup. I would not pay a premium multiple for this name unless the revenue trend improves, because the current leverage profile means growth has to show up in cash flow before it can justify a rerating.
I would also frame the earnings power as roughly $2.0-$2.3 per share on a forward basis, which is close to the company’s own 2.08 forward EPS. That is cheaper than KO on a forward earnings basis and roughly in line with the peer group’s mid-teens to low-teens earnings multiples, but it is not cheap enough to ignore the weak top-line trend.
Leverage
KHC — Leverage & Coverage (Quarterly)
| Metric | Value |
|---|---|
| Total Debt/Equity % (mrq) | 52.6 |
| Current Ratio (mrq) | 1.1 |
| Total Debt (mrq, USD Mil) | 19,001 |
| Operating Cash Flow (TTM, USD Mil) | 4,621 |
| Levered Free Cash Flow (TTM, USD Mil) | 3,250.5 |
| Net Debt/EBITDA (TTM) | 3 |
| FCF Margin % (TTM) | 13.1% |
Source: Yahoo Finance — Quarterly Financial Statements
Kraft Heinz carries $19B of total debt against a 1.1 current ratio and $2.7B of cash, so liquidity is tight but not broken. Net debt/EBITDA is 3.0x, which is manageable for a packaged-food business, yet it leaves less room for error if operating cash flow weakens.
Operating cash flow was $4.6B TTM and levered free cash flow was $3.3B TTM, with FCF margin at 13.1%, so the business still converts earnings into cash well enough to service debt and fund the dividend. The catch is earnings quality: EBITDA margin was 22.1% TTM, but net margin was -13.6% TTM, which tells me non-operating items and below-the-line charges are still heavy.
Insider Activity
The insider transaction record I see here is net buying, led by one large open-market purchase from the CEO on 2026-05-12, while the only open-market sales are two smaller trades by one executive in early March 2026. The sample is limited, but the pattern is still directionally supportive because insiders are not selling into weakness in a broad way.
Comparable Analysis
Growth
| Company | Revenue TTM (USD Mil) | Revenue Growth YoY % | EBITDA TTM (USD Mil) | Diluted EPS TTM |
|---|---|---|---|---|
| KHC | 24,900 | -1.4% | 5,493 | -2.9 |
| HRL | 12,146.9 | -2.4% | 1,264.9 | 0.6 |
| KR | 149,326 | 2.0% | 8,043 | 1.8 |
| KO | 50,129 | 6.7% | 16,998 | 3.3 |
| GIS | 18,296.6 | -2.8% | 3,415 | -1.6 |
| CPB | 9,744 | -7.9% | 1,620 | 1.3 |
Source: Yahoo Finance
KHC’s revenue fell 1.4% TTM, while HRL declined 2.4%, GIS declined 2.8%, and CPB declined 7.9%, but KR still grew 2.0% and KO grew 6.7%. That mix says KHC is not the worst top-line name, yet it is still losing volume or price in a category where KR and KO are still expanding.
Valuation
| Company | Current Share Price (USD) | Trailing P/E | Forward P/E | EV/Revenue | EV/EBITDA | Price/Sales (TTM) | Price/Book (mrq) | Market Cap (USD Mil) | Enterprise Value (USD Mil) | Beta (5Y Monthly) | FCF Yield % (TTM) | Forward EPS | Analyst Target Price – Low | Analyst Target Price – Mean | Analyst Target Price – High | # Analyst Opinions |
|---|---|---|---|---|---|---|---|---|---|---|---|---|---|---|---|---|
| KHC | 23.7 | — | 11.4 | 1.8 | 8.1 | 1.1 | 0.8 | 28,080 | 44,524 | 0.11 | 11.6% | 2.1 | 19 | 24.8 | 41 | 18 |
| HRL | 20.4 | 32.9 | 13 | 1.1 | 10.5 | 0.9 | 1.4 | 11,227 | 13,230 | 0.29 | 5.5% | 1.6 | 23 | 25.3 | 29 | 8 |
| KR | 63.6 | 35.4 | 11.6 | 0.4 | 7.5 | 0.3 | 6.5 | 37,579 | 60,067 | 0.35 | 6.8% | 5.5 | 57 | 68.3 | 85 | 22 |
| KO | 93.9 | 28.2 | 26.7 | 8.7 | 25.5 | 8.1 | 11.2 | 404,009 | 434,064 | 0.32 | 1.3% | 3.5 | 75 | 94.7 | 104 | 23 |
| GIS | 33.1 | — | 10.5 | 1.7 | 9.1 | 1 | 2.4 | 17,714 | 30,910 | 0.02 | 7.3% | 3.2 | 30 | 37 | 45 | 18 |
| CPB | 19.9 | 15.2 | 10.8 | 1.4 | 8.2 | 0.6 | 1.5 | 5,926 | 13,288 | 0.04 | 10.7% | 1.8 | 16 | 20.8 | 41.5 | 17 |
Source: Yahoo Finance
KHC trades at 1.8x EV/Revenue, 11.4x forward P/E, and 11.6% FCF yield TTM, versus HRL at 1.1x, 13.0x, and 5.5%, KR at 0.4x, 11.6x, and 6.8%, KO at 8.7x, 26.7x, and 1.3%, GIS at 1.7x, 10.5x, and 7.3%, and CPB at 1.4x, 10.8x, and 10.7%. KHC’s FCF yield is the best in the set, which supports a value lens, but its forward EPS of 2.08 sits below KR’s $5.5 and KO’s $3.5, so the stock is priced for cash generation rather than earnings leadership.
Profitability
| Company | Operating Margin (TTM) | Net Margin (TTM) | Return on Assets (TTM) | Return on Equity (TTM) | Gross Margin (TTM) | EBITDA Margin (TTM) |
|---|---|---|---|---|---|---|
| KHC | 15.5% | -13.6% | 3.6% | -8.8% | 33.5% | 22.1% |
| HRL | 8.6% | 2.8% | 4.6% | 4.3% | 15.7% | 10.4% |
| KR | 3.0% | 0.7% | 5.8% | 14.4% | 23.9% | 5.4% |
| KO | 34.9% | 28.6% | 9.4% | 42.1% | 61.9% | 33.9% |
| GIS | 15.2% | -4.9% | 5.6% | -10.5% | 33.7% | 18.7% |
| CPB | 10.2% | 4.1% | 4.9% | 10.1% | 28.5% | 16.6% |
Source: Yahoo Finance
KHC’s 15.5% operating margin and 22.1% EBITDA margin exceed HRL’s 8.6% and 10.4%, GIS’s 15.2% and 18.7%, and CPB’s 10.2% and 16.6%, while KO leads at 34.9% and 33.9%. The gross margin gap is the key tell: KHC’s 33.5% is well above HRL’s 15.7% and CPB’s 28.5%, which suggests the issue is not cost of goods but a heavier operating expense load than KO’s.
Leverage
| Company | Total Debt/Equity % (mrq) | Current Ratio (mrq) | Total Debt (mrq, USD Mil) | Operating Cash Flow TTM (USD Mil) | Free Cash Flow TTM (USD Mil) | Net Debt/EBITDA (TTM) | FCF Margin % (TTM) |
|---|---|---|---|---|---|---|---|
| KHC | 52.6 | 1.1 | 19,001 | 4,621 | 3,250.5 | 3 | 13.1% |
| HRL | 36.3 | 1.9 | 2,855.1 | 1,091.7 | 621.5 | 1.6 | 5.1% |
| KR | 413.2 | 0.7 | 24,158 | 6,708 | 2,535.5 | 2.8 | 1.7% |
| KO | 115.5 | 1.3 | 44,261 | 16,342 | 5,218.8 | 1.6 | 10.4% |
| GIS | 182.4 | 0.7 | 13,615.6 | 2,067 | 1,302.6 | 3.9 | 7.1% |
| CPB | 179.3 | 0.8 | 7,450 | 1,039 | 634.5 | 4.4 | 6.5% |
Source: Yahoo Finance
KHC’s 52.59% debt/equity and 3.0x net debt/EBITDA are above HRL’s 36.3% and 1.6x, but below GIS’s 182.4% and 3.9x and CPB’s 179.3% and 4.4x; KR is more levered on debt/equity at 413.2% but similar on net debt/EBITDA at 2.8x because of its larger cash base. KHC’s 13.1% FCF margin is stronger than HRL’s 5.1%, KR’s 1.7%, GIS’s 7.1%, and CPB’s 6.5%, which means the balance sheet is not a constraint on equity value and the cash conversion is better than most peers.
Conclusion
The tension in this name is straightforward: Kraft Heinz has enough cash generation to support the stock, but the operating numbers have not yet shown that the cash yield is backed by durable growth. That is why I stay at Hold. The latest quarter’s revenue decline and the TTM net loss are not what I want to see if the stock is going to deserve a higher multiple, even though the 11.6% FCF yield and 3.0x net debt/EBITDA keep the downside from looking severe.
I would raise my rating more toward a Buy if revenue turns positive for two consecutive quarters and levered free cash flow stays at or above 13% of sales, because that would show the cash yield is being supported by real demand rather than cost cutting alone. If operating margin also moves above 16.0%, meaning the business is converting more of each sales dollar into profit, that would make the current multiple look too low for a more durable earnings stream. On the other side, I would move from Hold to Sell if levered free cash flow falls below 10% of sales, because that would mean the current cash yield is no longer strong enough to offset the weak top line and the $19B debt load.
My final view is still Hold because the cash flow base is strong enough to absorb the balance-sheet burden, and the recent liability-management actions reduce near-term refinancing risk. What I am waiting for now is not another financial engineering step, but a cleaner revenue trend that proves the brands can still grow in a tougher shelf environment.
What to Watch Next
- Revenue positive for two straight quarters — would support a move toward Buy.
- Levered free cash flow at or above 13% of sales — would confirm the cash yield is durable.
- Operating margin above 16.0% — would show better conversion of sales into profit.
- FCF margin below 10% — would push the rating toward Sell.
- Further debt maturity extensions — would keep refinancing risk contained.
What’s your take? I rated Kraft Heinz (KHC) HOLD above — but the goal here is to get this right, not just to publish an opinion. What would you add to this analysis, or which risk or catalyst do you think I’m under- or over-weighting? Tell me in the comments.
Sources
- SEC 10-K Annual Report — filed 2026-02-12
- SEC 8-K Filing (2026-06-08)
- SEC 8-K Filing (2026-05-21)
- SEC 8-K Filing (2026-05-19)
- SEC 8-K Filing (2026-05-13)
- SEC 8-K Filing (2026-05-07)
- SEC 8-K Filing (2026-05-06)
- SEC Form 4 Insider Transaction (2026-05-18)
- SEC Form 4 Insider Transaction (2026-05-18)
- SEC Form 4 Insider Transaction (2026-05-18)
- SEC 10-K Annual Report — FY2026
- SEC 10-K Annual Report — FY2025
- SEC 10-K Annual Report — FY2024
- SEC 10-K Annual Report — FY2023
- SEC 10-K Annual Report — FY2022
Data sourced from Yahoo Finance and SEC EDGAR. Not investment advice.
Leave a Comment