| Company | Jul 25 | Aug 25 | Sep 25 | Oct 25 | Nov 25 | Dec 25 | Jan 26 | Feb 26 | Mar 26 | Apr 26 | May 26 | Jun 26 | 12-Mo |
|---|---|---|---|---|---|---|---|---|---|---|---|---|---|
| AIR | +9% | +1% | +19% | -6% | -1% | -1% | +28% | +11% | -7% | +1% | +2% | +27% | +108% |
| CW | +0% | -2% | +14% | +10% | -5% | -2% | +19% | +7% | -3% | +6% | +4% | +1% | +55% |
| HWM | -3% | -3% | +13% | +5% | -1% | +0% | +1% | +26% | -12% | +5% | +6% | +4% | +45% |
| HXL | +6% | +6% | -1% | +14% | +7% | -3% | +12% | +12% | -13% | +16% | -4% | +11% | +79% |
| TDG | +6% | -13% | +1% | -1% | +4% | -2% | +7% | -9% | -11% | +0% | +8% | +6% | -6% |
| TXT | -3% | +3% | +5% | -4% | +3% | +5% | +1% | +12% | -11% | +10% | -4% | -0% | +14% |
Source: Yahoo Finance monthly adjusted close.
Executive Summary
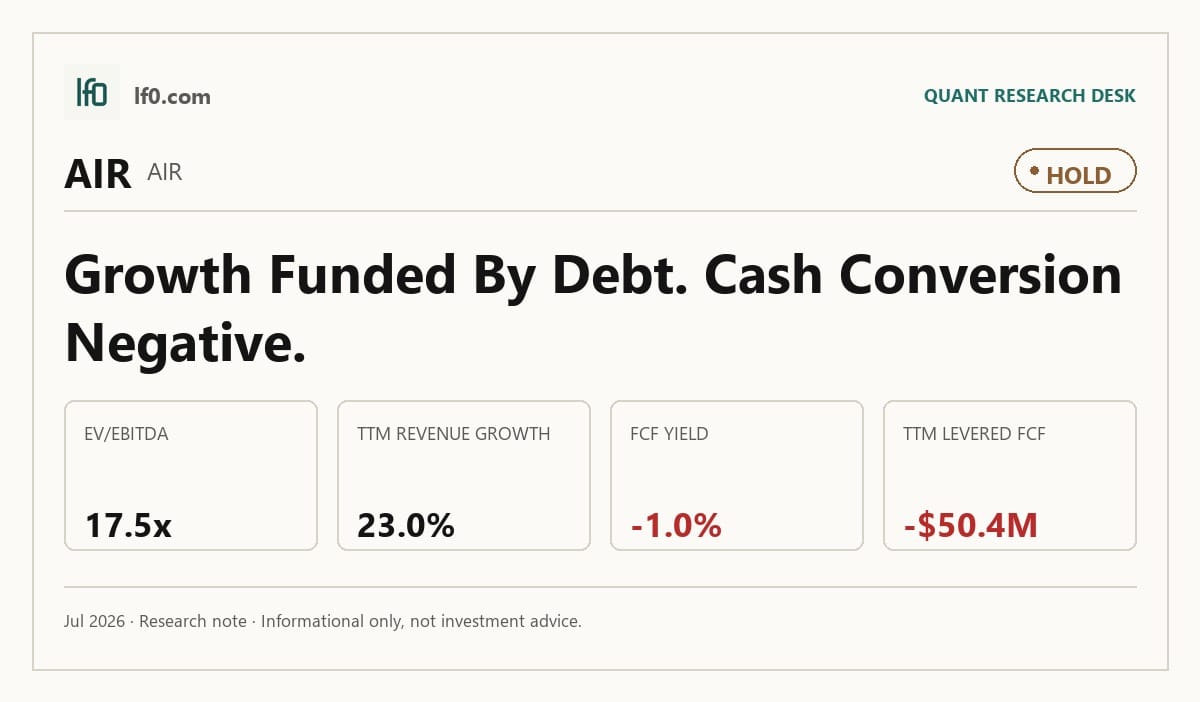
Rating: HOLD | AIR
Measured from adjusted close on 2026-07-27 to 2026-09-09. Sell ratings are correct when the stock falls; Hold is tracked as a +/-10% range. Daily-close data, not intraday. Calls are tracked for 182 days from publication, then frozen as a final record.
I would put my rating as a Hold because AAR has real aftermarket depth, but the stock already prices in a lot of the improvement at 17.5x EV/EBITDA while free cash flow remains negative. The moat is tangible: OEM approvals, FAA-certificated repair stations, and the Trax installed base support recurring work, yet the latest numbers still show only 10.4% EBITDA margin and -$50.4M of levered free cash flow, so the equity is being asked to pay for cash generation that has not fully arrived. I would become more constructive if quarterly EBITDA holds above $110M, which would show the post-acquisition mix is still supporting margin rather than just revenue.
Company Profile
AAR CORP. was incorporated in 1955 and trades on the New York Stock Exchange under AIR. It is a global aviation aftermarket provider with four segments: Parts Supply, Repair & Engineering, Integrated Solutions, and Expeditionary Services. Parts Supply sells OEM replacement parts and used serviceable material, Repair & Engineering performs airframe maintenance, component repair, landing gear overhaul, and PMA work, Integrated Solutions provides fleet management and logistics software through Trax USA Corp., and Expeditionary Services supplies pallets, containers, shelters, and command systems for government customers.
The company operates in more than 20 countries and had 13 FAA-certificated repair stations across the United States, Canada, Asia, and Europe as of fiscal 2024. It employed about 5,700 people worldwide at May 31, 2024, including the Trax and Product Support acquisitions. AAR went public long before the current roll-up strategy, then expanded materially through Trax in fiscal 2023 and Triumph Group’s Product Support business for $725.0M in fiscal 2024.
Economic Moat
Business Model
The clearest structural advantage is AAR’s access to OEM parts distribution and repair work. In most cases, it enters exclusive relationships with original equipment manufacturers for a given market, and according to its SEC filings it is an authorized distributor for more than 30 product lines sourced from over 20 leading OEMs. In my view, that network is hard to replicate quickly because the value sits in long-standing approvals, FAA-certificated repair stations, and customer relationships rather than capital alone.
Trax adds a second layer of stickiness. The software platform supports fleet management for about 5,000 aircraft and more than 130 customers with an average tenure of over 10 years, which makes the installed base harder to dislodge and gives AAR a cross-sell path into parts and maintenance. The INL A WASS contract, a 10-year performance-based contract for the U.S. Department of State fleet, is another anchor because it locks in a long-duration government operating role.
Business & Operating Risks
The main disclosed risk is the commercial aviation cycle, because AAR derived $1.6B of commercial sales in fiscal 2024, or 71.0% of consolidated sales. According to the risk factors in its SEC 10-K, the company is exposed to geopolitical events, high fuel prices, tight credit markets, and customer bankruptcies, all of which can reduce demand for parts support and maintenance while making receivables harder to collect. A rough sensitivity is straightforward: if 5.0% of commercial sales were delayed or lost, that would be about $81.9M of annual revenue pressure before any margin effect.
Government contract concentration is the next headwind. AAR generated $576.1M of U.S. government sales in fiscal 2024, or 24.8% of consolidated sales, and those contracts are typically one-year base terms with optional annual extensions, so budget delays can hit revenue visibility quickly. The filing also flags future budget cuts and sequestration, which would matter because the government book is large enough that even a modest funding pause would show up in quarterly results.
Execution risk on fixed-price and long-term contracts is also material. AAR uses estimates for flight hours, repair costs, labor hours, penalties, and incentives, and it bears most of the risk if unexpected costs reduce profit or create losses. That risk is not abstract: if labor, materials, or fuel costs rise faster than pricing resets, the damage can linger for the full contract term.
These risks do not break the moat itself, but they do test it. The commercial cycle and contract-execution exposure pressure the earnings stream that the OEM and software relationships are meant to protect, so the moat is intact but not immune.
Management Discussion & Analysis
Management is responding to those risks by leaning into scale and liquidity, although the cash conversion is still lagging. The $725M Product Support acquisition broadened the commercial and defense footprint, and it was funded with $186.2M drawn on the Amended Revolving Credit Facility and $550.0M of 6.75% Senior Notes due 2029. The company also raised the revolving commitment to $825M from $620M and can request up to $1.125B in total commitments, which tells me management is prioritizing flexibility and acquisition capacity over near-term deleveraging.
Operationally, management is backing the growth narrative with capacity expansion, including new hangars in Miami and Oklahoma City, with a target to increase MRO network capacity by about 15% upon completion in fiscal 2026. That supports the thesis only if demand stays at the record MRO levels management cites. The gap is that selling, general and administrative expenses rose $81.8M, or 35.5%, in fiscal 2024 while operating income fell $4.7M, or 3.5%, so the promised margin benefit has not yet shown up in the consolidated numbers.
Management’s track record is mixed but not poor. The business was reorganized into four segments in fiscal 2024, and the transition was disclosed cleanly without an impairment surprise. The prior-year narrative leaned on commercial aftermarket strength, and fiscal 2024 did deliver 23.3% commercial sales growth to $1.6B and 29.6% gross profit growth to $322.8M, which confirms that part of the call. In my view, management is actively addressing the scale side of the risk set, but the leverage and expense burden still need to prove themselves in cash flow.
Recent Events
The most important recent development is the December 19, 2024 divestiture of the Landing Gear Overhaul business to GA Telesis for $51M. Management plans to use substantially all proceeds to repay borrowings under the credit agreement, which strengthens the balance sheet and suggests a sharper focus on higher-return aviation services. The same filing also flags a roughly $60M non-cash pre-tax loss in fiscal Q3 2025 from marking the business to fair value less costs to sell, so the transaction helps strategically but creates a near-term accounting hit.
I also view the December 19, 2024 resolution of the Foreign Corrupt Practices Act investigations as important. AAR reached a Non-Prosecution Agreement with the Department of Justice and a settlement with the Securities and Exchange Commission, with total payments of $55.6M funded through cash and revolver borrowings. That removes a long-running legal overhang, but it also reduces near-term capital flexibility.
Taken together, these 8-Ks support portfolio simplification and legal cleanup, while leaving the leverage and cash deployment story under some pressure.
Financial Analysis
Growth
AIR — Financial Growth (Quarterly, USD Mil)
| Metric | 2025-02-28 | 2025-05-31 | 2025-08-31 | 2025-11-30 | 2026-02-28 | 2026-05-31 |
|---|---|---|---|---|---|---|
| REVENUE (USD Mil) | — | 754.5 | 739.6 | 795.3 | 845.1 | 928 |
| EBIT (USD Mil) | — | 66.4 | 65.8 | 67.2 | 110.6 | 74.4 |
| EBITDA (USD Mil) | — | 80.1 | 79.6 | 84.3 | 130.8 | 95.4 |
| NET INCOME (USD Mil) | — | 34 | 34.4 | 34.6 | 68 | 50.7 |
| DILUTED EPS | -0.2 | 0.9 | 0.9 | 0.9 | 1.7 | — |
Source: Yahoo Finance — Quarterly Financial Statements
AAR’s revenue accelerated across the latest quarters, reaching $928M in the quarter ended May 31, 2026 from $754.5M in the quarter ended May 31, 2025. That 23.0% increase is the right kind of top-line momentum, and it is consistent with the broader aftermarket expansion described above. EBITDA rose to $130.8M in the quarter ended February 28, 2026 before easing to $95.4M in the latest quarter despite higher sales, which tells me the growth engine is real but still sensitive to mix and cost timing.
Profitability
AIR — Profitability (TTM)
| Metric | TTM |
|---|---|
| Operating Margin (TTM) | 8.4% |
| Net Margin (TTM) | 5.7% |
| Return on Assets (TTM) | 5.5% |
| Return on Equity (TTM) | 12.9% |
| Gross Margin (TTM) | 18.8% |
| EBITDA Margin (TTM) | 10.4% |
Source: Yahoo Finance — Trailing Twelve Months (TTM)
AAR’s TTM gross margin of 18.8% sits well above its TTM operating margin of 8.4%, so the core product and service layer is healthy but overhead is still absorbing a large share of revenue. EBITDA margin of 10.4% is only modestly above operating margin, which means depreciation and amortization are not the main issue; the bigger question is operating leverage. Net margin of 5.7% shows the business is profitable, but the gap versus gross margin says AAR is still in an earlier scaling phase rather than a fully mature margin profile.
Capital efficiency is solid but not elite. TTM ROE of 12.9% is more than double TTM ROA of 5.5%, which implies returns are being amplified by leverage rather than pure asset productivity. I would watch for operating margin moving closer to gross margin, because that would show overhead is being spread across a larger base and would make the moat look more durable in financial terms.
Valuation
AIR — Valuation Multiples
| Metric | Value |
|---|---|
| Market Cap (USD Mil) | 5,148 |
| Enterprise Value (USD Mil) | 6,011 |
| Trailing P/E | 26.5 |
| Forward P/E | 19.8 |
| Price/Sales (TTM) | 1.6 |
| Price/Book (mrq) | 3 |
| EV/Revenue | 1.8 |
| EV/EBITDA | 17.5 |
| Beta (5Y Monthly) | 1.09 |
| FCF Yield % (TTM) | -1.0% |
| Forward EPS (USD) | 6.5 |
| Analyst Target Price – Low (USD) | 128 |
| Analyst Target Price – Mean (USD) | 141 |
| Analyst Target Price – High (USD) | 155 |
| # Analyst Opinions | 5 |
Source: Yahoo Finance
AAR trades at 17.5x EV/EBITDA and 1.82x EV/revenue on TTM results, with a trailing P/E of 26.5x and a forward P/E of 19.8x. The primary read is the EV/EBITDA multiple: at 17.5x, the market is pricing in sustained earnings power and little room for a margin reset, which is demanding for a business with a 10.4% EBITDA margin and negative free cash flow.
The stock also screens at 1.56x price/sales and 2.98x price/book, both of which point to a premium valuation rather than a cheap one. Book value per share is $43.27, while the implied share price from market cap and shares outstanding is about $129, so the stock trades at roughly 3.0x book and about 3.0x cash per share of $2.133. FCF yield is -1.0% because levered free cash flow was -$50.4M, or about -$1.3 per share, so the equity is not being priced on current cash generation.
On the analysis here, I would put fair value in a range of $128-$155, which is essentially the analyst target band from 5 opinions. That range sits around the current quote and slightly below the $141 mean, so I feel the market is already giving AAR credit for the recovery before the cash flow proof is there. My EPS view is $6.3-$6.8, which brackets the company’s $6.53 forward EPS and implies the stock is not obviously cheap on a like-for-like earnings basis versus peers with stronger cash conversion.
Leverage
AIR — Leverage & Coverage (Quarterly)
| Metric | Value |
|---|---|
| Total Debt/Equity % (mrq) | 59.4 |
| Current Ratio (mrq) | 2.8 |
| Total Debt (mrq, USD Mil) | 1,012 |
| Operating Cash Flow (TTM, USD Mil) | 98.7 |
| Levered Free Cash Flow (TTM, USD Mil) | -50.4 |
| Net Debt/EBITDA (TTM) | 2.7 |
| FCF Margin % (TTM) | -1.5% |
Source: Yahoo Finance — Quarterly Financial Statements
AAR’s leverage is manageable but not cheap. Total debt/equity was 59.4% and current ratio was 2.841x, while total debt was $1,012M. That gives the company near-term liquidity room, so a refinancing does not look urgent today.
Operating cash flow was $98.7M, but levered free cash flow was -$50.36M and FCF margin was -1.52%, which means EBITDA is not fully converting into residual cash after capex and financing costs. Net debt/EBITDA was 2.7x, a level that is serviceable but leaves less cushion if earnings soften or rates stay elevated. In my opinion, this is medium refinancing risk because the current ratio and cash flow cover day-to-day obligations, but negative FCF means the balance sheet is gradually absorbing pressure rather than building flexibility.
Insider Activity
The insider transaction record is one-sided: 37 open-market sales and 0 open-market purchases over 2025-01-10 to 2026-06-01, so insiders are net sellers. The activity is concentrated, led by Chairman, President & CEO John McClain Holmes III, with additional selling from Jessica A. Garascia, Billy Nolen, and Sarah Louise Flanagan. I read that as a bearish signal, but not a decisive one on its own, because the transaction list shows distribution rather than a single isolated sale.
Comparable Analysis
Growth
| Company | Revenue TTM (USD Mil) | Revenue Growth YoY % | Diluted EPS TTM |
|---|---|---|---|
| AIR | 3,308 | 23.0% | 4.9 |
| CW | 3,606.4 | 13.4% | 13.7 |
| HWM | 8,623 | 19.1% | 0.2 |
| HXL | 1,938.9 | 9.9% | 1.5 |
| TDG | 9,503 | 18.3% | 32 |
| TXT | 15,188 | 11.8% | 5.2 |
Source: Yahoo Finance
AAR’s revenue growth of 23.0% TTM is ahead of CW at 13.4%, HWM at 19.1%, HXL at 9.9%, TDG at 18.3%, and TXT at 11.8%, so the market is paying for a faster top line than most of the peer set. AIR’s quarterly earnings growth of 32.3% also compares well with that growth profile, which tells me the expansion is still converting into profit rather than just volume.
Valuation
| Company | Trailing P/E | Forward P/E | EV/Revenue | EV/EBITDA | Price/Sales (TTM) | Price/Book (mrq) | Beta (5Y Monthly) | FCF Yield % (TTM) | Forward EPS | Analyst Target Price – Low | Analyst Target Price – Mean | Analyst Target Price – High | # Analyst Opinions |
|---|---|---|---|---|---|---|---|---|---|---|---|---|---|
| AIR | 26.5 | 19.8 | 1.8 | 17.5 | 1.6 | 3 | 1.09 | -1.0% | 6.5 | 128 | 141 | 155 | 5 |
| CW | 55 | 43.9 | 7.9 | 34.6 | 7.7 | 10.5 | 0.86 | 1.9% | 17.1 | 768 | 822.2 | 870 | 6 |
| HWM | 1,701.5 | 47.8 | 13.7 | 46.1 | 13.4 | 21 | 1.19 | 1.0% | 6.1 | 256.6 | 311.7 | 346 | 20 |
| HXL | 73 | 34.5 | 4.8 | 26.8 | 4.3 | 6.6 | 1.05 | 2.2% | 3.2 | 81 | 98.9 | 116 | 14 |
| TDG | 38.6 | 26.3 | 10.2 | 20.1 | 7.3 | -7.5 | 0.88 | 2.2% | 47 | 1,200 | 1,509 | 1,937 | 20 |
| TXT | 18.2 | 13.1 | 1.3 | 11.5 | 1.1 | 2.1 | 0.91 | 3.8% | 7.3 | 90 | 101.9 | 115 | 16 |
Source: Yahoo Finance
AAR’s FCF yield is -1.0% TTM, weaker than CW at 1.9%, HWM at 1.0%, HXL at 2.2%, TDG at 2.2%, and TXT at 3.8%, so on cash generation AAR is the least attractive name in the group. That sits alongside AAR’s 26.5x trailing P/E, 19.8x forward P/E, 1.82x EV/revenue, and 17.5x EV/EBITDA, all of which are richer than TXT at 18.2x, 13.1x, 1.3x, and 11.5x, but cheaper than CW at 55.0x, 43.9x, 7.9x, and 34.6x and HWM at 1,701.5x, 47.8x, 13.7x, and 46.1x.
Using peer EV/revenue of 1.3x to 13.7x on AAR’s $3.3B TTM revenue gives an illustrative enterprise value range of about $4.3B to $45.4B, or roughly $86 to $1,015 per share after netting AAR’s $1B debt and $84M cash and dividing by 39.9M shares. The range is mathematically wide because the peer set spans lower-quality industrial names and premium aerospace names, but the important point is that AAR’s growth is not being rewarded with a cash-flow premium the way the strongest peers are.
Profitability
| Company | Operating Margin (TTM) | Net Margin (TTM) | Return on Assets (TTM) | Return on Equity (TTM) | Gross Margin (TTM) | EBITDA Margin (TTM) |
|---|---|---|---|---|---|---|
| AIR | 8.4% | 5.7% | 5.5% | 12.9% | 18.8% | 10.4% |
| CW | 17.6% | 14.2% | 8.6% | 19.7% | 37.2% | 22.8% |
| HWM | 28.2% | 20.2% | 11.9% | 33.8% | 35.0% | 29.7% |
| HXL | 12.6% | 6.1% | 5.0% | 8.4% | 24.1% | 17.8% |
| TDG | 46.7% | 21.9% | 11.8% | — | 59.7% | 51.0% |
| TXT | 8.0% | 6.2% | 4.6% | 12.3% | 17.8% | 11.1% |
Source: Yahoo Finance
AAR’s gross margin of 18.8%, EBITDA margin of 10.4%, operating margin of 8.4%, and net margin of 5.7% all trail CW at 37.2%, 22.8%, 17.6%, and 14.2%, HWM at 35.0%, 29.7%, 28.2%, and 20.2%, and TDG at 59.7%, 51.0%, 46.7%, and 21.9%. The gap is mostly structural and scale-related rather than a one-off cost issue, because AAR’s margins are closer to HXL’s 24.1%, 17.8%, 12.6%, and 6.1% and TXT’s 17.8%, 11.1%, 8.0%, and 6.2%, which points to a mid-tier industrial profile rather than best-in-class pricing power.
Leverage
| Company | Total Debt/Equity % (mrq) | Current Ratio (mrq) | Total Debt (mrq, USD Mil) | Operating Cash Flow TTM (USD Mil) | Net Debt/EBITDA (TTM) | FCF Margin % (TTM) |
|---|---|---|---|---|---|---|
| AIR | 59.4 | 2.8 | 1,012 | 98.7 | 2.7 | -1.5% |
| CW | 43.6 | 1.5 | 1,148.4 | 676.5 | 1 | 14.5% |
| HWM | 87.8 | 2.4 | 4,848 | 2,084 | 0.9 | 13.8% |
| HXL | 78.8 | 2.5 | 998.1 | 278 | 2.7 | 9.5% |
| TDG | — | 3.5 | 32,003 | 2,105 | 5.8 | 16.1% |
| TXT | 52.7 | 1.8 | 4,215 | 1,319 | 1.6 | 4.1% |
Source: Yahoo Finance
AAR’s debt/equity of 59.4% and net debt/EBITDA of 2.7x are moderate next to CW at 43.6% and 1.0x, HWM at 87.8% and 0.9x, HXL at 78.8% and 2.7x, TDG at 5.8x net debt/EBITDA, and TXT at 52.7% and 1.6x. AAR’s FCF margin of -1.52% is the weak point, because CW, HWM, HXL, TDG, and TXT all generate positive FCF margins of 14.5%, 13.8%, 9.5%, 16.1%, and 4.1%, so AAR is funding growth with earnings rather than cash and that limits balance-sheet flexibility if demand softens. That also explains part of the valuation gap: peers with stronger cash conversion can justify richer multiples more easily.
Conclusion
I would put my rating as a Hold because the central tension is still unresolved: AAR has the revenue growth and franchise quality to justify attention, but it has not yet converted that growth into positive free cash flow. The latest quarter showed $928M of revenue and $95.4M of EBITDA, which is enough to support the thesis, yet levered free cash flow remains -$50.36M TTM and net debt is still 2.7x EBITDA, so the balance sheet is carrying the burden while the operating model catches up.
I would raise my rating more towards a Buy if quarterly EBITDA stays above $110M and levered free cash flow turns positive, because that would show the acquisition-led platform is funding itself rather than leaning on debt. I would move from Hold to Sell if quarterly revenue slips below $800M for two consecutive quarters, because that would suggest the current growth rate was more cyclical than structural, or if levered free cash flow stays negative while net debt remains near $1,012M. In that case, the 2.7x net debt/EBITDA ratio would stop looking manageable and start looking like a constraint on future deal-making and buyback capacity.
Weighing both sides, I think the market is already giving AAR credit for the recovery before the cash flow proof is there. The next move is more likely to be sideways than sharply higher unless management shows that the recent revenue step-up can hold while free cash flow turns positive, and that is the evidence I would need before moving off Hold.
What’s your take? I rated AAR Corp (AIR) HOLD above — but the goal here is to get this right, not just to publish an opinion. What would you add to this analysis, or which risk or catalyst do you think I’m under- or over-weighting? Tell me in the comments.
Sources
- SEC 10-K Annual Report — filed 2024-07-19
- SEC 8-K Filing (2024-12-20)
- SEC 8-K Filing (2024-12-19)
- SEC 8-K Filing (2024-09-23)
- SEC 8-K Filing (2024-09-17)
- SEC 8-K Filing (2024-09-04)
- SEC 8-K Filing (2024-07-18)
- SEC Form 4 Insider Transaction (2026-06-03)
- SEC Form 4 Insider Transaction (2026-06-03)
- SEC Form 4 Insider Transaction (2026-06-03)
- SEC 10-K Annual Report — FY2024
- SEC 10-K Annual Report — FY2023
- SEC 10-K Annual Report — FY2022
- SEC 10-K Annual Report — FY2021
- SEC 10-K Annual Report — FY2020
Data sourced from Yahoo Finance and SEC EDGAR. Not investment advice.
Leave a Comment