
| Company | Jul 25 | Aug 25 | Sep 25 | Oct 25 | Nov 25 | Dec 25 | Jan 26 | Feb 26 | Mar 26 | Apr 26 | May 26 | Jun 26 | 12-Mo |
|---|---|---|---|---|---|---|---|---|---|---|---|---|---|
| CI | -19% | +13% | -4% | -15% | +13% | -0% | -0% | +6% | -7% | +9% | -5% | -0% | -15% |
| UNH | -20% | +24% | +12% | -1% | -3% | +1% | -13% | +2% | -7% | +37% | +3% | +10% | +37% |
| CVS | -9% | +18% | +3% | +5% | +3% | -1% | -5% | +7% | -10% | +17% | +9% | +14% | +55% |
| CNC | -52% | +11% | +23% | -1% | +11% | +5% | +5% | +4% | -27% | +64% | +11% | +8% | +18% |
| ELV | -27% | +13% | +2% | -2% | +7% | +4% | -1% | -7% | -8% | +29% | +4% | -1% | +2% |
| HUM | +2% | +22% | -14% | +7% | -12% | +5% | -24% | -2% | -9% | +36% | +29% | +30% | +65% |
Source: Yahoo Finance monthly adjusted close.
Executive Summary
Rating: HOLD | CI
Measured from adjusted close on 2026-07-27 to 2026-10-23. Sell ratings are correct when the stock falls; Hold is tracked as a +/-10% range. Daily-close data, not intraday. Calls are tracked for 182 days from publication, then frozen as a final record.
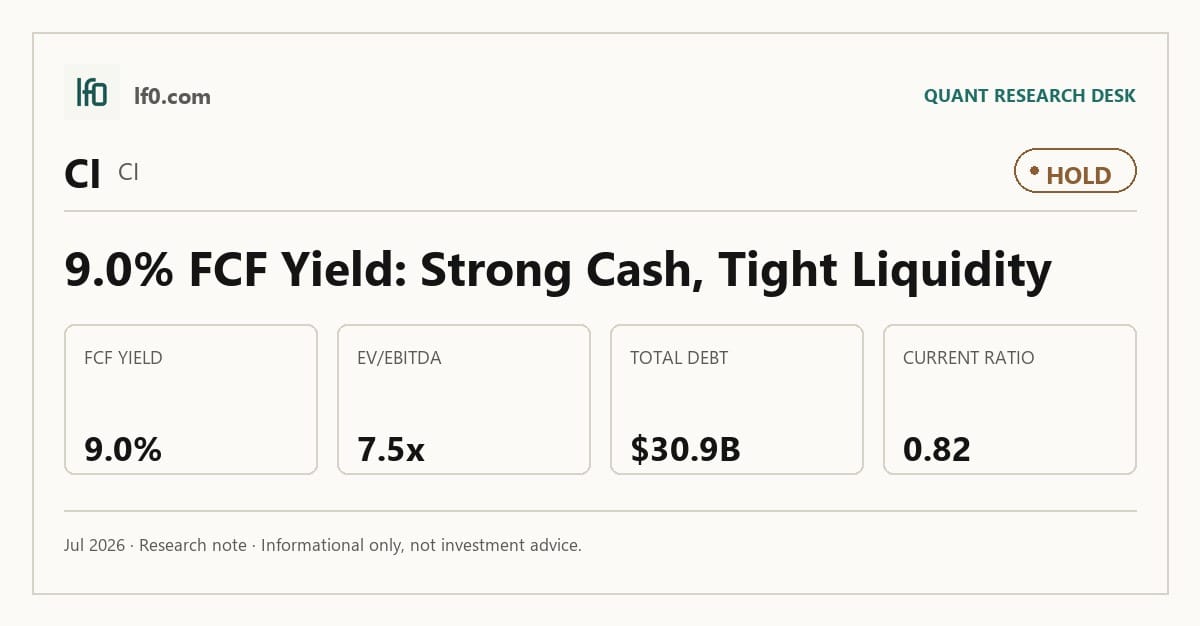
I would put my rating as a Hold because The Cigna Group has a durable cash engine, but the post-divestiture earnings base is still proving itself. The company generated a 9.0% FCF yield and 1.72x net debt to EBITDA, which supports the equity, yet 4.6% TTM revenue growth and 2.3% net margin are only mid-pack for a business the market is already valuing as stable. In my view, the most important near-term test is whether the savings program lifts operating margin above the current 5.5% TTM level, meaning the portfolio reset is translating into better earnings quality rather than just a cleaner structure.
Company Profile
The Cigna Group is a global health company serving more than 185 million customer relationships across more than 30 markets and jurisdictions as of December 31, 2025. It earns revenue through Evernorth Health Services, which provides pharmacy benefit services, specialty pharmacy, and care services, and through Cigna Healthcare, which sells U.S. medical plans, administrative services only arrangements, and international health coverage. The company was incorporated in Delaware in 1981 through predecessor companies and now operates with two core segments after the March 19, 2025 sale of its Medicare Advantage and related Medicare businesses to Health Care Service Corporation. It employs about 67,700 people worldwide and supports its platform with 11 Express Scripts home delivery pharmacies, 35 specialty pharmacies, 4 distribution centers, and a U.S. provider network of about 17 million physicians and over 6,000 hospitals. The stock trades on the New York Stock Exchange under CI.
Economic Moat
Business Model
The strongest part of the business is the combination of Evernorth Health Services and Cigna Healthcare, because it lets The Cigna Group connect pharmacy, medical, specialty, and care-management services across the same customer relationship and steer patients toward lower-cost, clinically appropriate care. That platform reached more than 185 million customer relationships and approximately 17 million relationships with health care providers, clinics, and facilities as of December 31, 2025, which I feel is hard for a well-funded competitor to replicate quickly because it depends on scale, provider access, claims infrastructure, and long-standing client contracts. Evernorth’s pharmacy technology platform can adjudicate over 2 billion adjusted prescriptions annually, and the company holds over 540 U.S. patents, which supports process control and product differentiation. The 2025 10-K also shows meaningful client concentration, with one pharmacy benefit client at approximately 19% of total revenue from external customers, so the moat is real but not immune to account risk.
Business & Operating Risks
The most material disclosed risk is pricing and medical cost misestimation. According to the risk factors in its SEC 10-K, relatively small differences between predicted and actual medical costs or utilization rates as a percentage of revenue can materially change results, and price remains a significant basis of competition while clients can renegotiate every three years in Express Scripts contracts. That pressure hits both the health benefits and pharmacy benefit businesses because a small underwriting miss or a tougher renewal can compress margins quickly. A second risk is client and pharmacy network concentration: more than 65,000 pharmacies participated in one or more networks as of December 31, 2025, and the 10 largest retail pharmacy chains represent approximately 47% of the total number of stores in the largest network, so a loss of one large chain would weaken claims volume and negotiating leverage. Regulatory pressure is another direct headwind, especially around premium rate changes, administrative fees, the Inflation Reduction Act, CMS drug-price negotiation, and rebate reform. Privacy, cyber, and AI risk also matter because the company processes protected health information and is already under scrutiny, including a 2025 voluntary Health and Human Services Office for Civil Rights audit response and litigation alleging improper AI use in claims evaluation. Taken together, these risks do not break the moat, but they do threaten the pricing discipline and network scale that make the model work.
Management Discussion & Analysis
Management is responding to those risks, but not all of them are fully resolved. The March 19, 2025 HCSC transaction simplified the portfolio and reduced Medicare exposure, while the company also renewed or extended its three largest clients through the end of the decade and pushed a rebate-free pharmacy benefits model to support longer-duration revenue. That is the right strategic response to concentration and pricing pressure, although the unresolved question is whether the margin benefit will show up fast enough to offset the transition costs. The company booked $749 million of pre-tax strategic optimization costs in 2025 and expects at least $500 million of annualized after-tax savings, but the 2025 numbers only partly validate that claim because consolidated adjusted income from operations rose just 4% to $8.0 billion while Evernorth’s pre-tax margin slipped to 3.1% from 3.5% in 2024. In my view, management is doing the right things, but the savings program still needs to prove itself in the reported margins.
Recent Events
The most important recent event is the CEO succession announced on February 25, 2026: Brian C. Evanko will become chief executive officer on July 1, 2026, while David M. Cordani moves to executive chair. Because Evanko has run both finance and Cigna Healthcare, I read this as continuity rather than a strategic reset, which supports the existing operating model instead of testing it. The company also reaffirmed at least 30.25 per share of consolidated adjusted income from operations for FY2026 on February 25, April 30, and May 13, 2026, which tells me management is still standing behind the earnings bridge after the first-quarter release. The April 22, 2026 annual meeting matters as well: shareholders re-elected the board, approved executive compensation, and ratified PricewaterhouseCoopers LLP, while the written-consent proposal failed, so governance pressure looks contained.
Financial Analysis
Growth
CI — Financial Growth (Quarterly, USD Mil)
| Metric | 2025-03-31 | 2025-06-30 | 2025-09-30 | 2025-12-31 | 2026-03-31 |
|---|---|---|---|---|---|
| REVENUE (USD Mil) | 65,264 | 66,942 | 69,515 | 72,133 | 68,292 |
| EBIT (USD Mil) | 2,010 | 2,358 | 2,642 | 2,179 | 2,627 |
| EBITDA (USD Mil) | 2,684 | 3,040 | 3,339 | 2,901 | 3,277 |
| NET INCOME (USD Mil) | 1,323 | 1,532 | 1,868 | 1,234 | 1,654 |
| DILUTED EPS | 4.8 | 5.7 | 7 | 4.6 | 6.3 |
Source: Yahoo Finance — Quarterly Financial Statements
Revenue rose from $65.3B in Q1 2025 to $72.1B in Q4 2025 before easing to $68.3B in Q1 2026, which still leaves the business 4.6% above the prior-year quarter. That pattern is better than a flat line, but it is not a clean acceleration story, so I would not extrapolate the late-2025 run rate without more evidence. EBITDA increased to $3.3B in Q1 2026 from $2.7B a year earlier, and net income rose to $1.7B from $1.3B, which shows the earnings base is still expanding even as the top line normalizes. The key point for me is that growth is enough to support the moat, but not yet strong enough to justify a premium multiple on its own.
Profitability
CI — Profitability (TTM)
| Metric | TTM |
|---|---|
| Operating Margin (TTM) | 5.5% |
| Net Margin (TTM) | 2.3% |
| Return on Assets (TTM) | 4.8% |
| Return on Equity (TTM) | 16.3% |
| Gross Margin (TTM) | 9.2% |
| EBITDA Margin (TTM) | 4.8% |
Source: Yahoo Finance — Trailing Twelve Months (TTM)
TTM operating margin was 5.5%, gross margin was 9.2%, EBITDA margin was 4.8%, net margin was 2.3%, ROA was 4.8%, and ROE was 16.3%. The spread between gross margin and operating margin is only 3.7 percentage points, which tells me the core cost structure is already fairly efficient and that the main issue is not a broken cost-of-revenue line. The bigger gap is between ROE and ROA: 16.3% ROE versus 4.8% ROA shows returns are being amplified by leverage rather than by exceptionally high asset productivity, so the equity return is more fragile if financing conditions tighten. That matters for the moat too, because the business can defend its scale advantage only if it keeps converting that scale into cash, not just accounting returns.
Valuation
CI — Valuation Multiples
| Metric | Value |
|---|---|
| Market Cap (USD Mil) | 76,601 |
| Enterprise Value (USD Mil) | 99,881 |
| Trailing P/E | 12.3 |
| Forward P/E | 8.6 |
| Price/Sales (TTM) | 0.3 |
| Price/Book (mrq) | 1.8 |
| EV/Revenue | 0.4 |
| EV/EBITDA | 7.5 |
| Beta (5Y Monthly) | 0.30 |
| FCF Yield % (TTM) | 9.0% |
| Forward EPS (USD) | 33.5 |
| Analyst Target Price – Low (USD) | 290 |
| Analyst Target Price – Mean (USD) | 340.9 |
| Analyst Target Price – High (USD) | 400 |
| # Analyst Opinions | 24 |
Source: Yahoo Finance
Cigna trades on a value lens, and the cleanest anchor is its 9.0% FCF yield, which is levered free cash flow as a percentage of market cap. At that level, the market is pricing in a business that can keep converting earnings into cash at a high single-digit rate, so the stock looks inexpensive if cash flow is durable. Trailing P/E is 12.3x and forward P/E is 8.6x, while EV/EBITDA is 7.5x and EV/Revenue is 0.4x, so the market is not paying a growth multiple for this name. With 24 analyst opinions, the target range of $290 to $400 and mean of $340.9 gives a meaningful consensus to compare against; on my read, fair value sits below that mean because I weight the modest 4.6% growth rate and the 2.3% net margin more heavily than the consensus appears to. I would put fair value in a range of roughly $250–$320, which sits below the analyst mean but still inside the broader sell-side band. On earnings power, I would frame a reasonable range around $31–$35 of EPS, which brackets the current forward EPS of 33.5 and implies the market is paying a modest multiple for a stable but not exceptional earnings stream. That looks cheaper than peers on a cash-yield basis, but not cheap enough to ignore the leverage and growth trade-off.
Leverage
CI — Leverage & Coverage (Quarterly)
| Metric | Value |
|---|---|
| Total Debt/Equity % (mrq) | 72.8 |
| Current Ratio (mrq) | 0.8 |
| Total Debt (mrq, USD Mil) | 30,900 |
| Operating Cash Flow (TTM, USD Mil) | 8,812 |
| Levered Free Cash Flow (TTM, USD Mil) | 6,923.4 |
| Net Debt/EBITDA (TTM) | 1.7 |
| FCF Margin % (TTM) | 2.5% |
Source: Yahoo Finance — Quarterly Financial Statements
Cigna carries $30.9B of total debt against a 0.8 current ratio, so near-term liquidity is tight rather than comfortable. TTM operating cash flow was $8.8B and levered free cash flow was $6.9B, which shows the business still converts earnings into cash well enough to service debt and keep flexibility for capital returns. Net debt/EBITDA is 1.7x and FCF margin is 2.5%, both consistent with manageable leverage for a large insurer, but the sub-1.0 current ratio means the working-capital cushion is limited if claims, integration costs, or refinancing needs rise. In my view, the balance sheet is serviceable, but it is not a source of upside.
Insider Activity
The insider transaction record is clearly net selling: 19 open-market sales, $73.9M total value, and no open-market purchases in the 2025-02-28 to 2026-06-01 window. The pattern is concentrated, with Chairman & CEO David Cordani accounting for the visible activity, so alignment looks weaker than it would if buying were broad-based across multiple insiders. I treat that as a caution flag rather than a thesis breaker.
Comparable Analysis
Growth
| Company | Revenue TTM (USD Mil) | Revenue Growth YoY % | EBITDA TTM (USD Mil) | Diluted EPS TTM |
|---|---|---|---|---|
| CI | 277,892 | 4.6% | 13,390 | 23.6 |
| UNH | 450,129 | 0.4% | 24,261 | 13.3 |
| CVS | 405,618 | 6.1% | 15,412 | 2.3 |
| CNC | 178,332 | 5.1% | 2,905 | -13.1 |
| ELV | 201,114 | 1.4% | 8,324 | 22.6 |
| HUM | 137,200 | 23.5% | 3,362 | 9.4 |
Source: Yahoo Finance
CI’s revenue growth was 4.6% TTM versus CVS at 6.1%, CNC at 5.1%, UNH at 0.4%, ELV at 1.4%, and HUM at 23.5%, so CI sits in the middle of the managed-care group. HUM is the clear growth leader, but CI is not a laggard, which supports a fair multiple rather than a deep discount. The more important read-through is that CI’s growth is good enough to support cash generation, but not strong enough to force a rerating on its own.
Valuation
| Company | Trailing P/E | Forward P/E | EV/Revenue | EV/EBITDA | Price/Sales (TTM) | Price/Book (mrq) | Market Cap (USD Mil) | Enterprise Value (USD Mil) | Beta (5Y Monthly) | FCF Yield % (TTM) | Forward EPS | Analyst Target Price – Low | Analyst Target Price – Mean | Analyst Target Price – High | # Analyst Opinions |
|---|---|---|---|---|---|---|---|---|---|---|---|---|---|---|---|
| CI | 12.3 | 8.6 | 0.4 | 7.5 | 0.3 | 1.8 | 76,601 | 99,881 | 0.30 | 9.0% | 33.5 | 290 | 340.9 | 400 | 24 |
| UNH | 31.6 | 18.8 | 0.9 | 17.5 | 0.8 | 3.6 | 382,093 | 424,486 | 0.63 | 6.0% | 22.4 | 313 | 475.2 | 529 | 26 |
| CVS | 47.3 | 12.8 | 0.5 | 13.2 | 0.3 | 1.8 | 137,468 | 204,192 | 0.60 | 3.8% | 8.4 | 79 | 112.2 | 148 | 26 |
| CNC | — | 14.2 | 0.1 | 8.3 | 0.2 | 1.5 | 31,312 | 24,042 | 1.08 | 21.9% | 4.5 | 40 | 65.2 | 80 | 18 |
| ELV | 16.7 | 12.7 | 0.4 | 9.1 | 0.4 | 1.8 | 81,907 | 75,576 | 0.68 | 5.3% | 29.6 | 393 | 449.1 | 492 | 21 |
| HUM | 41.5 | 24.3 | 0.3 | 11.7 | 0.3 | 2.5 | 46,742 | 39,214 | 0.72 | 3.1% | 16 | 195 | 348 | 502 | 24 |
Source: Yahoo Finance
CI’s 9.0% FCF yield beats UNH at 6.0%, ELV at 5.3%, CVS at 3.8%, and HUM at 3.1%, while CNC screens at 21.9% because of a distressed earnings base. On EV/Revenue, CI trades at 0.4x versus UNH at 0.9x, CVS at 0.5x, CNC at 0.1x, ELV at 0.4x, and HUM at 0.3x; that discount to UNH is justified by CI’s lower growth and lower forward EPS, but it also means the market is paying less for each dollar of CI earnings than for UNH’s higher-quality stream. A 1.00 investment one year ago would be worth 1.56 in UNH, 1.88 in CVS, 1.18 in CNC, 1.02 in ELV, and 1.65 in HUM, so CI has lagged despite better leverage and stronger ROE than most peers. That combination tells me the market is not rewarding CI for balance-sheet safety the way it does for some peers, which is why the valuation case depends on cash conversion staying intact.
Profitability
| Company | Operating Margin (TTM) | Net Margin (TTM) | Return on Assets (TTM) | Return on Equity (TTM) | Gross Margin (TTM) | EBITDA Margin (TTM) |
|---|---|---|---|---|---|---|
| CI | 5.5% | 2.3% | 4.8% | 16.3% | 9.2% | 4.8% |
| UNH | 7.1% | 3.1% | 4.4% | 14.2% | 19.5% | 5.4% |
| CVS | 4.1% | 0.7% | 2.7% | 3.8% | 13.4% | 3.8% |
| CNC | 5.1% | -3.6% | 1.2% | -26.0% | 10.6% | 1.6% |
| ELV | 4.6% | 2.5% | 3.8% | 11.1% | 26.0% | 4.1% |
| HUM | 4.7% | 0.8% | 3.6% | 6.3% | 14.0% | 2.5% |
Source: Yahoo Finance
CI’s operating margin of 5.5% is above CVS at 4.1%, CNC at 5.1%, ELV at 4.6%, and HUM at 4.7%, while its net margin of 2.3% trails UNH at 3.1% and ELV at 2.5% but beats CVS at 0.7% and HUM at 0.8%. Gross margin of 9.2% is far below UNH at 19.5% and ELV at 26.0%, which points to a cost-of-revenue disadvantage rather than just higher overhead. EBITDA margin of 4.8% sits close to UNH at 5.4% and above CVS at 3.8% and HUM at 2.5%, so the operating model is efficient enough to support the current valuation. In other words, CI is profitable enough to defend its moat, but not so profitable that the market should pay a premium for it.
Leverage
| Company | Total Debt/Equity % (mrq) | Current Ratio (mrq) | Total Debt (mrq, USD Mil) | Operating Cash Flow TTM (USD Mil) | Free Cash Flow TTM (USD Mil) | Net Debt/EBITDA (TTM) | FCF Margin % (TTM) |
|---|---|---|---|---|---|---|---|
| CI | 72.8 | 0.8 | 30,900 | 8,812 | 6,923.4 | 1.7 | 2.5% |
| UNH | 69.2 | 0.8 | 73,328 | 27,017 | 22,759.8 | 1.7 | 5.1% |
| CVS | 100.9 | 0.9 | 78,345 | 10,332 | 5,201.6 | 4.3 | 1.3% |
| CNC | 76 | 1.1 | 16,371 | 7,944 | 6,847.5 | -2.5 | 3.8% |
| ELV | 69 | 1.5 | 31,044 | 7,464 | 4,306.4 | -0.8 | 2.1% |
| HUM | 77.1 | 1.8 | 14,371 | 1,844 | 1,431.4 | -2.3 | 1.0% |
Source: Yahoo Finance
CI’s debt/equity is 72.8%, close to UNH at 69.2%, ELV at 69.0%, and HUM at 77.1%, while CVS is higher at 100.9%; yet CI’s net debt/EBITDA is only 1.7x, almost identical to UNH at 1.7x and far below CVS at 4.3x. CI’s FCF margin of 2.5% is better than CVS at 1.3% and HUM at 1.0%, but below UNH at 5.1% and CNC at 3.8%, so the balance sheet is not a source of upside, just a support for the equity. The lower leverage profile helps explain why CI can trade at a lower EV/Revenue multiple than UNH without looking distressed.
Conclusion
I would put my rating as a Hold because the stock’s 9.0% FCF yield and 1.7x net debt to EBITDA support the equity, but the 4.6% TTM revenue growth rate and 2.3% net margin show a business that is still proving its post-divestiture earnings power. The key tension is that the moat is intact, yet the numbers do not show enough acceleration to call the reset a clear re-rating event.
I would raise my rating more towards a Buy if Cigna can hold revenue growth above 5.0% for two consecutive quarters, because that would show the remaining Evernorth and Cigna Healthcare mix is absorbing the Medicare exit without losing scale, and if FCF yield stays above 8.0%, meaning the business is still converting enough cash to justify the current valuation. A cleaner bull case would also include medical cost ratio stability near the current level rather than another step up, because that would tell me pricing and utilization discipline are holding.
I would move from Hold to Sell if revenue growth slips below 3.0% for two straight quarters, because that would imply the post-divestiture base is not replacing the sold Medicare earnings fast enough, or if net debt to EBITDA moves above 2.0x, meaning the balance sheet is losing the cushion that currently supports the stock. The sharper downside case is a further margin squeeze that pulls FCF yield below 7.0%, since that would mean the market is no longer being paid enough cash to compensate for slower growth and concentration risk in the pharmacy benefit book.
Weighing both paths, I still lean to the middle because the bull case needs proof of sustained growth while the bear case needs only modest deterioration in a business already carrying $30.9B of debt. The next two quarters should tell us whether the 2025 portfolio reset is translating into durable cash generation or just a cleaner but slower earnings base, and until that is clear I would stay at Hold.
What’s your take? I rated Cigna Group (CI) HOLD above — but the goal here is to get this right, not just to publish an opinion. What would you add to this analysis, or which risk or catalyst do you think I’m under- or over-weighting? Tell me in the comments.
Sources
- SEC 10-K Annual Report — filed 2026-02-26
- SEC 8-K Filing (2026-05-13)
- SEC 8-K Filing (2026-04-30)
- SEC 8-K Filing (2026-04-27)
- SEC 8-K Filing (2026-03-03)
- SEC 8-K Filing (2026-02-27)
- SEC 8-K Filing (2026-02-05)
- SEC Form 4 Insider Transaction (2026-06-03)
- SEC Form 4 Insider Transaction (2026-06-02)
- SEC Form 4 Insider Transaction (2026-05-14)
- SEC 10-K Annual Report — FY2026
- SEC 10-K Annual Report — FY2025
- SEC 10-K Annual Report — FY2024
- SEC 10-K Annual Report — FY2023
- SEC 10-K Annual Report — FY2022
Data sourced from Yahoo Finance and SEC EDGAR. Not investment advice.
Leave a Comment