The Short Version
Rent the Runway is a Consumer Cyclical company in Apparel Retail, and its stock is a Penny Stock. Short selling means borrowing shares and selling them now, hoping to buy them back later at a lower price. On this name, that bet is unusually crowded.⁽¹⁾
As of the latest short interest report dated 2026-09-30, 1.64M shares were sold short out of 271,206 shares in the float, so for every 100 shares that can trade, about 605 have been borrowed and sold. That is far above the market median of 4.5% of shares outstanding sold short.⁽¹⁾
The squeeze can keep going only if buyers keep pushing the price up and shorts feel forced to cover. But the stock can also fall if volume fades, if the rally runs out of fuel, or if dilution worries return. Our read is that this is a real squeeze setup, but one with real bear arguments too.⁽²⁾⁽³⁾
Squeeze Scorecard
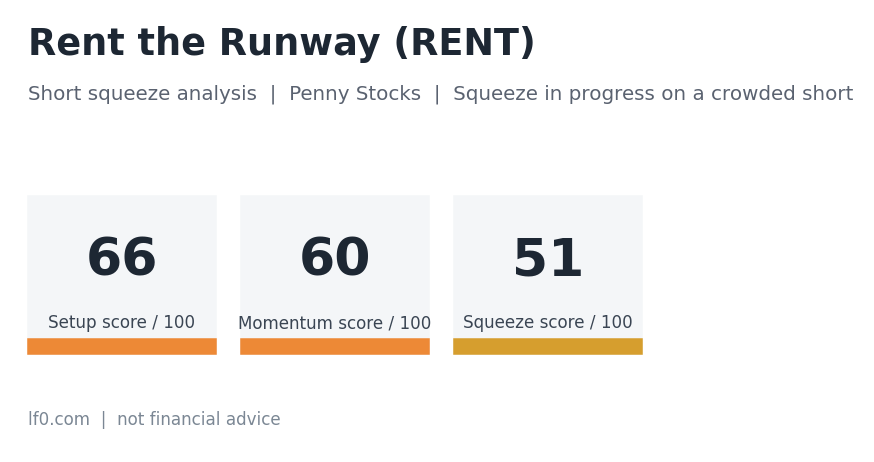
Rent the Runway (RENT) | Penny Stocks | Squeeze in progress on a crowded short
| Score | Value | Reading | What it measures |
|---|---|---|---|
| Setup Score | 66 / 100 | strong | How crowded and fragile the bet against the stock is |
| Momentum Score | 60 / 100 | strong | Whether price and volume are already forcing short sellers to react |
| Squeeze Score | 51 / 100 | moderate | Both together, reduced for dilution and cash risks |
Prices as of 2026-10-23; short interest as of the 2026-09-30 report.
How to read the scorecard
We give every stock three scores out of 100. Setup asks: how crowded is the bet against this stock, and how hard would it be for the people betting against it to get out? Momentum asks: is something already happening, with price rising on unusually heavy trading? Squeeze combines the two. It needs both, because a crowded short with nothing happening can sit for months, and a price spike with no crowded short is just a spike.
Rough guide: 0 to 30 weak, 30 to 55 moderate, 55 to 75 strong, 75 and above extreme. Most stocks score under 30 on both.
| Low Momentum | High Momentum | |
|---|---|---|
| High Setup | Loaded spring: crowded short, trigger not yet pulled | Squeeze underway |
| Low Setup | Nothing to see | Price spike without a crowded short: often fades |
This stock: Setup 66 (strong), Momentum 60 (strong), Squeeze 51 (moderate). Of the 3,187 stocks we scanned, this one ranked #1 on Squeeze Score. In plain terms, a crowded bet against the stock and buying pressure are both present, so a squeeze may already be underway.
Key data
| Metric | Value |
|---|---|
| Share price (latest close) | $2.30 |
| Market value of the company | $78.0M |
| Float (shares free to trade) | 271,206 |
| Shares sold short | 1.64M |
| Short interest as % of float | 605.3% |
| Days to cover | 6.56 |
| Cost to borrow the shares (per year) | 2.56% |
| Shares still available to borrow | 15,000 |
| Latest volume vs usual | 32.2x |
| Price change over 5 trading days | 30.7% |
Executive Summary
We are looking at a very small float, a crowded short, and a stock that has already been moving. RENT closed at $2.30 on 2026-10-23, and the latest short interest report shows 1.64M shares short against a float of 271,206 shares. That is not just high, it is extreme: the short position is larger than the float itself, which means the same shares can be lent, sold, and effectively re-lent through the market plumbing.⁽²⁾⁽¹⁾
The stock is also trading with real momentum. It rose 30.7% over the last 5 sessions and is up 48.4% from its 20-day low, even after falling 3.0% in the last session. Volume in that last session was 4.69M shares, or 32.2 times the 60-session average of 145,545 shares, which tells us the market is paying attention.⁽²⁾
That said, the setup is not one-sided. The borrow fee is only 2.56%, which is not especially expensive versus the market median of 0.41% and far below the 11.1% market 90th percentile, so shorts are not being crushed by borrowing costs alone. The company also has 6 dilution filings in the last 12 months, and that is a real counterweight to any squeeze story.⁽⁴⁾⁽³⁾
The key question is whether the recent move can keep forcing shorts to cover faster than new shares or new sellers can absorb the bid. With no clear catalyst identified in the recent headlines, this is mostly a mechanics story right now, not a news story.⁽²⁾
Short Interest and Days to Cover
Short interest is the number of shares investors have borrowed and sold betting the price will fall. On RENT, that figure was 1.64M shares in the latest report, or 4.9% of shares outstanding, which is only a little above the market median of 4.5% but still enough to matter because the float is so tiny.⁽¹⁾
The float is the shares that are actually available to trade. RENT’s float is just 271,206 shares, so the short position equals about 605 shares sold short for every 100 shares that can trade. That is why the percentage looks modest on shares outstanding but explosive on float.⁽¹⁾
Days to cover means how many trading days it would take shorts to buy back their shares if they used an average day’s volume. RENT’s latest days to cover is 6.56, which is above the market median of 4.1 and near the market 90th percentile of 9.1, so covering could take time if volume stays elevated.⁽¹⁾
The peer picture is also supportive of the squeeze case. In the industry group shown here, RENT ranks 5 of 9 for short interest, with the peer median at 5.2% of shares outstanding and 4.0 days to cover. That means RENT is not the most shorted name in the group, but it is still crowded enough to matter, especially because the float is so much smaller than most peers.⁽¹⁾
| Short interest (% of all shares) | Days to cover | |
|---|---|---|
| RENT (this stock) | 4.9% | 6.56 |
| Industry median (8 peers: Retail-Retail Stores, NEC) | 5.2% | 4.0 |
| Peer: Sally Beauty Holdings (SBH) | 19.8% | 13.3 |
| Peer: Bath & Body Works (BBWI) | 10.2% | 3.0 |
| Peer: BARK (BARK) | 6.4% | 10.4 |
| Peer: Ulta Beauty (ULTA) | 5.7% | 5.0 |
| Peer: Titan Machinery Inc. Common St (TITN) | 4.6% | 6.3 |
| Typical US-listed stock (median) | 4.5% | 4.1 |
| Most-shorted 10% of stocks start at | 13.7% | 9.1 |
| Most-shorted 1% of stocks start at | 26.8% |
Context for the numbers. This table measures short interest as a percent of all shares the company has issued, because that is the one measure we can compare across 3,574 stocks. The stricter percent-of-float figure used elsewhere in this article is always higher than this one. On this measure RENT is more heavily shorted than about 54% of exchange-listed stocks.
Hover over a bar for the figures. Red bars: shares sold short at each twice-monthly report. Dashed blue line: the float, meaning the shares free to trade. Latest: 1.64M shares short, 605.3% of the float.
Borrow Fee and Availability
The borrow fee is the annualized cost to borrow shares before shorting them. RENT’s borrow fee is 2.56%, which is not a squeeze-level borrow cost by itself, because the market 90th percentile is 11.1% and the 99th percentile is 185.31%.⁽⁴⁾⁽¹⁾
Availability is also not fully shut. There are 15,000 shares available to borrow, which is only 0.91% of the current short position. That means shorts can still find stock, but the supply is thin relative to the amount already short.⁽⁴⁾
This matters because a true squeeze often gets worse when borrow gets scarce and expensive at the same time. We do not have that full pressure here yet, so the bear case is that shorts may be able to stay in the trade longer than the bulls expect.⁽⁴⁾
There is also a sign that settlement stress has not disappeared. The latest half-month showed 266,541 shares failed to deliver, meaning shares were not delivered on time after a trade. That does not prove a squeeze, but it does tell us the stock has had real trading friction.⁽⁴⁾
Price and Volume Trigger
Price action is the spark that can turn a crowded short into a squeeze. RENT has gained 30.7% over the last 5 sessions and 48.4% from its 20-day low, which tells us buyers have already started to push shorts into a worse spot.⁽²⁾
Volume is the other half of the trigger. The last session traded 4.69M shares versus a 60-session average of 145,545 shares, or 32.2 times normal volume. When a stock trades that far above its usual pace, shorts cannot assume they will be able to cover quietly.⁽²⁾
The stock is still below its 5-month high of $4.01, so there is room for another leg if momentum keeps building. But the last session was down 3.0%, which is a reminder that squeeze moves do not travel in a straight line and can reverse fast when buyers pause.⁽²⁾
For traders watching this setup, the next thing to watch is whether the stock can hold gains while volume stays far above normal. If it does, shorts may keep feeling pressure. If volume drops back toward the 60-session average, the squeeze case gets weaker quickly.⁽²⁾
Hover over any day for its price and volume. Blue line: daily closing price. Bars: shares traded each day; dashed line: the usual (60-day average) volume. The latest price of $2.30 is 53% below the six-month high of $4.94 (Apr 24). Orange bars mark days with at least three times the usual trading volume; the most recent was Oct 23.
Options and Gamma
Options are contracts that give the right, but not the obligation, to buy or sell a stock at a set price before a set date. RENT does have options available, which means traders can use calls, but the open interest and volume figures are not available here.⁽⁵⁾
A call option is a bet that the stock will rise. When call buying is heavy, market makers may buy stock to hedge, and that hedging can add fuel to a rally. We cannot measure that effect here because call open interest, call volume, put volume, and implied volatility are not available.⁽⁵⁾
Gamma squeeze means a feedback loop where rising stock prices force option hedgers to buy more shares, which can push the stock even higher. We do not have the options data needed to say that a gamma squeeze is active in RENT, so we should not assume one.⁽⁵⁾
That missing data cuts both ways. It means the bull case cannot lean on options flow as proof of extra fuel, but it also means a hidden options-driven move could still appear if traders pile in later.⁽⁵⁾
Catalysts and Filings
A catalyst is a fresh event that gives traders a reason to buy or sell. We did not identify a clear headline catalyst in the recent headlines, so the move looks more like a mechanics-driven squeeze than a news-driven rerating.⁽²⁾
The filing picture does matter, though. RENT had 7 Form 8-K filings in the last 60 days, and those filings covered a material agreement, other events, results of operations, and an unregistered sale of equity securities. An 8-K is a company filing used to announce important events quickly, and that kind of activity can keep traders alert.⁽³⁾
There were also 6 dilution filings in the last 12 months, and the latest one was a 424B3 on 2026-09-30. A dilution filing is a registration statement or prospectus supplement that can let a company sell new shares, and that can pressure a squeeze because more shares can hit the market.⁽³⁾
The last stock split was on 2024-04-03 at a ratio of 0.05, which is a reverse split. A reverse split reduces the share count and raises the per-share price, often used to manage listing or trading issues, and it can change how traders think about the stock even if it does not fix the business.⁽³⁾
Solvency and Dilution Risk: The Bear Case
The bear case starts with the balance sheet. RENT has $29.0M in cash and $196.7M in total debt, for net debt of $167.7M. That is a meaningful debt load for a company with a market cap of $78.0M.⁽⁶⁾
Cash flow is another concern. Operating cash flow over the trailing twelve months was $700,000, while free cash flow was negative $44.2M. Free cash flow means cash left after running the business and paying for needed spending, so a negative number tells us the company is still consuming cash even if operations are close to breakeven on paper.⁽⁶⁾
Revenue was $366.9M over the trailing twelve months, and net income was $43.3M, with gross margin at 74.7%. Those numbers show the business is not a pure cash sink, but they do not erase the debt burden or the risk that financing needs could lead to more share issuance.⁽⁶⁾
That is why dilution matters so much here. The company has already filed for potential share sales multiple times, and if management uses that tool again, a squeeze can lose its fuel fast because new supply can meet the buying pressure.⁽³⁾
How I Would Play This
As an illustration only, not advice: I would treat RENT as a high-risk squeeze trade, not a normal investment. I would only consider a very small share position if I wanted direct exposure, because shares can keep participating if the squeeze extends and I would not have a fixed expiration date. I would want to see the stock hold above recent support while volume stays far above the 60-session average. If the stock loses momentum and volume falls back, I would assume the squeeze is fading. I would not add size just because the short interest is extreme, because crowded shorts can stay crowded for a long time. If I used options, I would keep the size small because the most I can lose is the premium paid, but the timing risk is much higher. If I were waiting, I would stay out until I saw a fresh trigger, because no trade is also a position.⁽²⁾⁽⁵⁾⁽¹⁾
A share position means buying the stock itself, which can lose value but does not expire. A call option is a contract that can expire worthless, so the most you can lose is the premium, but it can be a cleaner way to express a squeeze view if the move happens fast. Staying out is always valid when the setup is noisy or the catalyst is unclear. Shorting a crowded stock can lose more than you put in because the price can rise without a natural ceiling, so that side of the trade needs extra caution.⁽⁵⁾⁽¹⁾
What Would Invalidate the Thesis
The squeeze thesis weakens if the stock stops attracting volume. If trading drops back toward the 60-session average of 145,545 shares, shorts get more room to work and the forced-buying story gets weaker.⁽²⁾
It also weakens if the price gives back the recent gains. A move back toward the 20-day low would tell us the rally has lost momentum, and a break below recent support would make it easier for shorts to wait instead of cover.⁽²⁾
A bigger problem would be new dilution or financing pressure. The company has already filed multiple dilution-related documents in the last 12 months, so another offering or share sale would add supply and could overwhelm the squeeze.⁽³⁾
Finally, the bear case wins if the market decides the balance sheet matters more than the float math. With $167.7M in net debt and only $29.0M in cash, traders may decide the stock is too fragile to hold up if momentum fades.⁽⁶⁾
Conclusion
RENT is one of the more crowded short setups in the market right now, with 1.64M shares short against a float of just 271,206 shares and days to cover of 6.56. That is enough to support a squeeze, especially after a 30.7% five-session gain and a huge jump in volume.⁽¹⁾⁽²⁾
But the bull case is not clean. Borrow is not especially expensive, no clear catalyst was identified, and dilution risk is real because the company has filed multiple share-sale documents in the last 12 months.⁽⁴⁾⁽²⁾⁽³⁾
Our overall read is that this is a squeeze in progress, but one that can fail fast if volume fades or new supply appears. The setup is real, the risk is real, and the next move will likely depend on whether buyers keep forcing shorts to react.⁽²⁾⁽³⁾
Sources
Where the figures in this article come from, so you can check them yourself:
- FINRA equity short interest report, settlement date 2026-09-30
- Daily price and volume history for RENT
- SEC filings for RENT
- Borrow fee and shares available from Interactive Brokers’ public stock loan file; failed deliveries and threshold list from SEC and exchange data
- Listed options chain for RENT
- Financial statements and balance sheet for RENT
How We Score This (Methodology v1)
Every stock in our daily scan gets two scores from 0 to 100. Each ingredient is scaled between a level that earns no points and a level that earns full points, then weighted by how much it matters. A score is the points earned divided by the weight of the ingredients we could measure, so a stock without listed options is not penalised for it.
Setup Score: how crowded and fragile is the bet against the stock?
| Ingredient | Weight | Points earned | How it scales |
|---|---|---|---|
| Short interest as % of float | 30 | 30.0 | 5% = 0 pts, 40% = full |
| Days to cover | 10 | 7.9 | 1 day = 0, 8 days = full |
| Borrow fee (annualised) | 15 | 0.0 | 5% = 0, 100% = full (log scale) |
| Shares available to borrow vs shares short | 10 | 10.0 | 50% of short = 0, 1% = full |
| Change in short interest since the prior report | 10 | 0.0 | 0% = 0, +30% = full |
| Float size | 10 | 10.0 | 500M shares = 0, 50M = full |
| Fails-to-deliver / Reg SHO threshold list | 5 | 5.0 | On threshold list = full |
| Listing pressure (low share price) | 10 | 3.5 | $3 = 0, $1 or below = full |
Momentum Score: is the squeeze already starting?
| Ingredient | Weight | Points earned | How it scales |
|---|---|---|---|
| Volume vs 60-day average | 30 | 30.0 | 1.5x = 0, 8x = full (log scale) |
| 5-day price change | 20 | 5.4 | +5% = 0, +100% = full |
| Gain from the 20-day low | 15 | 3.7 | +15% = 0, +150% = full |
| Call open interest (in shares) vs float | 15 | n/a | 1% = 0, 25% = full |
| Call/put volume ratio | 5 | n/a | 1.0 = 0, 5.0 = full |
| Implied volatility (nearest expiry, near the money) | 5 | n/a | 60% = 0, 300% = full |
| Social attention (StockTwits / Reddit) | 10 | n/a | Not scored in v1 (needs a browser session) |
Squeeze Score. The geometric mean of Setup and Momentum, so a stock needs both a crowded short and price pressure to rank highly. It is reduced by 20% if the company has recently filed paperwork that lets it sell new shares into a rally (which gives short sellers an exit), and by 15% if it has less than 12 months of cash at its current burn.
Size categories. Large Caps: market value of $10B or more. Penny Stocks: share price under $5 and market value under $300M. Small Caps: everything else.
A caution on timing. Short interest is only reported twice a month, so the true position today may be higher or lower than the figure shown.
This article is for educational and informational purposes only. It is not financial advice or a recommendation to buy or sell any security. Short squeeze stocks are extremely volatile and you can lose all of your investment. We may hold positions in securities we discuss. Do your own research.
Join the LF0 Equity Research community on Discord
Get each new research article as it is published and talk it through with other readers.
Leave a Comment