The Short Version
Braskem is a chemicals company in the Basic Materials sector, and its stock has become a watchlist name because short sellers are leaning on it more than they were a few weeks ago.
Short interest, the number of shares investors have borrowed and sold betting the price will fall, is 5.65M shares, or 5.6% of the float, which means 5.65M shares are sold short out of 101.15M free to trade.
That is not extreme for the market, but it is enough to matter if buyers keep showing up and the stock keeps moving.⁽¹⁾
The latest trading burst was real, with volume far above normal and a sharp one-day jump, but the stock also fell over the prior five sessions, so this is not a clean one-way squeeze.
A squeeze would need more buying, more volume, and shorts deciding the move is not fading.⁽²⁾
The risk is that the stock is still a small-cap with heavy debt and weak cash flow, so the rally can stall fast if momentum cools.⁽³⁾
Squeeze Scorecard
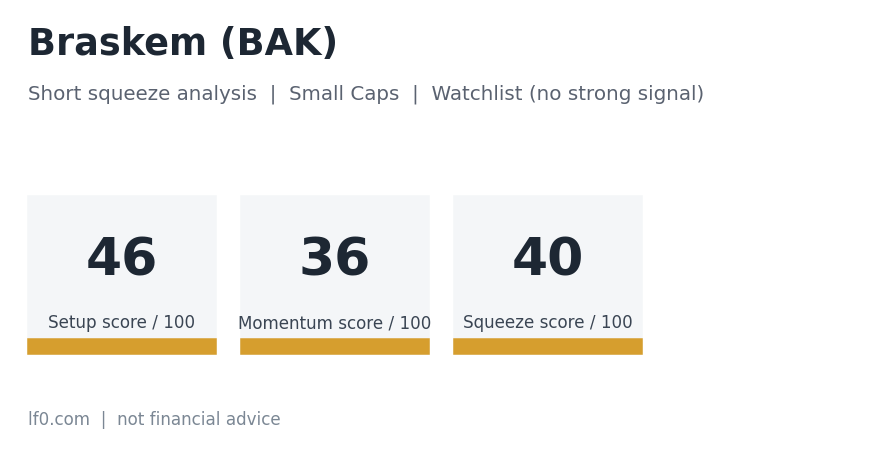
Braskem (BAK) | Small Caps | Watchlist (no strong signal)
| Score | Value | Reading | What it measures |
|---|---|---|---|
| Setup Score | 46 / 100 | moderate | How crowded and fragile the bet against the stock is |
| Momentum Score | 36 / 100 | moderate | Whether price and volume are already forcing short sellers to react |
| Squeeze Score | 40 / 100 | moderate | Both together, reduced for dilution and cash risks |
Prices as of 2026-10-27; short interest as of the 2026-09-30 report.
How to read the scorecard
We give every stock three scores out of 100. Setup asks: how crowded is the bet against this stock, and how hard would it be for the people betting against it to get out? Momentum asks: is something already happening, with price rising on unusually heavy trading? Squeeze combines the two. It needs both, because a crowded short with nothing happening can sit for months, and a price spike with no crowded short is just a spike.
Rough guide: 0 to 30 weak, 30 to 55 moderate, 55 to 75 strong, 75 and above extreme. Most stocks score under 30 on both.
| Low Momentum | High Momentum | |
|---|---|---|
| High Setup | Loaded spring: crowded short, trigger not yet pulled | Squeeze underway |
| Low Setup | Nothing to see | Price spike without a crowded short: often fades |
This stock: Setup 46 (moderate), Momentum 36 (moderate), Squeeze 40 (moderate). Of the 3,186 stocks we scanned, this one ranked #2 on Squeeze Score. In plain terms, neither the short bet nor the price action is strong enough to call this a squeeze candidate yet.
Key data
| Metric | Value |
|---|---|
| Share price (latest close) | $1.35 |
| Market value of the company | $305.0M |
| Float (shares free to trade) | 101.15M |
| Shares sold short | 5.65M |
| Short interest as % of float | 5.6% |
| Days to cover | 3.56 |
| Cost to borrow the shares (per year) | nan% |
| Shares still available to borrow | nan |
| Latest volume vs usual | 5.2x |
| Price change over 5 trading days | -19.2% |
Executive Summary
We see a setup that is interesting, but not yet a full squeeze story. Braskem’s short interest is 5.65M shares, or 5.6% of float, which puts it above the market median of 4.5% but below the market 75th percentile of 8.4%. That means the stock is more shorted than the typical listed name, but it is not in the most crowded tier where squeezes often become violent. Days to cover, the rough number of trading days shorts would need to buy back their shares using normal volume, is 3.56 days, versus a market median of 4.1 days and an industry median of 4.7 days. So the stock is not especially hard for shorts to exit compared with peers, even though the position has grown.⁽¹⁾
The latest report shows short interest rose 24.59% from the prior report, which tells us bearish positioning is building rather than fading. That matters because a rising short base can become fuel if price and volume keep rising at the same time.⁽²⁾ But the counterpoint is just as important: the stock is still ranked 11 of 18 in its industry group by short interest, so several peers are more crowded. In other words, this is a setup to watch, not a setup that forces a squeeze by itself.⁽¹⁾
We also do not have a clear headline catalyst in the recent news flow, so the move looks more like positioning and trading pressure than a story-driven rerating. That makes the tape more fragile, because momentum without a fresh reason to buy can fade as quickly as it starts. For traders, the key question is whether the recent volume surge becomes a pattern or just a one-day burst. If volume stays elevated and price keeps holding gains, shorts may have to chase higher. If volume drops back toward normal, the move can unwind.⁽²⁾
Short Interest and Days to Cover
Short interest is the core squeeze ingredient here. It measures how many shares have been borrowed and sold by traders who expect the price to fall, and Braskem has 5.65M shares short, equal to 5.6% of the float. The float is the shares that are actually available to trade, and Braskem’s float is 101.15M shares, so for every 100 shares that can trade, about 6 are currently borrowed and sold short. That is above the market median short interest of 4.5%, but below the 75th percentile of 8.4% and far below the 95th percentile of 18.3%. So the stock is somewhat crowded, but not deeply crowded by market standards.⁽¹⁾
The industry picture is similar. Braskem’s 5.6% short interest is above the industry median of 3.9%, but it is still behind the most shorted names in the group, such as GPRE at 18.2% and AMTX at 10.9%. Its rank is 11 of 18 in the industry group, where 1 means the most shorted. That ranking matters because a squeeze usually needs a stock to be near the top of the crowding table, not just above average. Braskem is not there yet.⁽¹⁾
Days to cover is the second half of the setup. It tells us how long it might take shorts to buy back their shares if they all tried to exit using normal trading volume, and Braskem’s 3.56 days is below the market median of 4.1 days and below the industry median of 4.7 days. That means the stock is not especially illiquid relative to the amount shorted. A higher number would make a squeeze easier because shorts would have a harder time getting out without pushing the price up. Here, the exit door is not tiny.⁽¹⁾
The trend is still worth watching. Short interest was 3.16M on June 30, then 4.65M on July 15, 3.92M on July 31, 3.42M on August 14, 6.06M on August 31, 4.54M on September 15, and 5.65M on September 30. That back-and-forth tells us the bearish crowd is active, but not locked in a straight line. For a trader, the next thing to watch is whether the next report shows another jump while the stock is still firm. If short interest keeps rising into strength, the squeeze case gets better. If it falls while price stalls, the setup weakens.⁽¹⁾⁽²⁾
| Short interest (% of all shares) | Days to cover | |
|---|---|---|
| BAK (this stock) | 3.3% | 3.56 |
| Industry median (17 peers: Industrial Organic Chemicals) | 3.9% | 4.7 |
| Peer: Green Plains (GPRE) | 18.2% | 8.6 |
| Peer: Aemetis, Inc. (DE) (AMTX) | 10.9% | 7.9 |
| Peer: Comstock (LODE) | 10.5% | 5.2 |
| Peer: Gevo (GEVO) | 8.9% | 5.9 |
| Peer: Alto Ingredients, Inc. Common (ALTO) | 7.7% | 5.0 |
| Typical US-listed stock (median) | 4.5% | 4.1 |
| Most-shorted 10% of stocks start at | 13.7% | 9.1 |
| Most-shorted 1% of stocks start at | 26.8% |
Context for the numbers. This table measures short interest as a percent of all shares the company has issued, because that is the one measure we can compare across 3,573 stocks. The stricter percent-of-float figure used elsewhere in this article is always higher than this one. On this measure BAK is more heavily shorted than about 38% of exchange-listed stocks.
Hover over a bar for the figures. Red bars: shares sold short at each twice-monthly report. Dashed blue line: the float, meaning the shares free to trade. Latest: 5.65M shares short, 5.6% of the float.
Borrow Fee and Availability
Borrow fee, the annual cost to borrow shares for a short sale, is not available here because the field is missing. Shares available to borrow are also not available, so we cannot tell whether the lending market is tight or loose. That matters because a high borrow fee or scarce borrow can make shorting expensive and can force some shorts to cover earlier. Without those numbers, we have to lean more on short interest and trading behavior than on lending stress.⁽¹⁾⁽⁴⁾
We do know Braskem is not on the regulatory threshold list for persistent delivery failures. That is a useful check, because names on that list can signal repeated settlement problems and a more stressed trading environment. Braskem did have 547,867 shares failed to deliver in the latest half month, which means some trades did not settle on time. That is worth noting, but by itself it does not prove a squeeze is building.⁽⁴⁾
The missing borrow data cuts both ways. On one hand, if borrow were tight, it could add pressure to shorts and help a rally. On the other hand, if borrow is easy and cheap, shorts can stay in the trade longer and absorb a price bounce. Because we do not have the fee or availability, we should not overstate the squeeze risk from lending conditions.⁽⁴⁾ The cleaner signal remains the combination of short interest, price, and volume.⁽¹⁾⁽²⁾
Price and Volume Trigger
The stock closed at $1.35 on October 27, and the latest session saw a 22.7% gain. That is a sharp move for a small-cap name, but it came after the stock had already fallen 19.2% over the prior five sessions. So we are looking at a rebound inside a choppy tape, not a clean breakout from a long base. That distinction matters because short squeezes usually work best when a stock keeps rising and shorts feel trapped, not when the move is immediately mixed.⁽²⁾
Volume was the real tell. Braskem traded 12.44M shares in the latest session, versus a 60-session average of 2.39M shares, or 5.2 times normal volume. That means far more shares changed hands than usual, which is exactly the kind of activity that can force shorts to react. A stock does not squeeze just because it rises; it squeezes when rising price meets heavy trading and shorts start buying back into strength. This session had the volume piece, but we do not yet know if it will repeat.⁽²⁾
The stock is still well below its recent high of $4.46 over the last five months. That leaves room for a bigger move if momentum builds, but it also shows the stock has already been volatile enough to attract both buyers and sellers. For traders, the next thing to watch is whether price can hold above the recent jump while volume stays above the 60-day average. If it can, shorts may have to cover into a stronger trend. If volume fades, the move can become a one-day spike.⁽²⁾
Hover over any day for its price and volume. Blue line: daily closing price. Bars: shares traded each day; dashed line: the usual (60-day average) volume. The latest price of $1.35 is 73% below the six-month high of $5.02 (May 18). Orange bars mark days with at least three times the usual trading volume; the most recent was Oct 27.
Options and Gamma
Options are available on Braskem, but the key open interest and volume figures are not available. Open interest is the number of options contracts still open, and call options are bets that gain value when the stock rises. Implied volatility, the market’s estimate of how much the stock may swing, is also not available. Without those numbers, we cannot make a strong case for a gamma squeeze, which is when heavy call buying forces market makers to buy stock to hedge.⁽⁵⁾
That missing data matters because gamma squeezes usually need visible options pressure. If traders pile into call options, the people who sold those calls may need to buy shares as the stock rises, which can add fuel to the move. But we do not have call volume, put volume, or the call-to-put balance, so we cannot say that options are driving this name. For now, the stock’s move looks more like a cash-market volume event than an options-led event.⁽²⁾⁽⁵⁾
The absence of options data is also a reminder not to overread the rally. A stock can jump on simple buying pressure, especially when it is small and lightly traded relative to its float.⁽²⁾ If options activity later shows up with rising call demand and rising implied volatility, that would strengthen the squeeze case. Until then, options are a possible accelerant, not a confirmed driver.⁽⁵⁾
Catalysts and Filings
We did not find a clear recent headline catalyst for the move. That means we should be careful about assigning a story to the price action when the tape itself is the main evidence. Sometimes a stock rises because traders notice the short base and pile in together, even without a fresh company event.⁽¹⁾ That can work for a while, but it also means the move can lose energy quickly if attention shifts elsewhere.⁽²⁾
The filing picture is quiet. There were 0 dilution filings in the last 12 months and 0 Form 8-K filings in the last 60 days. An 8-K is a current report companies use to announce important events, and none were flagged in the recent window. A dilution filing is a registration statement or prospectus supplement that can let a company sell new shares, and we do not have one here. That lowers the chance that the recent move was driven by a fresh share sale announcement.⁽⁶⁾
Quiet filings can be a double-edged sword. On one hand, no new dilution signal means there is no obvious near-term overhang from a new equity raise in the recent filing record. On the other hand, no new filing catalyst also means there is no obvious fundamental event to justify a lasting rerating. So the burden is on price and volume to prove the move can continue.⁽²⁾⁽⁶⁾
Solvency and Dilution Risk: The Bear Case
The bear case starts with the balance sheet. Braskem has $5.93B in cash and $68.30B in total debt, leaving $62.37B in net debt. That is a heavy debt load for a company with a $305.0M market cap. It also posted negative operating cash flow of $5.80B and negative free cash flow of $7.60B over the trailing twelve months. Those are not the numbers of a business that can shrug off a weak market.⁽³⁾
Profitability is also weak. Revenue over the trailing twelve months was $70.60B, but net income was negative $5.54B and gross margin was only 11.5%. That tells us the company is still struggling to turn sales into durable profit. Cash runway is listed at 12 months, and the company is burning cash. That does not mean a crisis is imminent, but it does mean the balance sheet deserves close attention.⁽³⁾
Dilution risk is not showing up in the recent filing record, but it cannot be ignored over time. No dilution filings were reported in the last 12 months, and no recent 8-K topics were flagged, so there is no fresh equity-raise signal in the latest filing window. Still, a company with heavy debt and negative cash flow can face financing pressure later, even if it has not filed anything recently.⁽⁶⁾ That is the main counterweight to any squeeze thesis: a stock can rally hard, but weak fundamentals can cap the move or reverse it once traders step away.⁽³⁾⁽²⁾
How I Would Play This
As an illustration only, not advice: I would treat Braskem as a small-cap trading setup, not a conviction investment, and I would keep size small if I wanted exposure at all. I would want to see price hold the recent jump while volume stays well above the 60-session average before I considered the move more than a bounce. I would also watch the next short interest report for another rise, because a growing short base can help a squeeze if the stock keeps firming. If the stock gives back the gain quickly, I would assume the squeeze case is failing. If I were using options, I would only do so if I understood that the most I can lose is the premium paid. If I were buying shares, I would accept that the stock can fall back sharply and that the position can still lose a lot even if the squeeze thesis is right for a day. If I were shorting it, I would respect that a crowded stock can rise faster than expected and that losses can exceed the money put in. If I could not define my exit, I would stay out.
Buying shares means owning the stock outright, so the most I can lose is the amount I paid, but the position can still swing hard in a small-cap name. Call options are contracts that can multiply gains if the stock rises, but they can also expire worthless, so the premium paid is the maximum loss. Waiting for a trigger means I do not act until price and volume confirm the move, which fits this stock because the current setup is still unproven. Staying out is always a valid choice, especially when the catalyst is unclear. Shorting means betting the stock falls, but in a crowded name that can be dangerous because the price can rise much more than expected and losses can be larger than the cash used to open the trade.
What Would Invalidate the Thesis
The thesis weakens if the next short interest report shows shorts backing off instead of adding. It also weakens if volume drops back toward the 2.39M average and the stock cannot hold the recent 22.7% jump. That would tell us the move was likely a burst of trading rather than the start of a squeeze. If price slips back while the short base shrinks, the setup is probably over.⁽¹⁾⁽²⁾
A lack of options activity would also keep the squeeze case limited. If we never see meaningful call buying, rising implied volatility, or other signs of options pressure, then gamma is probably not part of the story.⁽⁵⁾ And if the company were to face new financing pressure or a dilution filing later, that could cap upside even if traders remain active.⁽⁶⁾⁽³⁾ In short, the thesis needs sustained price strength, sustained volume, and at least stable or rising short interest.⁽¹⁾⁽²⁾
Conclusion
Braskem is more shorted than the typical stock, but not by a huge margin, and its days to cover are below both the market and industry medians.⁽¹⁾ The latest session showed a real volume spike and a strong price jump, which is the kind of action that can pressure shorts. But we do not have a clear catalyst, borrow stress is not available, and options data is missing, so the squeeze case is still incomplete.⁽⁴⁾⁽⁵⁾⁽²⁾ Our read is simple: this is a watchlist setup with some squeeze ingredients, but the bear case remains strong because of debt, cash burn, and weak profitability.⁽³⁾
Sources
Where the figures in this article come from, so you can check them yourself:
- FINRA equity short interest report, settlement date 2026-09-30
- Daily price and volume history for BAK
- Financial statements and balance sheet for BAK
- Borrow fee and shares available from Interactive Brokers’ public stock loan file; failed deliveries and threshold list from SEC and exchange data
- Listed options chain for BAK
- SEC filings for BAK
How We Score This (Methodology v1)
Every stock in our daily scan gets two scores from 0 to 100. Each ingredient is scaled between a level that earns no points and a level that earns full points, then weighted by how much it matters. A score is the points earned divided by the weight of the ingredients we could measure, so a stock without listed options is not penalised for it.
Setup Score: how crowded and fragile is the bet against the stock?
| Ingredient | Weight | Points earned | How it scales |
|---|---|---|---|
| Short interest as % of float | 30 | 0.5 | 5% = 0 pts, 40% = full |
| Days to cover | 10 | 3.7 | 1 day = 0, 8 days = full |
| Borrow fee (annualised) | 15 | n/a | 5% = 0, 100% = full (log scale) |
| Shares available to borrow vs shares short | 10 | n/a | 50% of short = 0, 1% = full |
| Change in short interest since the prior report | 10 | 8.2 | 0% = 0, +30% = full |
| Float size | 10 | 8.9 | 500M shares = 0, 50M = full |
| Fails-to-deliver / Reg SHO threshold list | 5 | 5.0 | On threshold list = full |
| Listing pressure (low share price) | 10 | 8.2 | $3 = 0, $1 or below = full |
Momentum Score: is the squeeze already starting?
| Ingredient | Weight | Points earned | How it scales |
|---|---|---|---|
| Volume vs 60-day average | 30 | 22.3 | 1.5x = 0, 8x = full (log scale) |
| 5-day price change | 20 | 0.0 | +5% = 0, +100% = full |
| Gain from the 20-day low | 15 | 0.9 | +15% = 0, +150% = full |
| Call open interest (in shares) vs float | 15 | n/a | 1% = 0, 25% = full |
| Call/put volume ratio | 5 | n/a | 1.0 = 0, 5.0 = full |
| Implied volatility (nearest expiry, near the money) | 5 | n/a | 60% = 0, 300% = full |
| Social attention (StockTwits / Reddit) | 10 | n/a | Not scored in v1 (needs a browser session) |
Squeeze Score. The geometric mean of Setup and Momentum, so a stock needs both a crowded short and price pressure to rank highly. It is reduced by 20% if the company has recently filed paperwork that lets it sell new shares into a rally (which gives short sellers an exit), and by 15% if it has less than 12 months of cash at its current burn.
Size categories. Large Caps: market value of $10B or more. Penny Stocks: share price under $5 and market value under $300M. Small Caps: everything else.
A caution on timing. Short interest is only reported twice a month, so the true position today may be higher or lower than the figure shown.
This article is for educational and informational purposes only. It is not financial advice or a recommendation to buy or sell any security. Short squeeze stocks are extremely volatile and you can lose all of your investment. We may hold positions in securities we discuss. Do your own research.
Join the LF0 Equity Research community on Discord
Get each new research article as it is published and talk it through with other readers.
Leave a Comment