Expected price range
Each range is set from the stock’s recent price history and our Hold rating, using its own 1-year realised volatility (38% annualised) as the width of a ~68% statistical band, and checked against that rating so the range leans the same way as our view. Starting price $87.73 (close 2026-11-20). The stock traded between $86.64 and $145 over the last 6 months and between $86.64 and $145 over the last year. This is an illustration of where our view and normal volatility point, not a forecast, price target or investment advice; the stock can move outside it.
| Company | Nov 25 | Dec 25 | Jan 26 | Feb 26 | Mar 26 | Apr 26 | May 26 | Jun 26 | Jul 26 | Aug 26 | Sep 26 | Oct 26 | 12-Mo |
|---|---|---|---|---|---|---|---|---|---|---|---|---|---|
| ORA | +6% | -2% | +13% | -17% | +8% | +3% | +20% | -21% | -10% | +5% | -10% | -2% | -15% |
| FRVO | — | — | — | — | — | — | — | -20% | -23% | -32% | -12% | -39% | -77% |
| RNW | +1% | -26% | -4% | +2% | -17% | +17% | +19% | -2% | -0% | +9% | +1% | +0% | -9% |
| XIFR | -3% | +5% | -3% | +9% | +0% | -3% | +21% | -5% | +1% | +1% | -13% | -9% | -4% |
| EGIEY | +11% | -0% | +5% | +7% | -4% | +13% | -6% | +8% | -18% | +10% | -12% | -15% | -8% |
| CWEN | +15% | -8% | +9% | +6% | +4% | +3% | +2% | -16% | -7% | +0% | -6% | +9% | +6% |
Source: Yahoo Finance monthly adjusted close.
Quick Thesis
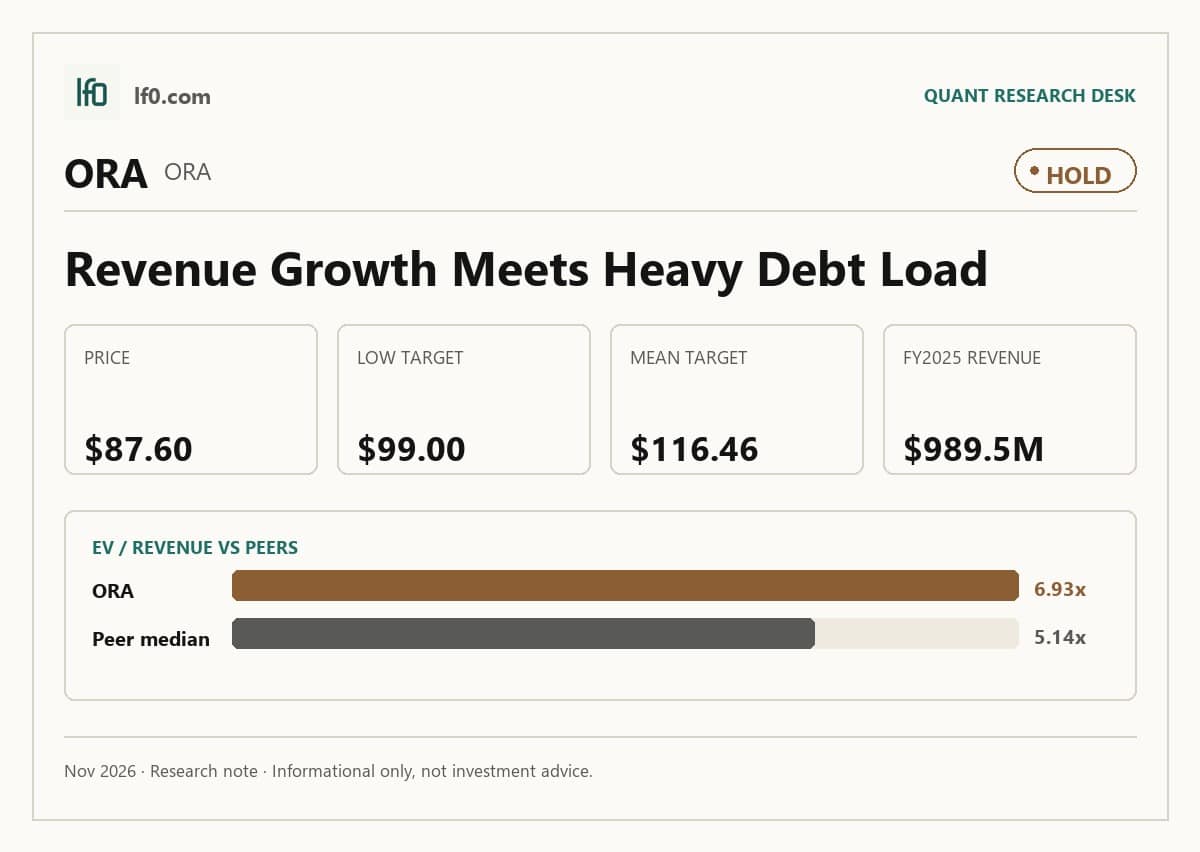
- Rated Hold — contracted cash flow is real, but free cash flow is still negative.
- Strongest financial point: FY2025 revenue was $989.5M, with 93.8% of electricity revenue fixed under PPAs.
- Biggest financial risk: levered free cash flow was -$349.6M TTM, while debt stood at $3.4B.
- Valuation is fair to rich: 14.5x EV/EBITDA and 30.9x forward P/E.
- I would turn more constructive if free cash flow turns positive and the 2027 notes stay refinancable.
Executive Summary
We’ll begin tracking this call’s performance since publication once sufficient adjusted-close data is available.
I would put my rating as a Hold because Ormat has a durable contracted revenue base, but the stock already prices in much of that quality while leverage and free cash flow remain the main constraint. FY2025 revenue was $989.5M, 93.8% of electricity revenue came from long-term PPAs with fixed price components, and levered free cash flow was -$349.6M TTM, so the business is still funding growth rather than harvesting it. I would raise my rating more toward a Buy if annualized revenue can hold above about $1B, meaning the current run rate is sustained, and if the current ratio moves back above 1.0x, which would show the project pipeline is converting into cash fast enough to reduce balance-sheet strain.
Company Profile
Ormat Technologies designs, develops, builds, owns, and operates geothermal and recovered energy power plants, and it also manufactures geothermal equipment and battery energy storage systems. Revenue in FY2025 was $989.5M, with $693.9M from electricity sales, $216.7M from product contracts, and $79M from energy storage, so the company is not a pure utility-style operator; it combines contracted power generation with project-based equipment and storage work. Founded in 1965, it listed on the New York Stock Exchange under ORA in November 2004 and began trading on the Tel Aviv Stock Exchange under the same symbol in February 2015. As of December 31, 2025, it operated in the United States, Kenya, Guatemala, Guadeloupe, Honduras, Indonesia, and New Zealand, with 40% of FY2025 revenue from foreign locations.
Economic Moat
Business Model
The core advantage is the long-dated power purchase agreement portfolio, which locks in contracted electricity sales for most of the fleet and makes cash flows far less exposed to spot power prices than a merchant generator. In the current 10-K, 93.8% of electricity revenue for the year ended December 31, 2025 came from PPAs with fixed price components, and I feel that a competitor would struggle to replicate that contracted base within 3 years because it takes time to secure, finance, and build a comparable fleet. A secondary edge is the company’s ability to combine development, equipment manufacturing, and operating know-how across electricity, product, and energy storage, which lets it monetize the same project in more than one way and supports the 2025 backlog of $245M of remaining product performance obligations. The tax monetization transactions at Heber 1 and 2 in 2025, plus hybrid tax equity for Lower Rio and Arrowleaf, also lower the cost of capital and help fund growth without relying only on common equity.
Business & Operating Risks
The biggest disclosed risk is customer concentration and payment stress at Kenya Power and Lighting Company (KPLC), because 11.9% of 2025 revenue came from KPLC and the overdue balance was $29.5M at December 31, 2025, of which $21.1M was collected in January and February 2026. That is not just a collection nuisance; it means a single utility can delay cash conversion on a meaningful slice of revenue, and the remaining $8.4M unpaid into 2026 shows the issue has already affected working capital. The same risk is reinforced by the request for more favorable rates on existing power purchase agreements, which raises the chance that revenue quality, not just timing, comes under pressure. A second company-specific risk is concentration in the McGinness Hills and Olkaria III complexes, which together accounted for 20.7% of 2025 revenue and 23.7% of total generating capacity of the electricity segment. The filing also says McGinness Hills suffered high curtailments in 2025 that reduced revenue by about $6.3M, so this is already materialized rather than hypothetical. The third risk is geothermal reservoir decline and wellfield issues, which the filing illustrates with Olkaria, Sarulla, and Brawley, where lower wellfield performance, equipment failures, and a non-cash impairment loss followed weaker generation. The fourth risk is the company’s expansion into battery energy storage systems, where merchant price volatility, fire risk, tariffs, and Foreign Entity of Concern rules under the One Big Beautiful Bill Act can all affect project economics.
Those risks do not break the moat, but they do test the reliability of the contracted cash flow base that is supposed to support it.
Management Discussion & Analysis
Management is signaling a capital-allocation shift toward growth assets with long-dated contracted cash flows, not balance-sheet repair, and that is the right response to the operating risks above. According to management’s discussion in the 10-K, Ormat entered a long-term geothermal portfolio PPA in February 2026 for up to 150MW to support Google’s data-center needs, signed a new 20-year PPA with Switch for about 13MW from Salt Wells, and won the Telaga Ranu concession with capacity potential of about 40MW. The January 2026 purchase of Hoku for $80.5M and the June 2025 Blue Mountain acquisition for $88.7M show the company is also buying operating assets, which supports near-term cash flow but adds execution risk because the balance sheet is being used to fund growth rather than de-risk leverage. That growth posture is reinforced by the $25M Sage Geosystems investment and the October 2025 SLB agreement to fast-track enhanced geothermal systems, which tells me management is willing to fund next-generation technology even though the commercial timing remains uncertain. The gap is that 2025 electricity revenue fell to $693.9M from $702.3M in 2024 while cost of revenues rose to $496M from $459.5M, so the narrative of higher pricing and better project economics is not yet showing up in the core segment margin.
Management’s track record is mixed, which keeps the credibility score below the top tier. In 2025’s 10-K, management highlighted the Ijen geothermal project’s first phase and the Calpine PPA for Mammoth 2; in the current filing, Ijen did reach commercial operation in February 2025 and the Calpine contract is still scheduled to begin in the first quarter of 2027, so those claims were broadly confirmed. By contrast, prior filings repeatedly framed Puna as a growth asset with a new PPA and higher capacity, yet the current filing still points to Puna wellfield issues and lower energy rates in 2025, which means the operational recovery has been slower than the narrative implied. The leadership team appears stable, so there is no governance shock from turnover, but I would say management has been directionally right on project development and too optimistic on the speed of margin conversion.
Recent Events
The most significant development is the $1B convertible senior notes deal completed on March 20, 2026, split between $825M of 1.50% Series A notes and $175M of zero-coupon Series B notes due 2031. In my view, that strengthens Ormat’s growth platform because it gives the company long-dated capital for expansion, but it also raises dilution risk if the share price stays above the $140.40 conversion price. The earnings 8-Ks on February 25, 2026 and May 6, 2026 were routine quarterly releases, so they do not change the structural thesis by themselves. The June 4, 2026 annual meeting results were also broadly supportive rather than transformative: all eight director nominees were elected, named executive pay won advisory approval, and Kesselman & Kesselman was ratified as auditor for FY2026. That points to governance continuity, not a new strategic direction.
Taken together, recent 8-K disclosures leave the investment case modestly strengthened, mainly because Ormat secured sizable long-duration financing without any sign of board disruption or governance stress.
Financial Analysis
Growth
ORA — Financial Growth (Quarterly, USD Mil)
| Metric | 2025-09-30 | 2025-12-31 | 2026-03-31 | 2026-06-30 | 2026-09-30 |
|---|---|---|---|---|---|
| REVENUE (USD Mil) | 249.7 | 276 | 403.9 | 258.8 | 275.1 |
| EBIT (USD Mil) | 55.6 | 61.2 | 73.6 | 61.1 | 66.8 |
| EBITDA (USD Mil) | 130.6 | 138.6 | 150 | 140.7 | 149.3 |
| NET INCOME (USD Mil) | 24.1 | 31.4 | 44.1 | 27.1 | 31.9 |
| DILUTED EPS | 0.4 | 0.5 | 0.7 | 0.4 | 0.5 |
Source: Yahoo Finance — Quarterly Financial Statements
Revenue accelerated sharply in Q1 2026, then normalized in the next two quarters. Ormat posted $403.9M in Q1 2026 versus $276M in Q1 2025, a 46.4% year-over-year jump, then revenue eased to $258.8M in Q2 2026 and $275.1M in Q3 2026, which looks like a post-ramp normalization rather than a demand break. EBITDA moved in the same direction but less dramatically: $150M in Q1 2026 versus $138.6M in Q1 2025, up 8.2% year over year, while net income rose from $31.4M to $44.1M, so earnings lagged revenue growth in the surge quarter. I read that as a bull signal, but one that is lumpy and not yet smooth enough to justify a premium on growth alone.
Growth versus peers
| Company | Revenue TTM (USD Mil) | Revenue Growth YoY % | EBITDA TTM (USD Mil) | Diluted EPS TTM |
|---|---|---|---|---|
| ORA | 1,213.8 | 10.2% | 541.6 | 2.2 |
| FRVO | 0.4 | 110.9% | -106.6 | -0.8 |
| RNW | 148,000 | 28.2% | 96,832 | 0.4 |
| XIFR | 1,220 | 5.4% | 700 | 1.6 |
| EGIEY | 14,007.5 | 9.8% | 7,559.8 | 0.6 |
| CWEN | 1,667 | 21.7% | 1,219 | -0.8 |
Source: Yahoo Finance Note: RNW (ReNew Energy Global) and EGIEY (Engie Brasil Energia) report in local currency (Indian rupees and Brazilian reais), and Yahoo Finance shows those absolute amounts without converting them to dollars, so their dollar-scale columns are not comparable with the USD figures for the other companies. Ratios and percentages are comparable. Note: n/m means not meaningful. FRVO (Fervo Energy) is pre-revenue (TTM revenue of about $0.4M), so its margin and revenue multiples are extreme and are not used in this comparison.
Ormat’s revenue grew 10.2% in TTM, versus 110.9% for FRVO, 28.2% for RNW, 5.4% for XIFR, 9.8% for EGIEY, and 21.7% for CWEN, so the stock sits in the middle of the peer set on top-line momentum. That middle position looks justified because Ormat’s growth is paired with positive diluted EPS of 2.2, while FRVO is still loss-making at -0.8 and CWEN is at -0.8, which means Ormat is growing without the same earnings drag.
Profitability
ORA — Profitability (TTM)
| Metric | TTM |
|---|---|
| Operating Margin (TTM) | 17.9% |
| Net Margin (TTM) | 11.1% |
| Return on Assets (TTM) | 2.1% |
| Return on Equity (TTM) | 4.9% |
| Gross Margin (TTM) | — |
| EBITDA Margin (TTM) | — |
Source: Yahoo Finance — Trailing Twelve Months (TTM)
TTM operating margin was 17.9%, net margin was 11.1%, ROA was 2.11%, and ROE was 4.92%. The 6.8-point gap between operating and net margin shows Ormat is keeping a meaningful share of revenue after interest and taxes, so the business is already past the early loss-making stage and is converting operating profit into bottom-line earnings. The ROE-to-ROA spread is wide, which means returns are being amplified by leverage rather than by exceptionally high asset productivity alone. That matters because the moat described above is real, but the financial profile still depends on leverage to lift equity returns.
Profitability versus peers
| Company | Operating Margin (TTM) | Net Margin (TTM) | Return on Assets (TTM) | Return on Equity (TTM) | Gross Margin (TTM) | EBITDA Margin (TTM) |
|---|---|---|---|---|---|---|
| ORA | 17.9% | 11.1% | 2.1% | 4.9% | — | — |
| FRVO | n/m | 0.0% | — | — | — | — |
| RNW | 46.7% | 8.4% | 4.1% | 8.6% | — | — |
| XIFR | 3.5% | 12.3% | 0.1% | -0.2% | — | — |
| EGIEY | 42.7% | 28.1% | 6.3% | 23.3% | — | — |
| CWEN | 17.1% | -4.8% | 1.1% | -2.0% | — | — |
Source: Yahoo Finance Note: RNW (ReNew Energy Global) and EGIEY (Engie Brasil Energia) report in local currency (Indian rupees and Brazilian reais), and Yahoo Finance shows those absolute amounts without converting them to dollars, so their dollar-scale columns are not comparable with the USD figures for the other companies. Ratios and percentages are comparable. Note: n/m means not meaningful. FRVO (Fervo Energy) is pre-revenue (TTM revenue of about $0.4M), so its margin and revenue multiples are extreme and are not used in this comparison.
Ormat’s operating margin of 17.9% and net margin of 11.1% trail RNW’s 46.7% and 8.4%, EGIEY’s 42.7% and 28.1%, and XIFR’s 3.5% and 12.3%, but Ormat is ahead of FRVO’s deeply negative operating margin and CWEN’s -4.8% net margin. The gap looks more like scale and asset mix than a pure cost-of-revenue problem, because Ormat’s margins are solid but not peer-leading, which supports a fair rather than premium multiple. ROE of 4.9% and ROA of 2.1% are respectable, but they do not justify a valuation premium on efficiency alone.
Valuation
ORA — Valuation Multiples
| Metric | Value |
|---|---|
| Current Share Price (USD) | 87.6 |
| Market Cap (USD Mil) | 5,409 |
| Enterprise Value (USD Mil) | 8,416 |
| Trailing P/E | 40.7 |
| Forward P/E | 30.9 |
| Price/Sales (TTM) | 4.5 |
| Price/Book (mrq) | 2.1 |
| EV/Revenue | 6.9 |
| EV/EBITDA | 14.5 |
| Beta (5Y Monthly) | 0.90 |
| FCF Yield % (TTM) | — |
| Forward EPS (USD) | 2.6 |
| Analyst Target Price – Low (USD) | 99 |
| Analyst Target Price – Mean (USD) | 116.5 |
| Analyst Target Price – High (USD) | 145 |
| # Analyst Opinions | 13 |
Source: Yahoo Finance
Ormat trades at 40.7x trailing P/E and 30.9x forward P/E at a current share price of $87.6, so the market is paying up for earnings that are still expected to compound rather than for a bargain today. The primary anchor is 6.93x EV/Revenue and 14.5x EV/EBITDA, which implies investors are underwriting a long runway of contracted geothermal and storage cash flows, not just the latest quarter’s profit. Price/Sales is 4.52x and Price/Book is 2.05x, both consistent with a capital-intensive platform where book value understates the value of long-dated projects. FCF yield is not a useful cheapness signal here because levered free cash flow is negative at -$349.6M TTM, or about -$5.7 per share against the $87.6 stock price, which means current equity holders are funding growth rather than harvesting cash. Beta is 0.897, so the stock has been less volatile than the market, but the 13 analyst opinions and $99 to $145 target range put the current price below the mean target of $116.5 and above the low target of $99. On my read, fair value sits in a broad $80-$110 range: that is below the analyst mean because I weight the negative free cash flow and leverage more heavily than the consensus appears to, but it still sits inside the published target band. On an earnings basis, the implied forward EPS of 2.6 is not expensive versus the current price, yet it is only attractive if the company can keep converting project wins into cash rather than just into reported revenue.
Valuation versus peers
| Company | Current Share Price (USD) | Trailing P/E | Forward P/E | EV/Revenue | EV/EBITDA | Price/Sales (TTM) | Price/Book (mrq) | Market Cap (USD Mil) | Enterprise Value (USD Mil) | Beta (5Y Monthly) | FCF Yield % (TTM) | Forward EPS | Analyst Target Price – Low | Analyst Target Price – Mean | Analyst Target Price – High | # Analyst Opinions |
|---|---|---|---|---|---|---|---|---|---|---|---|---|---|---|---|---|
| ORA | 87.6 | 40.7 | 30.9 | 6.9 | 14.5 | 4.5 | 2.1 | 5,409 | 8,416 | 0.90 | — | 2.6 | 99 | 116.5 | 145 | 13 |
| FRVO | 10.3 | — | — | n/m | — | n/m | 1.2 | 3,287 | 1,801 | — | — | -0.4 | 16 | 29.5 | 48 | 15 |
| RNW | 6.9 | 18.8 | 30.3 | 6.4 | 8.8 | 1.6 | 1.7 | 2,519 | 10,144 | 1.19 | — | 0.7 | 7.2 | 7.9 | 8.9 | 4 |
| XIFR | 6.8 | 4.5 | 5.8 | 5.1 | 7.4 | 0.6 | 0.2 | 650 | 6,242 | 0.85 | — | -1.9 | 7 | 10.1 | 12 | 11 |
| EGIEY | 4.3 | 7.8 | — | 4.4 | 5.9 | 2.2 | 1.7 | 6,323 | 10,622 | 0.36 | — | — | 4.7 | 4.7 | 4.7 | 1 |
| CWEN | 30.5 | 40.3 | 192.3 | 8.3 | 10.9 | 2.3 | 2 | 3,729 | 13,655 | 0.82 | — | 0.9 | 32 | 40.4 | 53 | 14 |
Source: Yahoo Finance Note: RNW (ReNew Energy Global) and EGIEY (Engie Brasil Energia) report in local currency (Indian rupees and Brazilian reais), and Yahoo Finance shows those absolute amounts without converting them to dollars, so their dollar-scale columns are not comparable with the USD figures for the other companies. Ratios and percentages are comparable. Note: n/m means not meaningful. FRVO (Fervo Energy) is pre-revenue (TTM revenue of about $0.4M), so its margin and revenue multiples are extreme and are not used in this comparison.
Ormat trades at 6.9x EV/Revenue, 40.7x trailing P/E, 30.9x forward P/E, and 4.5x Price/Sales in TTM, above RNW at 6.4x EV/Revenue and 18.8x trailing P/E, XIFR at 5.1x and 4.5x, EGIEY at 4.4x and 7.8x, and CWEN at 8.3x and 40.3x; FRVO is not meaningfully comparable on earnings multiples because it has negative EBITDA and negative EPS. Ormat’s 30.9x forward P/E versus RNW’s 30.3x and CWEN’s 192.3x says the market is paying for steadier earnings than CWEN, but not enough of a discount to offset Ormat’s slower growth than RNW. On an illustrative peer-multiple basis, applying the peer EV/Revenue range of 4.4x to 8.3x to Ormat’s $1.214B of TTM revenue implies enterprise value of about $5.3B to $10B; netting Ormat’s $3.4B of debt and $348.5M of cash and dividing by 61.5M shares gives roughly $31 to $109 per share, which brackets the current $87.6 price and shows the stock is already near the upper half of the peer range. I read that as a valuation that already gives credit for quality, not a clear bargain.
Leverage
ORA — Leverage & Coverage (Quarterly)
| Metric | Value |
|---|---|
| Total Debt/Equity % (mrq) | 120.8 |
| Current Ratio (mrq) | 0.9 |
| Total Debt (mrq, USD Mil) | 3,355.1 |
| Operating Cash Flow (TTM, USD Mil) | 334 |
| Levered Free Cash Flow (TTM, USD Mil) | -349.6 |
| Net Debt/EBITDA (TTM) | — |
| FCF Margin % (TTM) | — |
Source: Yahoo Finance — Quarterly Financial Statements
Ormat’s leverage is elevated and the cash profile is weak. Total debt/equity was 120.8% in mrq, the current ratio was 0.923 in mrq, and total debt was $3.36B in mrq, so the balance sheet is carrying more debt than equity and less than one year of current assets for each dollar of current liabilities. Operating cash flow was 334M in TTM, but levered free cash flow was -$349.6M in TTM, which tells me EBITDA is not converting cleanly into cash because capex and financing demands are absorbing it. That gap is the key bridge between the operating moat and the valuation: the business can generate cash from operations, but the equity story only improves if project returns outpace the capital intensity. In my opinion, this is medium to high refinancing risk because the company has some operating cash generation, but the negative free cash flow means that cushion erodes unless project cash returns improve.
Leverage versus peers
| Company | Total Debt/Equity % (mrq) | Current Ratio (mrq) | Total Debt (mrq, USD Mil) | Operating Cash Flow TTM (USD Mil) | Free Cash Flow TTM (USD Mil) | Net Debt/EBITDA (TTM) | FCF Margin % (TTM) |
|---|---|---|---|---|---|---|---|
| ORA | 120.8 | 0.9 | 3,355.2 | 334 | -349.6 | — | — |
| FRVO | 14.3 | 7.9 | 431.3 | -74.8 | — | — | — |
| RNW | 514.5 | 0.5 | 826,044 | 93,201 | -60,904.4 | — | — |
| XIFR | 57.1 | 0.9 | 6,097 | 593 | -445.2 | — | — |
| EGIEY | 139.3 | 1.3 | 31,277.3 | 3,593.2 | 1,069 | — | — |
| CWEN | 177.9 | 1.5 | 10,259 | 1,116 | 222.2 | — | — |
Source: Yahoo Finance Note: RNW (ReNew Energy Global) and EGIEY (Engie Brasil Energia) report in local currency (Indian rupees and Brazilian reais), and Yahoo Finance shows those absolute amounts without converting them to dollars, so their dollar-scale columns are not comparable with the USD figures for the other companies. Ratios and percentages are comparable.
Ormat’s debt/equity of 120.8% is below RNW’s 514.5% and CWEN’s 177.9%, but above EGIEY’s 139.3%, XIFR’s 57.1%, FRVO’s 14.3%, and the cash-rich profiles of RNW and EGIEY. More importantly, Ormat’s current ratio of 0.9 and negative free cash flow of -$349.6M in TTM contrast with RNW’s 0.5 current ratio but positive operating cash flow of $93.2B and CWEN’s $222.2M of free cash flow. That combination says Ormat is not overlevered on paper, yet its cash conversion is weaker than the better-capitalized peers, so the balance sheet is a real constraint on upside.
Insider Activity
The insider transaction record I see here is one-sided: 28 open-market sales and 0 open-market purchases over 2024-03-01 to 2026-05-27. The selling is broad rather than concentrated, with multiple directors and an executive officer transacting, which weakens alignment even though some of the activity may be routine. I would not overread one trade, but the pattern is persistent enough to count as a mild negative.
Conclusion
I would put my rating as a Hold because Ormat combines a real contracted cash flow base with a balance sheet that still carries $3.4B of debt, so the upside from project wins is real but not clean enough to ignore refinancing risk. The strongest support is the PPA portfolio, but the biggest drag is still levered free cash flow at -$349.6M TTM, which means the company is funding growth rather than harvesting it. That tension is why I do not see the current numbers as evidence of a broken thesis, but I also do not see enough cash conversion yet to justify a more aggressive stance.
I would move toward a Buy if the Google data-center PPA and other contracted projects lift free cash flow back toward positive territory and reduce reliance on external funding. If annualized revenue can hold above about $1B, meaning the current run rate is sustained, and if the current ratio moves back above 1.0x, which would show the project pipeline is converting into cash fast enough to reduce balance-sheet strain, that would tell me the growth engine is finally paying for itself. The bear case is that the current cash conversion gap persists while the debt stack comes due. If levered free cash flow stays negative at a pace similar to the current -$349.6M TTM and the $476.4M of convertible senior notes due July 2027 have to be refinanced into a higher-rate market, the equity would absorb more financing cost before the new projects have fully paid back.
Weighing those two paths, I think the bear case is more likely to show up first because the cash flow gap is already visible while the upside from new PPAs and storage projects still needs time to flow through. I am not bearish enough for a Sell because the PPA base and project backlog are real, but I am not ready to pay a premium multiple for a business that has not yet proven it can convert that contracted growth into durable free cash flow.
What to Watch Next
- Free cash flow turning positive — would support moving the rating toward Buy.
- Current ratio back above 1.0x — would show liquidity is improving.
- Levered free cash flow staying near -$349.6M or worse — would keep refinancing risk elevated.
- Revenue holding above $1B annualized — would confirm the Q1 2026 ramp was not a one-off.
- 2027 convertible notes refinancing terms — tighter terms would pressure equity value further.
What’s your take? I rated Ormat Technologies (ORA) HOLD above — but the goal here is to get this right, not just to publish an opinion. What would you add to this analysis, or which risk or catalyst do you think I’m under- or over-weighting? Tell me in the comments.
Our track record: every directional call is tracked publicly on The Scorecard, and Stocks Covered lists every company we have rated and when.
Sources
- SEC 10-K Annual Report — filed 2026-02-26
- SEC 8-K Filing (2026-06-05)
- SEC 8-K Filing (2026-05-06)
- SEC 8-K Filing (2026-03-23)
- SEC 8-K Filing (2026-02-26)
- SEC 8-K Filing (2026-02-17)
- SEC Form 4 Insider Transaction (2026-06-04)
- SEC Form 4 Insider Transaction (2026-06-04)
- SEC Form 4 Insider Transaction (2026-06-04)
- SEC 10-K Annual Report — FY2026
- SEC 10-K Annual Report — FY2025
- SEC 10-K Annual Report — FY2024
- SEC 10-K Annual Report — FY2023
- SEC 10-K Annual Report — FY2022
Data sourced from Yahoo Finance and SEC EDGAR. Not investment advice.
Get daily options strategies built on our research
Sign up and get access to our private Discord and Telegram options channels, updated daily. Every play is built on our equity research and the rating we give the company.
Educational content only, not investment advice. Hypothetical results, not a guarantee of future performance.
Our options track record so far: +33% in 4 weeks, hypothetical and unrealised. See the track record.
Leave a Comment