Expected price range
Each range is set from the stock’s recent price history and our Hold rating, using its own 1-year realised volatility (50% annualised) as the width of a ~68% statistical band, and checked against that rating so the range leans the same way as our view. Starting price $2.57 (close 2026-11-20). The stock traded between $2.57 and $6.01 over the last 6 months and between $2.57 and $6.87 over the last year. This is an illustration of where our view and normal volatility point, not a forecast, price target or investment advice; the stock can move outside it.
| Company | Nov 25 | Dec 25 | Jan 26 | Feb 26 | Mar 26 | Apr 26 | May 26 | Jun 26 | Jul 26 | Aug 26 | Sep 26 | Oct 26 | 12-Mo |
|---|---|---|---|---|---|---|---|---|---|---|---|---|---|
| NIO | -24% | -7% | -8% | +4% | +24% | +6% | -12% | -10% | -4% | -13% | -19% | -6% | -56% |
| XPEV | -7% | -7% | -11% | -2% | -3% | -5% | +1% | -20% | -2% | -13% | -16% | -5% | -62% |
| LI | -12% | -8% | -2% | +6% | +1% | +0% | -16% | -22% | +16% | -11% | -6% | -3% | -47% |
| BYDDY | -3% | -3% | +2% | -3% | +13% | -2% | -13% | -20% | +29% | -7% | -13% | -9% | -32% |
| TSLA | -6% | +5% | -4% | -6% | -8% | +3% | +14% | -3% | -26% | +18% | -4% | +13% | -12% |
| RIVN | +24% | +17% | -25% | +4% | -2% | +9% | -1% | +6% | -12% | +6% | -7% | -19% | -10% |
Source: Yahoo Finance monthly adjusted close.
Quick Thesis
- Rated Hold — revenue growth is strong, but earnings conversion is still weak.
- Biggest strength: Q2 2026 revenue of $32.1B, showing scale is still expanding.
- Biggest risk: TTM operating margin of -3.3%, so growth is not yet self-funding.
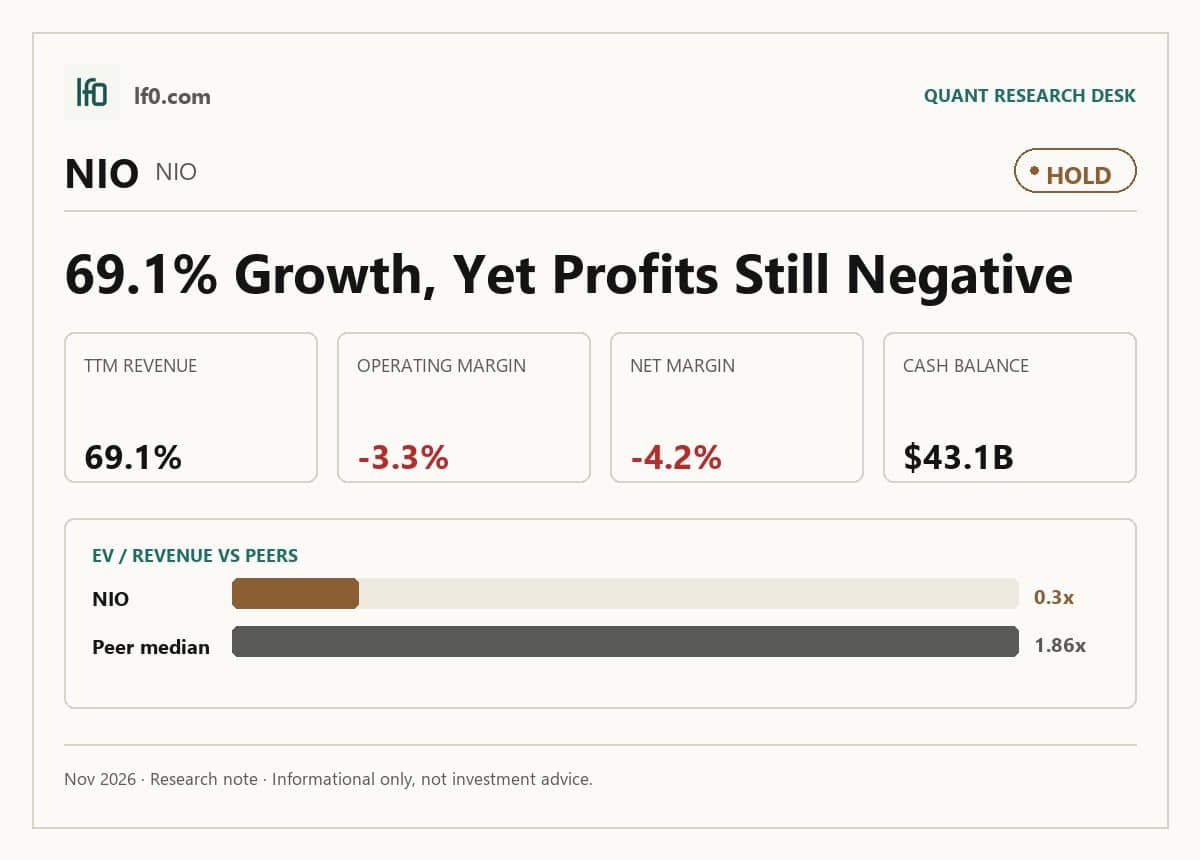
- Valuation is mixed: 0.3x EV/Revenue is cheap, but 48.5x forward P/E is not.
- I would raise my rating if operating margin turns positive for two quarters.
Executive Summary
Measured from adjusted close on 2026-11-20 to 2026-11-20. Sell ratings are correct when the stock falls; Hold is tracked as a +/-10% range. Daily-close data, not intraday. Calls are tracked for 182 days from publication, then frozen as a final record.
I would put my rating as a Hold because NIO’s revenue growth is still exceptional, but the business has not yet converted that scale into durable earnings or returns. Revenue reached $32.1B in Q2 2026 after $25.5B in Q1 2026, yet operating margin was still -3.3% TTM and ROE was -45.3% TTM, so the market is paying for a recovery that is visible in sales but not yet in profit.
I would raise my rating more towards a Buy if operating margin turns positive for two consecutive quarters and revenue stays above $30B per quarter, because that would show the company is finally absorbing fixed costs while keeping the current delivery scale. On the current revenue base, a move from -3.3% to a 5.0% operating margin would add roughly $9B of annual operating profit, which would materially change the cash burn profile and make the current 48.5x forward P/E easier to defend.
Company Profile
NIO Inc. was founded in November 2014 as NextEV Inc. and adopted its current name in July 2017. It designs, develops, manufactures and sells smart electric vehicles under three brands: NIO for premium models, ONVO for family vehicles, and FIREFLY for small high-end cars. In 2025, it delivered 326,028 vehicles, and in 2026 it added the ES9 flagship executive SUV launch after rolling out the ET9, the New ES6, the New EC6, the New ET5 and the New ET5T. The company operates from Shanghai and runs manufacturing in Anhui, with 416 service centers worldwide, 173 NIO Houses and 393 NIO Spaces, plus 419 ONVO Centers and ONVO Spaces in China as of December 31, 2025. It is listed on the New York Stock Exchange under NIO and financed through equity and debt, including Class A ordinary shares and 2027 Notes.
Economic Moat
Business Model
The battery swapping network is the most defensible part of NIO’s model, and in my view a well funded competitor cannot replicate the installed base, operating density, and user habit formation within three years. As of December 31, 2025, NIO had 3,737 Power Swap Stations and had completed over 96 million battery swaps cumulatively, which means the network is not just a hardware asset but a usage loop that reinforces repeat demand and makes the service harder to dislodge than a standalone charging app. The company also had more than 27,000 Power Chargers and Destination Chargers in operation and over 2,680,000 publicly accessible charging piles visible through Power Map, so the power ecosystem is broader than swapping alone and reduces range anxiety for buyers deciding whether to stay inside the brand. Secondary strengths are real but less unique: 6,404 issued patents and 3,246 patent applications pending support the technology stack, while 416 service centers worldwide and 173 NIO Houses plus 393 NIO Spaces give the brand a physical service and community layer that is difficult to copy quickly. I also view the in-house assisted and intelligent driving stack, including NIO WorldModel and NX9031, as a meaningful technical asset, but the swap network is the clearest structural edge because it combines infrastructure, software and user behavior in one system.
The moat is now broader than it was five years ago because the company has moved from a single-brand premium model toward a three-brand platform with a much larger installed base. That matters for the financials: the same network that supports customer retention also helps explain why revenue can scale quickly without the business looking like a commodity EV seller.
Business & Operating Risks
The most material disclosed risk is the company’s dependence on a still-evolving manufacturing and launch process, because the 20-F says its ability to develop and manufacture vehicles of sufficient quality and appeal to customers on schedule and on a large scale is still evolving. The filing ties that risk to delays in manufacturing and launching products and to the need to expand production capacity, which is exactly the bottleneck that can turn into missed deliveries, weaker brand perception and higher warranty cost. The financial data already shows the issue is not hypothetical, since the company reported net losses of RMB14,942.6 million in FY2025 after RMB22,401.7 million in FY2024, so any slip in launch timing or scale-up would hit a business that is only just moving toward profitability.
A second major risk is exposure to policy and trade shifts between the U.S., Europe and China. According to their SEC filings, the company faces changes in U.S. and European international trade policies, the January 2025 Bureau of Industry and Security rule on connected vehicles with a sufficient nexus to China, and the October 30, 2024 European Commission countervailing duties on battery electric vehicles from China for five years. Those are concrete policy actions, not generic geopolitical boilerplate, and they can affect both demand and cost structure in overseas markets where the company is still building scale. The risk is material because NIO is trying to expand internationally while its 2025 results still show a fragile earnings base.
The third risk that matters is the capital structure and cash need around NIO China. The filing says the company had RMB8,626.3 million of long-term borrowings and RMB5,347.9 million of short-term borrowings as of December 31, 2025, while also committing to additional NIO China investments and potential redemption obligations tied to the NIO China Series B investors. If the qualified initial public offering does not happen before December 31, 2028, those investors may request redemption, and the filing is explicit that substantial capital would be needed if that trigger is hit. That risk is already visible in the balance sheet because the company is still carrying meaningful debt while funding a capital-intensive business and a structurally subordinated China vehicle.
Taken together, these risks do not break the moat, but they do threaten the speed at which the battery-swap and brand ecosystem can turn into durable earnings. The structural advantage is intact; the question is whether execution and financing can keep pace with it.
Management Discussion & Analysis
Management is signalling that capital is still being used to fund growth, not to de-risk the balance sheet, and that is the right response to the operating risks above even if it keeps pressure on cash. Capital expenditures fell from RMB14.8B in 2023 to RMB9.5B in 2024 and RMB6.6B in 2025, yet the company still expects capex to remain significant as it expands charging, battery swap, delivery, servicing and retail infrastructure. That tells me management is still building the platform, but it also means cash will keep being absorbed before the business is fully self-funding.
The 2025 operating cash inflow of RMB2,992.6 million is a clear improvement from RMB7,849.2 million of operating cash outflow in 2024, so the near-term liquidity picture is better, but management still says future capital needs may require equity or debt financing if internal cash is not enough. The 2029 Notes and 2030 Notes, both issued in September 2023 with principal amounts of US$575M each outstanding at year-end 2025, push maturity risk out but do not reduce leverage, and the 2027 repurchase dates on those notes mean refinancing risk is deferred rather than removed. Gross margin rose to 13.6% in 2025 from 9.9% in 2024 and vehicle margin improved to 14.6% from 12.3%, so management’s margin-improvement message is supported, but the company still posted a RMB14.9B net loss in 2025.
That is the key point for me: management is responding to the execution risk with slower capex growth and better margins, but the balance sheet still depends on continued access to capital. The response is real, yet the risk is not fully behind the company.
Recent Events
The most important recent development is the continued broadening of the product and infrastructure base. The 2026 launch sequence, including the ET9, New ES6, New EC6, New ET5 and New ET5T, shows that NIO is still using product cadence to support the brand and keep the swap ecosystem relevant. I would read that as a sign that management is trying to deepen the moat rather than simply defend the current one.
The other material change is the shift to independent manufacturing after acquiring the F1 and F2 plant equipment and assets from JAC in December 2023. That matters because it gives NIO more control over product timing and cost structure, but it also makes execution more demanding as the portfolio expands. In my view, the recent events point to a company trying to turn its infrastructure advantage into a broader operating platform, not just a single-model EV business.
Financial Analysis
Growth
NIO — Financial Growth (Quarterly, USD Mil)
| Metric | 2025-06-30 | 2025-09-30 | 2025-12-31 | 2026-03-31 | 2026-06-30 |
|---|---|---|---|---|---|
| REVENUE (USD Mil) | 19,008.7 | 21,793.9 | 34,650.2 | 25,532.7 | 32,136.9 |
| EBIT (USD Mil) | -4,739.1 | -3,200.9 | 505.1 | -105.6 | -233.8 |
| EBITDA (USD Mil) | -4,739.1 | -3,200.9 | 505.1 | -105.6 | -233.8 |
| NET INCOME (USD Mil) | -5,141.3 | -3,660.8 | 122.4 | -496 | -721.6 |
| DILUTED EPS | -2.3 | -1.5 | 0.1 | -0.2 | -0.3 |
Source: Yahoo Finance — Quarterly Financial Statements
NIO’s revenue accelerated sharply into year-end before normalizing in 2026. Revenue rose from $19B in Q2 2025 to $21.8B in Q3 2025, then jumped to $34.7B in Q4 2025, before easing to $25.5B in Q1 2026 and rebounding to $32.1B in Q2 2026. The year-over-year growth rates were +8.8% in Q2 2025, +14.7% in Q3 2025, +45.0% in Q4 2025, +34.1% in Q1 2026 and +69.3% in Q2 2026, so the top line is still expanding fast. EBITDA and earnings are more volatile than revenue, with EBITDA negative in Q2 2025, Q3 2025, Q1 2026 and Q2 2026 despite a brief Q4 2025 profit. That pattern is a bear signal because growth is strong but not yet translating into consistent operating profit.
The revenue step-up is consistent with the broader product and brand expansion described above, but the lack of steady EBITDA follow-through tells me the moat is still buying scale rather than durable earnings. Investors should watch whether the newer brands can keep lifting revenue without forcing another round of margin repair.
Growth versus peers
| Company | Revenue TTM (USD Mil) | Revenue Growth YoY % | EBITDA TTM (USD Mil) | Diluted EPS TTM |
|---|---|---|---|---|
| NIO | 114,113.6 | 69.1% | 3,411.8 | -0.2 |
| XPEV | 79,307.2 | 19.1% | -1,484.2 | -0.6 |
| LI | 104,789.9 | -15.1% | -1,119.8 | -0.7 |
| BYDDY | 804,003.1 | 13.6% | 130,502.1 | 0.5 |
| TSLA | 103,570 | -0.2% | 9,838 | 0.9 |
| RIVN | 6,480 | 38.3% | -2,548 | -2.3 |
Source: Yahoo Finance
NIO’s revenue grew 69.1% TTM to $114.1B, far ahead of XPEV at 19.1%, BYDDY at 13.6%, TSLA at -0.2%, LI at -15.1% and RIVN at 38.3%. That premium is only partly justified because NIO still posted diluted EPS of -$0.2 TTM, so the market is paying for scale expansion before the model has proven earnings conversion.
Profitability
NIO — Profitability (TTM)
| Metric | TTM |
|---|---|
| Operating Margin (TTM) | -3.3% |
| Net Margin (TTM) | -4.2% |
| Return on Assets (TTM) | -2.0% |
| Return on Equity (TTM) | -45.3% |
| Gross Margin (TTM) | — |
| EBITDA Margin (TTM) | — |
Source: Yahoo Finance — Trailing Twelve Months (TTM)
TTM operating margin was -3.3%. Yahoo Finance does not report gross margin or EBITDA margin for NIO, so I am not drawing a conclusion from either. What the operating margin does say is that operating costs are still absorbing more than the revenue the business brings in, so NIO is still in the scale-building phase rather than a self-funding phase. TTM net margin was -4.2%, which means financing and other below-the-line items are still pushing the business further from break-even. TTM ROA was -2.0% and TTM ROE was -45.3%; the wide ROE gap versus ROA shows returns are being heavily amplified by leverage, so equity holders are not yet seeing durable capital efficiency.
The important cross-check is that the margin improvement management highlighted is real, but it has not yet reached the point where the business can absorb its fixed cost base. I would want to see operating margin move into positive territory and stay there before I treat the moat as monetized rather than merely visible.
Profitability versus peers
| Company | Operating Margin (TTM) | Net Margin (TTM) | Return on Assets (TTM) | Return on Equity (TTM) | Gross Margin (TTM) | EBITDA Margin (TTM) |
|---|---|---|---|---|---|---|
| NIO | -3.3% | -4.2% | -2.0% | -45.3% | — | — |
| XPEV | -5.1% | -4.5% | -2.4% | -12.2% | — | — |
| LI | -6.4% | -4.4% | -2.8% | -6.6% | — | — |
| BYDDY | 5.5% | 3.9% | 3.0% | 11.9% | — | — |
| TSLA | 3.0% | 3.1% | 1.3% | 3.8% | — | — |
| RIVN | -52.9% | -45.9% | -13.9% | -54.9% | — | — |
Source: Yahoo Finance
Profitability is the weakest part of the peer set. NIO’s operating margin of -3.3% and net margin of -4.2% are better than XPEV’s -5.1% and -4.5%, but worse than BYDDY’s 5.5% and 3.9%, TSLA’s 3.0% and 3.1%, and still below LI’s -6.4% and -4.4% on operating and net lines. The pattern points more to a scale and opex problem than a pure cost-of-revenue issue, because NIO’s margin gap versus XPEV is modest while both remain loss-making, yet BYDDY and TSLA show that the sector can generate positive operating leverage once volume and mix are better aligned.
Valuation
NIO — Valuation Multiples
| Metric | Value |
|---|---|
| Current Share Price (USD) | 2.6 |
| Market Cap (USD Mil) | 7,052 |
| Enterprise Value (USD Mil) | 4,938 |
| Trailing P/E | — |
| Forward P/E | 48.5 |
| Price/Sales (TTM) | 0.4 |
| Price/Book (mrq) | 11.4 |
| EV/Revenue | 0.3 |
| EV/EBITDA | — |
| Beta (5Y Monthly) | 0.90 |
| FCF Yield % (TTM) | — |
| Forward EPS (USD) | 0.1 |
| Analyst Target Price – Low (USD) | 3.7 |
| Analyst Target Price – Mean (USD) | 6.1 |
| Analyst Target Price – High (USD) | 10.2 |
| # Analyst Opinions | 23 |
Source: Yahoo Finance
NIO trades at 0.3x EV/Revenue and 0.4x price to sales on TTM figures, with the current share price at $2.56. Those are the right anchors here because trailing earnings are not usable: trailing P/E is not meaningful, while forward P/E is 48.5x on forward EPS of 0.125, which implies the market is already pricing in a sharp swing from the latest twelve months of negative profitability to a much cleaner earnings profile.
The rest of the valuation stack points the same way. Price to book is 11.4x, so investors are paying a large premium to the $0.2438 book value per share, which means the market is valuing future platform and brand economics rather than current net assets. Beta is 0.897, so the stock has moved a bit less than the market over time, but that does not make it cheap. The 52 week range of $2.66 to $7 and the 50 day and 200 day moving averages of $3.367 and $4.791 show the shares still trade well below recent levels.
With 23 analyst opinions, the mean target is $6.09, versus $3.71 low and $10.2 high. On my read, fair value sits in a $3.5-$6.5 range: that is above the current share price because the revenue base and swap network deserve some credit, but below the consensus high because I weight the still-negative operating margin and ROE more heavily than the market appears to. That range sits broadly inside the analyst mean, which tells me the market is not wildly mispriced here, just still waiting for proof that the earnings bridge can close. Forward EPS of 0.125 is also far below the earnings power implied by the higher-end peer multiples, so the stock is not being priced on near-term profit strength.
Valuation versus peers
| Company | Current Share Price (USD) | Trailing P/E | Forward P/E | EV/Revenue | EV/EBITDA | Price/Sales (TTM) | Price/Book (mrq) | Market Cap (USD Mil) | Enterprise Value (USD Mil) | Beta (5Y Monthly) | FCF Yield % (TTM) | Forward EPS | Analyst Target Price – Low | Analyst Target Price – Mean | Analyst Target Price – High | # Analyst Opinions |
|---|---|---|---|---|---|---|---|---|---|---|---|---|---|---|---|---|
| NIO | 2.6 | — | 48.5 | 0.3 | — | 0.4 | 11.4 | 7,052 | 4,938 | 0.90 | — | 0.1 | 3.7 | 6.1 | 10.2 | 23 |
| XPEV | 8.7 | — | 69.9 | 1.1 | — | 0.8 | 2.3 | 9,655 | 12,086 | 0.98 | — | -0.2 | 8 | 16.1 | 25.4 | 25 |
| LI | 11 | 99.4 | 137 | 0 | — | 0.8 | 1.1 | 11,344 | 709 | 0.40 | — | 0.4 | 9 | 15 | 20.7 | 23 |
| BYDDY | 7.8 | 15.5 | 10.5 | 0.8 | 16.2 | 0.6 | 1.8 | 104,992 | 104,579 | 0.35 | — | 0.8 | 13 | 13 | 13 | 1 |
| TSLA | 372.4 | 421.7 | 156.2 | 14.4 | 132.1 | 13.1 | 17 | 1,516,742 | 1,487,971 | 1.74 | — | 2.2 | 128.1 | 412.5 | 600 | 40 |
| RIVN | 11.1 | — | — | 2.7 | — | 2.4 | 3 | 17,273 | 17,202 | 1.64 | — | -1.8 | 10 | 17.7 | 25 | 25 |
Source: Yahoo Finance
NIO trades at 0.3x EV/Revenue and 0.4x price/sales, below XPEV at 1.1x and 0.8x, RIVN at 2.7x and 2.4x, TSLA at 14.4x and 13.1x, and even LI at 0.0x and 0.8x, while its 48.5x forward P/E sits below XPEV’s 69.9x and LI’s 137.0x but above BYDDY’s 10.5x. Using the peer EV/Revenue range on NIO’s $114.1B revenue gives an implied enterprise value that is too wide to be decision-useful, but the direction is clear: the market is paying for growth optionality, not for current earnings power. Forward EPS of $0.1 is also far below TSLA’s $2.2 and BYDDY’s $0.8, so the stock is not being priced on near-term profit strength.
Leverage
NIO — Leverage & Coverage (Quarterly)
| Metric | Value |
|---|---|
| Total Debt/Equity % (mrq) | 203.2 |
| Current Ratio (mrq) | 1 |
| Total Debt (mrq, USD Mil) | 28,995.9 |
| Operating Cash Flow (TTM, USD Mil) | — |
| Levered Free Cash Flow (TTM, USD Mil) | — |
| Net Debt/EBITDA (TTM) | — |
| FCF Margin % (TTM) | — |
Source: Yahoo Finance — Quarterly Financial Statements
NIO’s leverage is heavy, but the cash cushion softens the raw debt load. Total Debt/Equity was 203.2% mrq, Total Debt was $29B mrq, and the Current Ratio was 1.019 mrq, so the company has just enough short-term asset coverage to avoid an immediate funding squeeze, but not much room for error. The balance sheet is still carrying more debt than equity, which leaves refinancing terms important if cash generation weakens.
The cash flow picture is the bigger issue. Operating Cash Flow and Levered Free Cash Flow were not reported in the leverage table, but the company’s latest annual filing shows a 2025 revenue base of $12.5B and a loss profile that points to weak cash conversion, not surplus cash. In my opinion, this is high refinancing risk because the current ratio is only 1.019 and the debt load is large enough that any further margin pressure would quickly tighten flexibility. The leverage profile also explains why the valuation debate is so sensitive to margin progress: if operating profit does not improve, the debt burden limits how much of the revenue growth can flow through to equity value.
Leverage versus peers
| Company | Total Debt/Equity % (mrq) | Current Ratio (mrq) | Total Debt (mrq, USD Mil) | Operating Cash Flow TTM (USD Mil) | Free Cash Flow TTM (USD Mil) | Net Debt/EBITDA (TTM) | FCF Margin % (TTM) |
|---|---|---|---|---|---|---|---|
| NIO | 203.2 | 1 | 28,995.9 | — | — | — | — |
| XPEV | 95.1 | 1.1 | 27,724 | — | — | — | — |
| LI | 22.3 | 1.8 | 14,691.9 | -9,950.2 | -9,747.7 | — | — |
| BYDDY | 37.9 | 0.8 | 105,637.2 | 72,759.6 | -107,390.6 | — | — |
| TSLA | 18.3 | 1.7 | 16,445 | 18,710 | 4,967.2 | — | — |
| RIVN | 95 | 2.2 | 5,431 | -2,629 | -2,192.8 | — | — |
Source: Yahoo Finance
Leverage is heavy, but the cash cushion softens the raw debt load. NIO’s debt to equity is 203.2%, above XPEV’s 95.1%, RIVN’s 95.0%, TSLA’s 18.3%, LI’s 22.3% and BYDDY’s 37.9%, yet its current ratio of 1.0 is only slightly below XPEV’s 1.1 and above LI’s 1.8, while its $43.1B cash, or $17.26 per share, is the key offset. The balance sheet is still stretched, but the cash per share figure means the market is not staring at an immediate liquidity problem the way it would with a weaker current ratio and no cash buffer. That leverage gap also helps explain why NIO’s valuation is not as rich as TSLA’s despite much faster revenue growth: investors are paying less for the same growth because the balance sheet is less forgiving.
Insider Activity
The insider transaction record I see here is limited to 3 Form 4 filings on 2026-06-01, and none of them are open-market purchases or sales. The activity is entirely option exercises and tax withholding, so the pattern is neither net buying nor net selling and it does not show a broad alignment shift between insiders and shareholders. This is a neutral signal.
Conclusion
I would put my rating as a Hold because NIO’s revenue growth is real, but the company has not yet shown that it can turn that growth into durable earnings while carrying a heavy balance sheet. The key tension is that the moat is visible in the swap network and brand platform, yet the numbers still show -3.3% operating margin and -45.3% ROE, so the equity case depends on execution catching up with infrastructure.
I would raise my rating more towards a Buy if operating margin turns positive for two consecutive quarters and revenue stays above $30B per quarter, because that would show the fixed-cost base is finally being absorbed at scale. If that happens, the current 48.5x forward P/E becomes easier to justify because the earnings base would be moving in the same direction as the revenue base, not lagging it. Free cash flow turning positive would be an additional confirmation that growth is funding itself rather than leaning on the balance sheet.
The bear case is that revenue growth stays strong but margins remain negative, or that the company keeps expanding volume while losses stay near the FY2025 level of RMB14.9B. If operating margin slips back below -5.0% for two quarters, or if the current ratio falls below 1.0 while debt stays above 200% of equity, I would move from Hold to Sell because the equity would be funding growth without a clear path to self-sustaining profitability. That would also make the 11.4x price to book look more like a claim on future hope than on current asset value.
Weighing both sides, I think the bull case is more likely to arrive first, but only gradually. The delivery base and swap network are real assets, yet the latest numbers still say the market is ahead of the earnings. Until the margin line catches up with the revenue line, I think the stock deserves patience rather than conviction.
What to Watch Next
- Operating margin above 0% for two quarters — would support a move toward Buy.
- Revenue above $30B per quarter — would show scale is holding after the Q4 spike.
- Free cash flow turning positive — would confirm growth is funding itself.
- Current ratio below 1.0 — would raise refinancing pressure further.
- Debt/Equity staying above 200% — would keep leverage a key constraint on equity value.
What’s your take? I rated NIO (NIO) HOLD above — but the goal here is to get this right, not just to publish an opinion. What would you add to this analysis, or which risk or catalyst do you think I’m under- or over-weighting? Tell me in the comments.
Our track record: every directional call is tracked publicly on The Scorecard, and Stocks Covered lists every company we have rated and when.
Sources
- SEC Form 4 Insider Transaction (2026-06-01)
- SEC Form 4 Insider Transaction (2026-06-01)
- SEC Form 4 Insider Transaction (2026-06-01)
Data sourced from Yahoo Finance and SEC EDGAR. Not investment advice.
Get daily options strategies built on our research
Sign up and get access to our private Discord and Telegram options channels, updated daily. Every play is built on our equity research and the rating we give the company.
Educational content only, not investment advice. Hypothetical results, not a guarantee of future performance.
Our options track record so far: +33% in 4 weeks, hypothetical and unrealised. See the track record.
Leave a Comment