
Executive Summary
Rating: SELL | FTNT
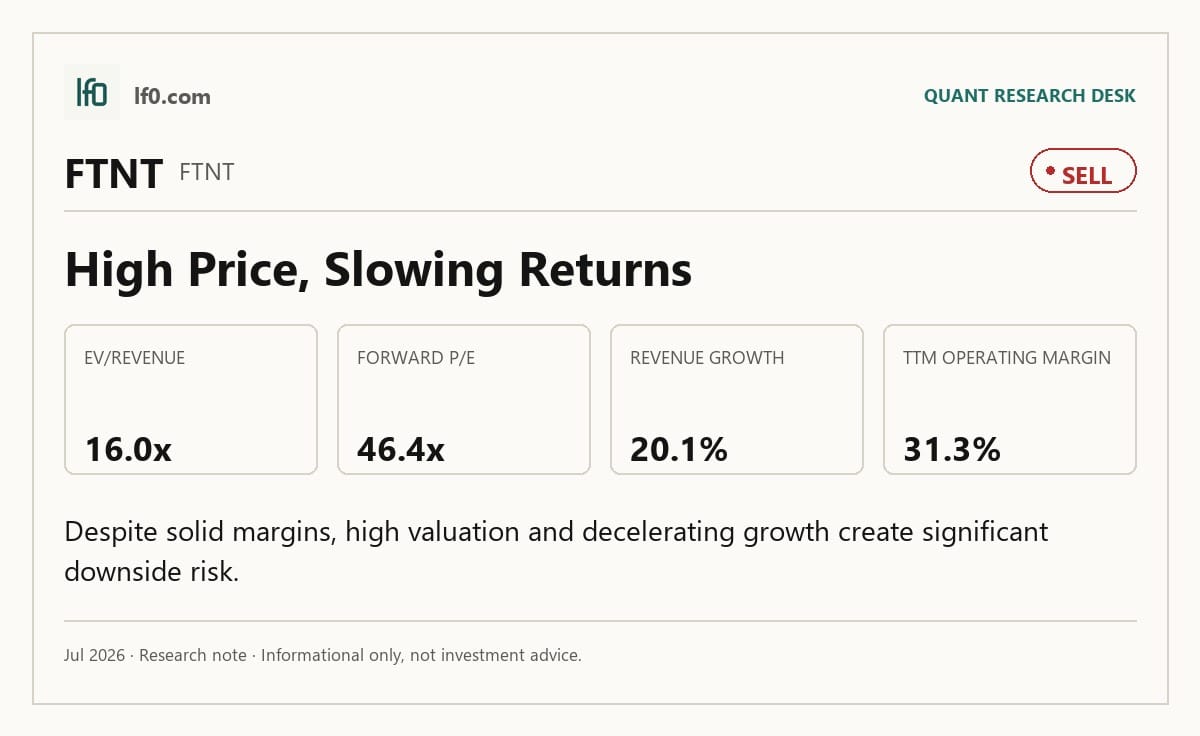
I would put my rating as a Sell because Fortinet’s valuation already discounts a long runway of premium execution, yet the company is still growing at a pace that trails the fastest security peers. Revenue rose 20.1% year over year in Q1 2026, but that is not enough to justify 16.0x EV/revenue and 46.4x forward P/E when PANW and NET are growing faster. In my view, the key tension is that the moat is real, but the market is paying for more growth than the business is currently delivering. I would move more toward a Buy only if revenue growth reaccelerates above 25.0%, meaning it closes the gap with the faster security names, while operating margin stays near 31.3%.
Company Profile
Fortinet was incorporated in Delaware in November 2000 and is listed on Nasdaq under FTNT. It sells cybersecurity hardware, software, and subscription services through the Fortinet Security Fabric, which combines secure networking, unified secure access service edge, and AI-driven security operations. Revenue comes from appliance sales, cloud and software subscriptions, FortiGuard security services, and FortiCare technical support, with products sold mainly through distributors, resellers, managed security service providers, and direct enterprise sales. As of December 31, 2025, it served customers in more than 100 countries, employed 15,109 people, and held 1,405 global patents. Fortinet is headquartered in Sunnyvale, California, with research and development centered in the United States and Canada and a global support and cloud footprint that includes more than 190 points of presence.
Economic Moat
Business Model
FortiOS, Fortinet’s unified operating system, is the clearest structural advantage because it lets the company enforce one policy layer across secure networking, unified SASE, and AI-driven SecOps in a way I think is hard for a well-funded competitor to copy quickly. It is not a single feature but an installed software and hardware stack that spans physical, virtual, cloud, and SaaS deployments, and it is reinforced by proprietary FortiASIC security processing units that improve throughput, lower power use, and support encrypted traffic inspection at scale. The current 10-K also shows support from 1,405 global patents, including 321 AI-related patents, 190+ PoPs for Unified SASE, and FortiGuard Labs’ millions of global sensors, which deepen product integration and threat intelligence. Fortinet’s broad channel model through distributors such as Arrow Electronics, Ingram Micro, and TD Synnex amplifies the platform rather than defining the moat. In my view, that architecture is a bull signal because it makes vendor replacement costly and slow.
Business & Operating Risks
The most material risk is channel concentration, because according to the risk factors in their SEC 10-K, substantially all revenue comes from sales by channel partners, and one distributor accounted for 32% of total net accounts receivable as of December 31, 2025. That structure can hit billings, cash collection, and pricing at the same time if a large distributor slows purchases or stretches payment terms. Quarter-end shipment concentration is the next pressure point: Fortinet historically received a substantial portion of each quarter’s sales orders and generated a substantial portion of billings and revenue during the last two weeks of the quarter, so a logistics delay or power outage could push a material amount of products out of the period. Product and service quality risk is also central after the company recently disclosed a critical vulnerability in FortiManager and released a patch. Supply chain risk remains real as well, especially with the global shortage of memory chips and the fact that most hardware is manufactured in Taiwan. Taken together, these risks do not break the moat, but they do test the managed-platform advantage by putting channel control, product trust, and quarter-end execution under pressure.
Management Discussion & Analysis
Management is signaling a heavier 2026 investment cycle, not a cash-hoarding phase, and it is actively responding to the execution risks by keeping the balance sheet flexible while funding the platform. Fortinet expects total revenue to increase in 2026, but it also expects expenses to outpace revenue growth because of sales and marketing headcount, product development, and continued capital expenditures in data centers and real estate. That combination points to lower operating margin in 2026 versus 30.7% in 2025, so investors should read the guidance as a deliberate tradeoff of near-term margin for longer-term scale. The company also plans to keep expanding its data center, point of presence, office, and warehouse footprint, with $350M to $450M in 2026 capital expenditures, which supports unified SASE and security operations growth but also ties up cash that could otherwise go to buybacks. Capital return remains aggressive: the board lifted the repurchase authorization to $10.25B through February 28, 2027, and Fortinet repurchased 6.1 million shares for $470.5M after year-end at an average price of $76.68. I do not see a financing strain, because Fortinet still expects to repay the 2026 Senior Notes due March 15, 2026 from its $3.9B of cash, cash equivalents, and investments.
Management’s track record is mixed but not poor. In 2025, prior filings expected operating expense to rise in absolute dollars and share repurchases to continue, and the company did both: operating expenses increased to $3.4B from $3B in 2024, and it repurchased $2.3B of stock in 2025. The 2024 and 2023 filings repeatedly emphasized continued growth, market share gains, and higher operating expense, and the 2025 results did deliver 14% revenue growth to $6.8B and 16% operating income growth to $2.1B, so the growth narrative was directionally right even if it was broad. The one credibility gap is that management has long framed growth as being supported by operating leverage, yet 2026 guidance now explicitly calls for margin compression because spending will outpace revenue.
Recent Events
The most significant development I see here is that both 8-Ks, filed on February 5, 2026 and May 6, 2026, were limited to routine earnings releases for Q4 2025 and Q1 2026. I do not see any acquisition, divestiture, leadership change, financing action, or regulatory event that would alter Fortinet’s competitive position on its own.
Financial Analysis
Growth
FTNT — Financial Growth (Quarterly, USD Mil)
| Metric | 2025-03-31 | 2025-06-30 | 2025-09-30 | 2025-12-31 | 2026-03-31 |
|---|---|---|---|---|---|
| REVENUE (USD Mil) | 1,539.7 | 1,630 | 1,724.9 | 1,905 | 1,849.6 |
| EBIT (USD Mil) | 524.2 | 521.9 | 601 | 655.2 | 660.8 |
| EBITDA (USD Mil) | 560 | 560.2 | 639.4 | 694.7 | 700.6 |
| NET INCOME (USD Mil) | 433.4 | 440.1 | 473.9 | 506 | 534.5 |
| DILUTED EPS | 0.6 | 0.6 | 0.6 | 0.7 | 0.7 |
Source: Yahoo Finance — Quarterly Financial Statements
Revenue rose from $1.5B in Q1 2025 to $1.8B in Q1 2026, with the path moving from $1.6B to $1.7B to $1.9B before a slight pullback in the latest quarter. EBITDA increased from $560M to $701M over the same span, so profit is growing faster than sales. The Q1 2026 dip versus Q4 2025 looks like normal quarter-to-quarter variability, which Fortinet’s MD&A explicitly flags in sales by quarter. Growth is a bull signal because revenue is still up 20.1% year over year and earnings are scaling faster than the top line.
Profitability
FTNT — Profitability (TTM)
| Metric | TTM |
|---|---|
| Operating Margin (TTM) | 31.3% |
| Net Margin (TTM) | 27.5% |
| Return on Assets (TTM) | 13.6% |
| Return on Equity (TTM) | 132.4% |
| Gross Margin (TTM) | 80.3% |
| EBITDA Margin (TTM) | 33.2% |
Source: Yahoo Finance — Trailing Twelve Months (TTM)
TTM gross margin of 80.3% shows Fortinet still keeps most of each dollar after cost of revenue, so the core product and service mix remains healthy. The gap to TTM EBITDA margin of 33.2% is wide, which means operating expenses are still absorbing 47.1 percentage points of revenue; investors should watch whether that spread narrows, because that is the clearest sign of operating leverage rather than just gross profit quality. TTM operating margin of 31.3% and TTM net margin of 27.5% are both solid, and the smaller gap between them suggests below-the-line items are not materially distorting earnings. TTM ROA of 13.6% and TTM ROE of 132% point to very high capital efficiency, but the ROE-to-ROA gap also shows returns are amplified by leverage and a light equity base, so ROE should not be read as purely organic business strength. Profitability is a bull signal because margins are high and the path to further leverage remains visible.
Valuation
FTNT — Valuation Multiples
| Metric | Value |
|---|---|
| Market Cap (USD Mil) | 116,476 |
| Enterprise Value (USD Mil) | 113,749 |
| Trailing P/E | 61.6 |
| Forward P/E | 46.4 |
| Price/Sales (TTM) | 16.4 |
| Price/Book (mrq) | 117.9 |
| EV/Revenue | 16 |
| EV/EBITDA | 48.2 |
| Beta (5Y Monthly) | 1.11 |
| FCF Yield % (TTM) | 1.6% |
| Forward EPS (USD) | 3.4 |
| Analyst Target Price – Low (USD) | 70 |
| Analyst Target Price – Mean (USD) | 113.8 |
| Analyst Target Price – High (USD) | 180 |
| # Analyst Opinions | 37 |
Source: Yahoo Finance
Fortinet screens as expensive on every major valuation lens. EV/revenue at 16.0x implies the market is paying for a long runway of durable growth and high conversion of sales into cash, not just today’s earnings. That read is reinforced by price/sales of 16.4x and a PEG ratio of 3.5x, so the stock is priced for growth that must stay well above the broader software and security group for years.
Earnings multiples are also rich: trailing P/E is 61.6x and forward P/E is 46.4x, which means the market is already discounting a meaningful step-up in per-share earnings to 3.43. EV/EBITDA is 48.2x, a level that leaves little room for execution slips even though EBITDA is already substantial. FCF yield is 1.56%, which is a low cash return for a 116000 equity value and tells me the stock is not cheap on cash generation either.
Price/book is 118x, so book value is not a useful anchor here because the business is valued on software-like earnings power rather than tangible assets. Beta is 1.11x, which suggests the multiple is not being justified by unusually low risk. On the analysis here, I would put fair value in a wide range of roughly $70–$180, which brackets the analyst target range and tells me the market is already debating whether Fortinet deserves a premium multiple or merely a good one. That range is not a guarantee; it sits inside the $70 low, $114 mean, and $180 high analyst targets, so consensus is already centered on a premium outcome. The implied earnings path is also rich versus peers: Fortinet’s 3.43 forward EPS is below PANW’s 4.1 and ZS’s 4.6, yet its forward P/E is higher than both, which means the market is paying more for each dollar of expected earnings than it is for the faster growers. In my view, that is hard to justify unless margin expansion resumes and cash flow keeps compounding.
Leverage
FTNT — Leverage & Coverage (Quarterly)
| Metric | Value |
|---|---|
| Total Debt/Equity % (mrq) | 57.3 |
| Current Ratio (mrq) | 1.2 |
| Total Debt (mrq, USD Mil) | 567.2 |
| Operating Cash Flow (TTM, USD Mil) | 2,804.4 |
| Levered Free Cash Flow (TTM, USD Mil) | 1,813 |
| Net Debt/EBITDA (TTM) | -1.2 |
| FCF Margin % (TTM) | 25.5% |
Source: Yahoo Finance — Quarterly Financial Statements
Fortinet has a modest debt load and very strong cash generation. Total debt/equity was 57.31%, current ratio was 1.153x, and total debt was $567.2M. Operating cash flow was $2.8B, levered free cash flow was $1.8B, net debt/EBITDA was -1.2x, and FCF margin was 25.5%. EBITDA looks solid, but the cash story is stronger because free cash flow remains high after capex and interest, so the balance sheet has room to absorb a downturn. In my opinion, refinancing risk is low because net cash exceeds debt and there is no near-term liquidity strain unless cash conversion weakens materially. This is a bull signal for financial flexibility, and it also helps explain why the company can fund buybacks while still investing in the platform described above.
Insider Activity
The insider transaction record I see here is clearly net selling: 69 open-market sales totaling $169.4M versus 2 purchases totaling $69,790 over 80 filings parsed from 2024-12-31 to 2026-06-04. The activity is broad and not just one seller, with both the CEO and CTO selling in size, which weakens the alignment signal for outside shareholders. I would not overread it as a business warning on its own, but it does sit awkwardly next to the aggressive buyback program and the premium valuation. This is a bear signal.
Comparable Analysis
Growth
| Company | Revenue TTM (USD Mil) | Revenue Growth YoY % | Diluted EPS TTM |
|---|---|---|---|
| FTNT | 7,109.5 | 20.1% | 2.6 |
| ZS | 3,173.6 | 25.4% | -0.5 |
| PANW | 10,606.5 | 31.1% | 1.2 |
| CHKP | 2,756 | 4.8% | 9.7 |
| NET | 2,328.6 | 33.5% | -0.2 |
| QLYS | 684.9 | 9.8% | 5.6 |
Source: Yahoo Finance
FTNT’s 20.1% revenue growth is solid, but it trails PANW at 31.1% and NET at 33.5% while slightly lagging ZS at 25.4% and beating QLYS at 9.8% and CHKP at 4.8%. That gap says FTNT is not the fastest grower in the group, so the premium multiple needs support from better margins and cash generation rather than growth alone.
Valuation
| Company | Trailing P/E | Forward P/E | EV/Revenue | EV/EBITDA | Price/Sales (TTM) | Price/Book (mrq) | Market Cap (USD Mil) | Enterprise Value (USD Mil) | Beta (5Y Monthly) | FCF Yield % (TTM) | Forward EPS | Analyst Target Price – Low | Analyst Target Price – Mean | Analyst Target Price – High | # Analyst Opinions |
|---|---|---|---|---|---|---|---|---|---|---|---|---|---|---|---|
| FTNT | 61.6 | 46.4 | 16 | 48.2 | 16.4 | 117.9 | 116,476 | 113,749 | 1.11 | 1.6% | 3.4 | 70 | 113.8 | 180 | 37 |
| ZS | — | 31.9 | 6.9 | -362.1 | 7.5 | 10 | 23,682 | 22,011 | 0.96 | 4.7% | 4.6 | 145 | 192.6 | 250 | 44 |
| PANW | 303.5 | 85.5 | 27 | 192.7 | 27.1 | 10.3 | 286,913 | 285,932 | 0.94 | 1.2% | 4.1 | 162.3 | 317.3 | 433 | 50 |
| CHKP | 13.8 | 11.8 | 4.8 | 15.2 | 5.1 | 5 | 13,970 | 13,265 | 0.49 | 5.2% | 11.4 | 120 | 145.7 | 201 | 32 |
| NET | — | 156 | 37.1 | -2,381.9 | 37.5 | 57 | 87,425 | 86,423 | 1.67 | 0.9% | 1.6 | 136 | 243.6 | 305 | 31 |
| QLYS | 25.8 | 17.3 | 6.8 | 18.9 | 7.4 | 8.9 | 5,052 | 4,632 | 0.65 | 4.7% | 8.3 | 85 | 108.9 | 161 | 18 |
Source: Yahoo Finance
FTNT trades at 16.0x EV/revenue, 46.4x forward P/E, 16.4x price/sales, and a 3.5x PEG ratio, versus CHKP at 4.8x EV/revenue, 11.8x forward P/E, 5.2% FCF yield, and QLYS at 6.8x EV/revenue, 17.3x forward P/E, 4.7% FCF yield. ZS is the closest growth peer on revenue growth at 25.4%, yet it trades at 6.9x EV/revenue and 31.9x forward P/E, which means FTNT’s multiple is still well above a slower-growing but cash-rich software peer set. Using the peer EV/revenue range of 4.8x to 37.1x on FTNT’s $7.1B revenue implies enterprise value of $34.2B to $263.9B, or about $46.5 to $360.6 per share after netting $3.3B cash and $567.2M debt across 732.6M shares; that wide range shows the stock is priced for continued premium execution, not just current results. A $1 investment a year ago would be worth $1.55 in FTNT, versus $1.78 in PANW, $1.33 in NET, $0.48 in ZS, $0.99 in QLYS, and $0.61 in CHKP, so the market has rewarded FTNT but not as much as the fastest growers. I think that is consistent with the valuation gap: FTNT is being priced as a quality compounder, but not as the category’s fastest growth name.
Profitability
| Company | Operating Margin (TTM) | Net Margin (TTM) | Return on Assets (TTM) | Return on Equity (TTM) | Gross Margin (TTM) | EBITDA Margin (TTM) |
|---|---|---|---|---|---|---|
| FTNT | 31.3% | 27.5% | 13.6% | 132.4% | 80.3% | 33.2% |
| ZS | -3.3% | -2.4% | -1.4% | -3.7% | 76.7% | -1.9% |
| PANW | -2.5% | 7.9% | 1.8% | 4.8% | 72.0% | 14.0% |
| CHKP | 27.7% | 38.4% | 7.8% | 38.0% | 87.7% | 31.7% |
| NET | -9.7% | -3.7% | -2.7% | -5.9% | 73.3% | -1.6% |
| QLYS | 35.0% | 29.4% | 13.9% | 37.7% | 83.2% | 35.8% |
Source: Yahoo Finance
FTNT’s 80.3% gross margin, 33.2% EBITDA margin, 31.3% operating margin, and 27.5% net margin all exceed ZS at 76.7%, -1.9%, -3.3%, and -2.4%, PANW at 72.0%, 14.0%, -2.5%, and 7.9%, and CHKP at 87.7%, 31.7%, 27.7%, and 38.4%. The pattern is not a cost-of-revenue problem, because FTNT’s gross margin is already near the top of the set; the real edge is operating leverage, which means the premium is tied to scale efficiency rather than product gross economics. FTNT’s 132% ROE and 13.6% ROA also lead the group, which supports the view that the business converts its asset base into earnings more efficiently than most peers.
Leverage
| Company | Total Debt/Equity % (mrq) | Current Ratio (mrq) | Total Debt (mrq, USD Mil) | Operating Cash Flow TTM (USD Mil) | Free Cash Flow TTM (USD Mil) | Net Debt/EBITDA (TTM) | FCF Margin % (TTM) |
|---|---|---|---|---|---|---|---|
| FTNT | 57.3 | 1.2 | 567.2 | 2,804.4 | 1,813 | -1.2 | 25.5% |
| ZS | 78.9 | 1.9 | 1,868.2 | 1,101 | 1,108.8 | 27.5 | 34.9% |
| PANW | 7.7 | 0.9 | 2,130 | 4,217 | 3,579.4 | -0.7 | 33.8% |
| CHKP | 70.1 | 1.9 | 1,973.5 | 1,223.6 | 730.3 | -0.9 | 26.5% |
| NET | 230.9 | 2 | 3,524.5 | 615.7 | 755 | 17.6 | 32.4% |
| QLYS | 9.2 | 1.4 | 52.2 | 295.1 | 237.4 | -1.7 | 34.7% |
Source: Yahoo Finance
FTNT’s 57.31% debt to equity is higher than PANW’s 7.7% and QLYS’s 9.2%, yet its net debt to EBITDA is -1.2x because cash exceeds debt, which is a much better read for a software vendor than raw debt alone. Its 25.5% FCF margin is below ZS at 34.9% and QLYS at 34.7%, but above CHKP at 26.5%, so the balance sheet is not a constraint and the cash conversion is good enough to fund growth without financial stress. That leverage profile also helps explain why Fortinet can sustain buybacks while still investing in the platform, even though the valuation already assumes a lot of that flexibility.
Conclusion
I would put my rating as a Sell because Fortinet’s premium valuation is already ahead of the evidence in the growth line, and the market is paying for a stronger acceleration than the company has yet delivered. The moat is real, the margins are excellent, and cash generation is strong, but those positives are already visible in the numbers and do not fully offset the fact that revenue growth is 20.1% rather than peer-leading.
The bull case is straightforward: if revenue growth reaccelerates above 25.0%, meaning it closes the gap with the faster security names, and operating margin stays near 31.3% while the company turns the current $1.8B levered free cash flow base into something closer to $2B, then the premium multiple becomes easier to defend. That would tell me the platform is scaling without sacrificing profitability, which is the outcome the valuation is currently assuming.
The bear case is just as clear. If revenue growth falls below 15.0% for two consecutive quarters, the current multiple would be paying for a growth rate the business is no longer delivering. I would also turn more cautious if operating margin slips toward the low 20s, because that would mean the 2026 expense step-up is not buying enough future revenue to justify the near-term compression.
Weighing both sides, I think the bear case is more likely to show up first because the valuation already assumes the bull case before the 2026 spending cycle has had time to prove itself. Fortinet is still a high-quality franchise, but at this price I want to see the next leg of growth before I pay up for it.
What’s your take? I rated Fortinet (FTNT) SELL above — but the goal here is to get this right, not just to publish an opinion. What would you add to this analysis, or which risk or catalyst do you think I’m under- or over-weighting? Tell me in the comments.
Sources
- SEC 10-K Annual Report — filed 2026-02-25
- SEC 8-K Filing (2026-05-06)
- SEC 8-K Filing (2026-02-05)
- SEC Form 4 Insider Transaction (2026-06-05)
- SEC Form 4 Insider Transaction (2026-06-03)
- SEC Form 4 Insider Transaction (2026-06-03)
- SEC 10-K Annual Report — FY2026
- SEC 10-K Annual Report — FY2025
- SEC 10-K Annual Report — FY2024
- SEC 10-K Annual Report — FY2023
- SEC 10-K Annual Report — FY2022
Data sourced from Yahoo Finance and SEC EDGAR. Not investment advice.
Leave a Comment