
| Company | Oct 25 | Nov 25 | Dec 25 | Jan 26 | Feb 26 | Mar 26 | Apr 26 | May 26 | Jun 26 | Jul 26 | Aug 26 | Sep 26 | 12-Mo |
|---|---|---|---|---|---|---|---|---|---|---|---|---|---|
| LYB | -5% | +6% | -9% | +13% | +17% | +42% | -7% | -11% | -20% | +18% | +6% | -12% | +25% |
| DOW | +4% | +1% | -2% | +18% | +13% | +36% | -3% | -16% | -19% | +11% | +2% | -10% | +26% |
| DD | +5% | +17% | +1% | +9% | +14% | -8% | -0% | +6% | -7% | +1% | -1% | -3% | +35% |
| WLK | -11% | -2% | +11% | +7% | +33% | +11% | -1% | -24% | -16% | -3% | +7% | -17% | -17% |
| CE | -9% | +8% | +2% | +5% | +12% | +32% | +3% | -22% | -13% | -3% | +2% | -2% | +6% |
| HUN | -8% | +26% | -3% | +8% | +17% | +6% | +8% | +7% | -30% | -8% | -2% | -11% | -4% |
Source: Yahoo Finance monthly adjusted close.
Quick Thesis
- Rated Hold — the recovery is real, but earnings quality is not yet clean enough.
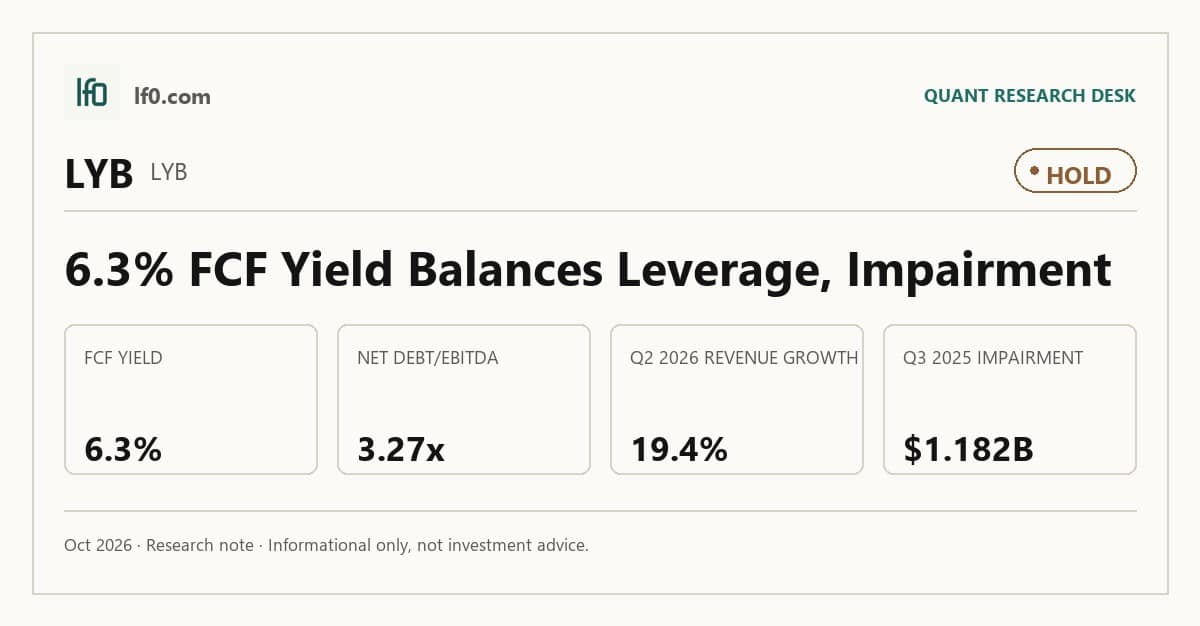
- Strongest support: 6.3% FCF yield and $1.3B Q2 2026 EBITDA.
- Biggest risk: 3.3x net debt/EBITDA, with a $1.182B Q3 2025 impairment showing cycle sensitivity.
- Valuation looks fair at 8.77x EV/EBITDA and 9.7x forward P/E.
- I would turn more constructive if net margin stays positive for two straight quarters.
Performance Since Our Last Call
I last covered LYB on 2026-06-10 with a Hold rating, and the stock has fallen 6.4% since then, from $64.48 to $60.34. That is broadly consistent with a Hold-range call: the shares have not broken down, but they also have not rewarded the recovery case enough to force a higher conviction view. The fresh numbers in this article still show the same tension, with stronger Q2 2026 operating data offset by leverage and margin quality that remain only partly repaired. I am keeping the same middle-ground stance because the new evidence improves the operating picture without yet clearing the balance-sheet and earnings-quality hurdle.
Executive Summary
Rating: HOLD | LYB
Measured from adjusted close on 2026-06-10 to 2026-10-30. Sell ratings are correct when the stock falls; Hold is tracked as a +/-10% range. Daily-close data, not intraday. Calls are tracked for 182 days from publication, then frozen as a final record.
I would put my rating as a Hold because the stock already discounts a recovery that is visible in revenue and cash flow, but not yet clean enough in earnings quality to justify a more aggressive call. Revenue reached $9.18B in Q2 2026, EBITDA rose to $1.29B, and FCF yield was 6.3% TTM, so the business is generating real cash; the offset is that net margin was still -1.13% TTM and ROE was -2.27% TTM, which tells me the recovery is not yet fully translating into shareholder earnings.
The key tension is that the operating rebound is real, but it is still sitting on top of a leveraged capital structure. I would become more constructive if net margin stays positive for two straight quarters and levered free cash flow remains above $1,228M TTM, because that would show the current earnings rebound is durable rather than just a cycle bounce. If EBITDA holds near $1.29B in the next quarter while revenue stays above $9.18B, the deleveraging case would improve materially from the current 3.3x net debt/EBITDA.
Company Profile
LyondellBasell is a global petrochemicals and plastics company that makes olefins, polyolefins, intermediates, and related products used in packaging, automotive, construction, and industrial applications. Its earnings are tied to spread economics: the company buys feedstocks, converts them through large-scale plants, and sells the output into markets where pricing and utilization move with the chemical cycle. That makes the business highly sensitive to raw-material costs, operating rates, and end-market demand, especially in Europe and North America.
Economic Moat
Business Model
The moat here is scale and integration. LyondellBasell runs a large global asset base, and that matters because integrated crackers and downstream polymer assets can capture more of the value chain than a standalone producer can. I also think the company’s broad product slate helps it absorb cycle swings better than a narrower specialty name, even though it does not eliminate commodity exposure.
That structural advantage is visible in the operating data: Q2 2026 EBITDA reached $1.29B on $9.18B of revenue, which tells me the asset base can still convert volume into cash when spreads improve. The moat is not a pricing moat, but it is a scale-and-feedstock advantage that can support cash generation through the cycle.
Business & Operating Risks
The most material disclosed risk is earnings volatility from chemical-cycle and feedstock swings. According to the risk factors in their SEC 10-K, LyondellBasell is exposed to alternating periods of capacity shortages and oversupply, declining utilization, and weaker prices and margins, while raw-material and energy costs remain a substantial part of operating expense. In plain terms, when crude oil, natural gas, or chemical demand moves against them, the company cannot always pass through higher input costs fast enough, so margins and cash flow move with the cycle.
A second risk is European concentration. A significant portion of revenue still comes from Europe, and the company has agreed to sell certain European olefins and polyolefins assets in Berre l’Etang, Münchsmünster, Carrington, and Tarragona, with closing expected in Q2 2026. That tells me management is shrinking exposure to weaker assets after the Q3 2025 impairment, which is a rational response but also a sign that the cycle has already damaged the portfolio. The risks are pressuring the moat, but they are not destroying it; they are forcing the company to prune weaker assets and rely more heavily on scale and cash discipline.
Management Discussion & Analysis
Management is responding to the cycle with capital restraint and cash preservation. The delay of Flex-2 at Channelview, while MoReTec-1 still moves ahead, says to me that the company is not forcing growth capex into a weak market. The 2026 capital budget is about $1.2B, with roughly $800M for sustaining maintenance, so the spend profile is disciplined rather than expansionary.
The cash savings plan is the other important signal. Management delivered $800M of annualized cash savings relative to the 2025 plan by year-end 2025 and now expects another $500M in 2026, for a cumulative target of $1.3B. That helps explain why the company can keep liquidity intact even after a weak year, but it also shows the priority is defense, not a near-term earnings surge. The dividend cut to $0.69 per share in February 2026 reinforces that point: management is protecting the balance sheet first, which is sensible in this cycle even if it is not friendly to income investors.
Recent Events
The most important recent event was the May 1, 2026 completion of the sale of select European olefins and polyolefins assets, plus related business and corporate functions, to AEQUITA. I view that as portfolio simplification, not just asset disposal, because it reduces exposure to lower-return European capacity and should leave the company with a cleaner operating footprint.
A second development was shareholder approval of a new share repurchase program for up to $201M of issued share capital, or 34.0 million shares, through November 23, 2026. That is supportive for capital returns, but I would not overread it while leverage remains elevated and the dividend has already been cut. The May 29, 2026 amendment to the structured accounts receivables facility extended maturity to June 25, 2027 while reducing capacity from $900M to $700M, which is a modest liquidity tightening even though no receivables purchases or letters of credit were outstanding. Taken together, the recent actions improve portfolio quality, but they do not remove the cycle risk that still sits over the business.
Financial Analysis
Growth
LYB — Financial Growth (Quarterly, USD Mil)
| Metric | 2025-03-31 | 2025-06-30 | 2025-09-30 | 2025-12-31 | 2026-03-31 | 2026-06-30 |
|---|---|---|---|---|---|---|
| REVENUE (USD Mil) | — | 7,658 | 7,727 | 7,091 | 7,197 | 9,177 |
| EBIT (USD Mil) | — | 342 | -726 | -10 | 275 | 946 |
| EBITDA (USD Mil) | — | 674 | -376 | 375 | 617 | 1,293 |
| NET INCOME (USD Mil) | — | 114 | -892 | -142 | 123 | 558 |
| DILUTED EPS | 0.5 | 0.3 | -2.8 | — | 0.4 | 1.7 |
Source: Yahoo Finance — Quarterly Financial Statements
Revenue rose from $7.09B in Q4 2025 to $7.2B in Q1 2026, then jumped to $9.18B in Q2 2026, so the business moved from flat to a sharp step-up. On a year-over-year basis, Q1 2026 revenue was up 6.0% and Q2 2026 was up 19.4%, which tells me the top line is accelerating rather than fading. EBITDA grew faster than revenue in Q2 2026, rising to $1.29B from $674M a year earlier, so operating leverage improved and the recovery is showing up in cash generation before it fully shows up in earnings quality.
Profitability
LYB — Profitability (TTM)
| Metric | TTM |
|---|---|
| Operating Margin (TTM) | 17.9% |
| Net Margin (TTM) | -1.1% |
| Return on Assets (TTM) | 4.1% |
| Return on Equity (TTM) | -2.3% |
| Gross Margin (TTM) | 12.9% |
| EBITDA Margin (TTM) | 11.4% |
Source: Yahoo Finance — Trailing Twelve Months (TTM)
TTM operating margin was 17.9%, gross margin was 12.9%, and EBITDA margin was 11.4%, so LYB is still generating healthy spread at the product level but is giving back a large share of that gross profit to overhead, impairments, and other below-gross-line items. The 5.0-point gap between gross and operating margin points to a business that is not broken at the cost-of-sales layer, but is still carrying a heavy fixed-cost and charge burden that keeps reported earnings volatile. Net margin was -1.13%, which tells me the company is still below clean GAAP profitability even though the core operating engine is positive. ROA was 4.11%, while ROE was -2.27%; that split shows returns are not being driven by durable equity profitability, and the negative ROE is a warning that accounting charges and capital intensity are still masking the underlying cash earnings power. The key watch item is net margin moving back into positive territory and staying there, because that would show the business is converting gross profit into true shareholder earnings again.
Valuation
LYB — Valuation Multiples
| Metric | Value |
|---|---|
| Current Share Price (USD) | 60.3 |
| Market Cap (USD Mil) | 19,492 |
| Enterprise Value (USD Mil) | 31,296 |
| Forward P/E | 9.7 |
| Price/Sales (TTM) | 0.6 |
| Price/Book (mrq) | 1.8 |
| EV/Revenue | 1 |
| EV/EBITDA | 8.8 |
| Beta (5Y Monthly) | 0.35 |
| FCF Yield % (TTM) | 6.3% |
| Forward EPS (USD) | 6.2 |
| Analyst Target Price – Low (USD) | 56 |
| Analyst Target Price – Mean (USD) | 67.9 |
| Analyst Target Price – High (USD) | 88 |
| # Analyst Opinions | 17 |
Source: Yahoo Finance
LyondellBasell trades at 1x EV/Revenue and 0.625x Price/Sales on a current share price of 60.3, which tells me the market is valuing the business at roughly one year of sales and paying only 0.6 cents for each dollar of trailing revenue. For a cyclical chemicals name with a weak 2025 earnings base and a recent impairment tied to the petrochemical downturn, that multiple implies investors are pricing in only modest normalization, not a clean margin rebound.
The earnings-based side is mixed. Forward P/E is 9.7x on forward EPS of 6.22, so the stock is not priced for a deep recovery, but it is also not expensive if earnings merely hold near that level. EV/EBITDA is 8.77x, which is a reasonable multiple for a business with TTM EBITDA margin of 11.4% and net debt/EBITDA of 3.3x. FCF yield is 6.3%, and that supports the valuation, while Price/Book is 1.83x against book value per share of 33.04, so buyers are paying a modest premium to accounting equity for a company still generating cash.
On my read, fair value sits around $58-$72 per share. That range sits inside the $56-$88 analyst target band, but below the $67.9 consensus mean because I weight the leverage and margin reset more heavily than the sell-side appears to. I would also frame the implied earnings power as roughly $5.8-$6.6 of EPS, which is close to the company’s own $6.2 forward EPS and broadly in line with peers on a forward-multiple basis rather than a clear discount. In other words, the stock looks fairly valued, not obviously cheap, and the market is already giving some credit for the recovery.
Leverage
LYB — Leverage & Coverage (Quarterly)
| Metric | Value |
|---|---|
| Total Debt/Equity % (mrq) | 132.8 |
| Current Ratio (mrq) | 1.6 |
| Total Debt (mrq, USD Mil) | 14,330 |
| Operating Cash Flow (TTM, USD Mil) | 2,973 |
| Levered Free Cash Flow (TTM, USD Mil) | 1,228 |
| Net Debt/EBITDA (TTM) | 3.3 |
| FCF Margin % (TTM) | 3.9% |
Source: Yahoo Finance — Quarterly Financial Statements
Total debt was $14.33B and total debt/equity was 132.8%, while the current ratio was 1.641x, so the balance sheet is levered but not strained in the near term. Operating cash flow was $2,973M TTM and levered free cash flow was $1,228M TTM, which shows EBITDA is converting to cash, but a meaningful share is still absorbed by capex and other cash uses. Net debt/EBITDA was 3.3x and FCF margin was 3.94%, both consistent with moderate refinancing risk rather than distress.
In my view, this is medium refinancing risk because the company has enough liquidity to absorb a downturn, yet the 3.3x net leverage leaves less room if petrochemical margins stay weak or if the next refinancing lands in a higher-rate market. The profile is a bear signal for financial flexibility, but not a balance-sheet stress case.
Insider Activity
The insider transaction record I see here is net selling, with 7 open-market sales totaling $27.0M versus 2 purchases totaling $469,732 over 118 parsed Form 4 filings from 2024-12-31 to 2026-05-22. The pattern is concentrated rather than broad in the open-market data, because the only recent market-price trade shown is a single 10,000-share sale by one executive, while the rest of the activity is awards and tax withholding, which are neutral. I read that as a mild bear signal because the open-market flow is seller-led, but the sample is limited and not a broad insider exodus.
Comparable Analysis
Growth
| Company | Revenue TTM (USD Mil) | Revenue Growth YoY % | Diluted EPS TTM |
|---|---|---|---|
| LYB | 31,192 | 19.8% | -0.8 |
| DOW | 41,319 | 19.7% | -1.8 |
| DD | 6,988 | 4.0% | 3.7 |
| WLK | 11,294 | 10.8% | -9.6 |
| CE | 9,712 | 8.7% | -10.6 |
| HUN | 5,898 | 14.1% | -1 |
Source: Yahoo Finance
LYB’s revenue growth of 396% TTM is in line with DOW at 19.7% and well ahead of WLK at 10.8%, CE at 8.7%, HUN at 14.1%, and DD at 4.0%, so the market is not paying LYB for a growth edge that does not exist. The problem is that this growth has not translated into earnings, since LYB’s diluted EPS is -0.8 TTM versus positive 3.7 at DD, which means LYB is getting the top-line benefit of a cyclical rebound without the profit conversion that would justify a premium multiple.
Valuation
| Company | Current Share Price (USD) | Trailing P/E | Forward P/E | EV/Revenue | EV/EBITDA | Price/Sales (TTM) | Price/Book (mrq) | Beta (5Y Monthly) | FCF Yield % (TTM) | Forward EPS | Analyst Target Price – Low | Analyst Target Price – Mean | Analyst Target Price – High | # Analyst Opinions |
|---|---|---|---|---|---|---|---|---|---|---|---|---|---|---|
| LYB | 60.3 | — | 9.7 | 1 | 8.8 | 0.6 | 1.8 | 0.35 | 6.3% | 6.2 | 56 | 67.9 | 88 | 17 |
| DOW | 28.6 | — | 16.6 | 0.9 | 9.4 | 0.5 | 1.3 | 0.41 | 1.1% | 1.7 | 29 | 33.6 | 41 | 16 |
| DD | 132.5 | 35.6 | 16.6 | 2.8 | 12.3 | 2.6 | 1.3 | 1.08 | 10.3% | 8 | 153 | 168.8 | 186 | 16 |
| WLK | 62.3 | — | 21 | 1.1 | 11.1 | 0.7 | 0.9 | 0.69 | 0.3% | 3 | 67 | 85.6 | 114 | 16 |
| CE | 44.8 | — | 7.3 | 1.7 | 9.8 | 0.5 | 1.2 | 0.76 | 19.3% | 6.1 | 45 | 63.2 | 86 | 17 |
| HUN | 8.5 | — | 35.3 | 0.7 | 13.8 | 0.3 | 0.5 | 0.81 | 10.4% | 0.2 | 9 | 10.6 | 14 | 13 |
Source: Yahoo Finance
LYB’s 6.3% FCF yield is better than DOW’s 1.1%, WLK’s 0.3%, and HUN’s 10.4%? No — the more relevant read is that LYB sits in the middle of the group, below DD’s 10.3% and CE’s 19.3% but well above DOW’s 1.1% and WLK’s 0.3%. On the multiple side, LYB’s 9.7x forward P/E and 8.8x EV/EBITDA are below WLK’s 21.0x and HUN’s 35.3x, but above CE’s 7.3x forward P/E and 9.8x EV/EBITDA, which tells me the market is paying for a cleaner earnings path than LYB has fully earned. A $1 invested a year ago would be worth $1.32 in LYB versus $1.33 in DOW and $1.37 in DD, so LYB has kept pace with the better-performing chemical names but has not separated from them; that is consistent with a fair-value call rather than a cheap-stock call.
Profitability
| Company | Operating Margin (TTM) | Net Margin (TTM) | Return on Assets (TTM) | Return on Equity (TTM) | Gross Margin (TTM) | EBITDA Margin (TTM) |
|---|---|---|---|---|---|---|
| LYB | 17.9% | -1.1% | 4.1% | -2.3% | 12.9% | 11.4% |
| DOW | 11.6% | -3.1% | 1.3% | -5.5% | 9.8% | 9.6% |
| DD | 14.2% | 0.8% | 2.1% | 1.8% | 35.1% | 22.7% |
| WLK | 11.2% | -10.9% | 0.4% | -11.9% | 10.2% | 10.0% |
| CE | 11.0% | -12.0% | 2.6% | -22.2% | 21.4% | 17.3% |
| HUN | 1.7% | -3.1% | -0.0% | -3.8% | 13.5% | 4.8% |
Source: Yahoo Finance
LYB’s 17.9% operating margin is above DOW’s 11.6%, WLK’s 11.2%, CE’s 11.0%, HUN’s 1.7%, and DD’s 14.2%, which says the core business still earns better operating spread than most peers. Yet LYB’s 12.9% gross margin is lower than DD’s 35.1% and CE’s 21.4%, so the gap looks more like cost-of-revenue pressure than a pure opex problem, and that is why the market should not assume operating leverage will expand cleanly from here.
Leverage
| Company | Total Debt/Equity % (mrq) | Current Ratio (mrq) | Total Debt (mrq, USD Mil) | Net Debt/EBITDA (TTM) | FCF Margin % (TTM) |
|---|---|---|---|---|---|
| LYB | 132.8 | 1.6 | 14,330 | 3.3 | 3.9% |
| DOW | 111.9 | 1.7 | 19,436 | 3.8 | 0.6% |
| DD | 22.9 | 2.4 | 3,179 | 0.9 | 26.3% |
| WLK | 63.8 | 2.5 | 5,876 | 3.6 | 0.2% |
| CE | 270.2 | 1.4 | 12,397 | 6.6 | 9.8% |
| HUN | 85.4 | 1.3 | 2,501 | 7.7 | 2.6% |
Source: Yahoo Finance
LYB’s 132.8% debt/equity and 3.3x net debt/EBITDA are heavier than DD’s 22.9% and 0.9x, and also above DOW’s 111.9% and 3.8x, which means LYB is not the cleanest balance sheet in the group. Still, LYB’s 3.9% FCF margin is better than DOW’s 0.6%, WLK’s 0.2%, and HUN’s 2.6%, so the leverage is a financing choice backed by cash generation rather than a distress signal, although it leaves less room for error than DD’s much stronger 26.3% FCF margin.
Conclusion
I would put my rating as a Hold because the recovery is visible in revenue and EBITDA, but the earnings quality and leverage profile are not yet strong enough to justify a more aggressive call. Q2 2026 revenue rose 19.4% year over year to $9.18B and EBITDA reached $1.29B, so the operating rebound is real; the offset is that net margin was still -1.13% TTM and ROE was -2.27% TTM, which tells me the recovery is not yet fully translating into shareholder earnings.
The bull case is straightforward: if net margin stays positive for two consecutive quarters and levered free cash flow remains above $1,228M TTM, I would move more toward a Buy because that would show the current earnings rebound is durable rather than just a cycle bounce. If EBITDA holds near $1.29B in the next quarter while revenue stays above $9.18B, the deleveraging case would improve materially from the current 3.3x net debt/EBITDA, and that would make the equity easier to own.
The bear case is just as clear. I would move from Hold toward Sell if quarterly revenue falls back below $8B or if EBITDA drops under $900M, because either outcome would show the Q2 step-up was not a new base. I would also turn more cautious if FCF margin slips below 3.0%, since that would mean the company is no longer converting sales into enough cash to support its 7.0% dividend and capital program without leaning harder on the balance sheet.
Weighing both paths, I still lean to the middle because the bull case needs steady execution while the bear case needs only a clear reversal in the recent operating improvement. The market has already given LYB credit for a recovery, and I do not yet see enough evidence to say that credit is either fully earned or clearly wrong.
What to Watch Next
- Net margin staying positive for two straight quarters — would support a move toward Buy.
- Quarterly EBITDA holding near $1.29B — would strengthen the deleveraging case.
- Revenue staying above $9.18B — would confirm the Q2 step-up is a new base.
- FCF margin staying above 3.94% — would support the dividend and capex plan.
- Net debt/EBITDA moving below 3.3x — would improve balance-sheet flexibility.
What’s your take? I rated LyondellBasell (LYB) HOLD above — but the goal here is to get this right, not just to publish an opinion. What would you add to this analysis, or which risk or catalyst do you think I’m under- or over-weighting? Tell me in the comments.
Sources
- SEC 10-K Annual Report — filed 2026-02-20
- SEC 8-K Filing (2026-05-29)
- SEC 8-K Filing (2026-05-22)
- SEC 8-K Filing (2026-05-01)
- SEC 8-K Filing (2026-01-30)
- SEC Form 4 Insider Transaction (2026-06-01)
- SEC Form 4 Insider Transaction (2026-06-01)
- SEC Form 4 Insider Transaction (2026-05-26)
Data sourced from Yahoo Finance and SEC EDGAR. Not investment advice.
Leave a Comment