
| Company | Aug 25 | Sep 25 | Oct 25 | Nov 25 | Dec 25 | Jan 26 | Feb 26 | Mar 26 | Apr 26 | May 26 | Jun 26 | Jul 26 | 12-Mo |
|---|---|---|---|---|---|---|---|---|---|---|---|---|---|
| UPBD | +23% | -5% | -18% | -8% | +0% | +8% | +13% | -16% | +12% | -3% | +13% | -9% | +2% |
| BBBY | +1% | +9% | -21% | -22% | -9% | +8% | -10% | -13% | +6% | +25% | -6% | -13% | -44% |
| WSM | +1% | +4% | -0% | -7% | -1% | +15% | +0% | -11% | -0% | +12% | +15% | -2% | +24% |
| HVT | +11% | -3% | -1% | +11% | -2% | +8% | -6% | -10% | +5% | +5% | +12% | -3% | +26% |
| FNKO | -10% | -1% | -9% | +1% | +8% | +19% | +23% | -37% | +40% | +29% | +4% | -1% | +52% |
| W | +14% | +20% | +16% | +7% | -9% | +3% | -26% | -1% | -15% | +13% | +28% | -8% | +29% |
Source: Yahoo Finance monthly adjusted close.
Quick Thesis
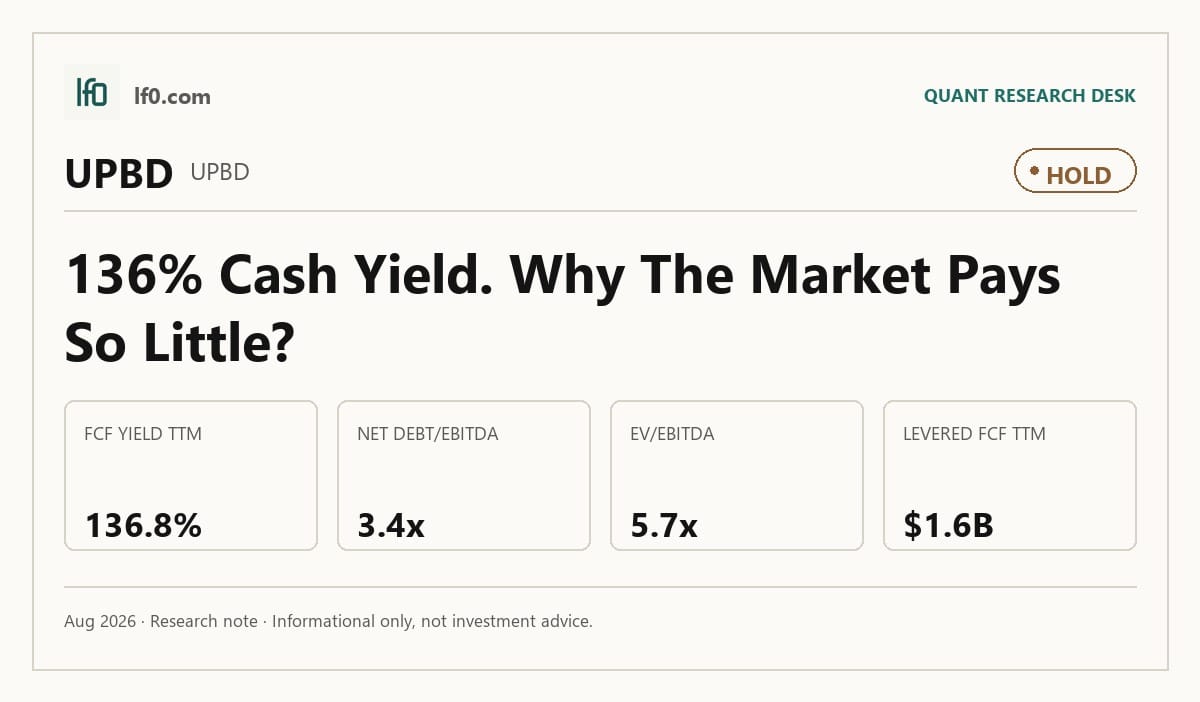
- Rated hold — cash flow is strong, but revenue has stalled.
- TTM levered free cash flow is $1.6B, supporting the balance sheet.
- Total debt is $1.7B and net debt/EBITDA is 3.4x.
- The stock looks cheap at 5.7x EV/EBITDA and 0.6x EV/revenue.
- I would turn more constructive if revenue reaccelerates and margin expands.
Executive Summary
Rating: HOLD | UPBD
Measured from adjusted close on 2026-08-13 to 2026-09-25. Sell ratings are correct when the stock falls; Hold is tracked as a +/-10% range. Daily-close data, not intraday. Calls are tracked for 182 days from publication, then frozen as a final record.
I would put my rating as a Hold because Upbound Group is generating real cash, but the latest quarter did not show enough evidence that Brigit is lifting the growth rate in a durable way. The business still produced $425.5M of operating cash flow TTM and $1.6B of levered free cash flow TTM, yet Q2 2026 revenue slipped to $1.163B from $1.220B in Q1 2026 and diluted EPS fell to $0.37 from $0.61.
In my view, the key tension is that the market is paying for cash conversion, not for a clean growth reacceleration. I would move more toward a Buy if revenue gets back above $1.2B in a quarter, meaning the top line is again running above the recent plateau, and if operating margin moves toward 8.0%, which would show the cost base is scaling better.
Company Profile
Upbound Group, Inc. provides lease-to-own financing for durable goods through Acima, Rent-A-Center, and Mexico, and it also offers financial wellness products through Brigit. Acima serves customers through third-party retailers and online channels, while Rent-A-Center operates company-owned stores, franchise stores, and e-commerce sites that lease furniture, appliances, electronics, tools, and related products.
The company was incorporated in Delaware in 1986, acquired Acima Holdings, LLC in February 2021, and completed the acquisition of Brigit, a financial health technology company, on January 31, 2025. It is headquartered in Plano, Texas and operates in the United States, Puerto Rico, and Mexico, with substantially all revenue coming from the United States over the last 3 years. As of December 31, 2025, it employed 12,050 coworkers and is listed on Nasdaq under UPBD.
Economic Moat
Business Model
The most defensible part of Upbound Group’s model is the combination of Acima’s retailer network and Rent-A-Center’s owned and franchised footprint. In my view, that distribution mix is hard to copy quickly because it depends on retailer relationships, underwriting data, and operating know-how built over time, not just on capital.
Brigit adds a second layer of differentiation through its mobile and web-based financial health tools, including Instant Cash, Credit Builder, and Identity Theft Protection. I see that as a newer moat than the lease-to-own franchise, but it broadens the company beyond a single product set and gives management more ways to reach underserved consumers.
Business & Operating Risks
The main disclosed risk is macro pressure on the customer base, because demand and repayment behavior are tied to employment, disposable income, interest rates, inflation, tariffs, and tax refunds. The lease-to-own businesses saw weaker customer behavior after stimulus faded and inflation rose, which forced tighter underwriting and reduced active leases and lease revenue.
Supply chain disruption is the next risk because merchandise shortages or vendor demands for standby letters of credit, advance payment, or other assurances can hit sales and liquidity at the same time. Brigit adds a separate regulatory layer, including FTC settlement obligations and repayment risk on earned wage access advances, while legal and compliance exposure remains material across the group.
Taken together, these risks do not break the moat, but they do test whether the retailer network and underwriting edge can keep converting into cash when the consumer backdrop weakens.
Management Discussion & Analysis
Management is actively responding to those risks, but not eliminating them. The Brigit acquisition, the term loan amendment that pushed maturity to August 19, 2032, and the continued dividend all show a willingness to use cash flow to support growth and preserve flexibility, even as the company carries leverage.
The operating mix is still uneven. Acima posted growth, but Rent-A-Center’s same-store sales declined 2.2%, so the digital and financial-wellness additions have not yet offset softness in the legacy store base. That matters because the moat only becomes more valuable if the newer channels improve earnings quality rather than simply adding complexity.
Recent Events
The most important recent event was stockholder approval of the 2026 Long-Term Incentive Plan, which authorizes up to 4.6 million shares and cancels the remaining shares under the 2021 plan. I read that as a retention tool, but it also adds dilution risk, so it is a test of per-share value rather than a clean positive.
Bryan Pechersky’s resignation as Executive Vice President, General Counsel and Corporate Secretary is not a governance red flag on its face, since the company said it was not tied to a disagreement over operations or policy. Even so, it removes a senior legal voice while the company is still integrating Brigit and managing a more complex regulatory profile.
Financial Analysis
Growth
UPBD — Financial Growth (Quarterly, USD Mil)
| Metric | 2025-03-31 | 2025-06-30 | 2025-09-30 | 2025-12-31 | 2026-03-31 | 2026-06-30 |
|---|---|---|---|---|---|---|
| REVENUE (USD Mil) | — | 1,157.5 | 1,164.7 | 1,196.4 | 1,219.7 | 1,163.4 |
| EBIT (USD Mil) | — | 51.4 | 48.5 | 57.9 | 78.2 | 54.8 |
| EBITDA (USD Mil) | — | 428.2 | 431.4 | 443.6 | 456.9 | 425.7 |
| NET INCOME (USD Mil) | — | 15.5 | 13.2 | 19.7 | 35.8 | 21.6 |
| DILUTED EPS | 0.4 | 0.3 | 0.2 | — | 0.6 | 0.4 |
Source: Yahoo Finance — Quarterly Financial Statements
Revenue rose from $1.158B in Q2 2025 to $1.196B in Q4 2025 and then to $1.220B in Q1 2026, before easing to $1.163B in Q2 2026. That pattern looks more like a plateau than a sharp break, which is why I do not want to overstate the slowdown even though the latest quarter was softer.
EBITDA held in a fairly tight band, from $428M in Q2 2025 to $457M in Q1 2026 and $426M in Q2 2026, while diluted EPS moved from $0.26 to $0.61 and then $0.37. The key point is that earnings are still positive, but the company has not yet shown me a sustained step-up in the top line that would justify a faster rerating.
Profitability
UPBD — Profitability (TTM)
| Metric | TTM |
|---|---|
| Operating Margin (TTM) | 6.0% |
| Net Margin (TTM) | 1.9% |
| Return on Assets (TTM) | 6.8% |
| Return on Equity (TTM) | 12.7% |
| Gross Margin (TTM) | 49.1% |
| EBITDA Margin (TTM) | 10.1% |
Source: Yahoo Finance — Trailing Twelve Months (TTM)
TTM operating margin was 6.0%, gross margin was 49.1%, and EBITDA margin was 10.1%, so the business still keeps a meaningful share of revenue after direct costs. The gap between gross margin and operating margin shows that overhead, credit costs, and acquisition-related expense are still absorbing a lot of the gross profit.
Net margin was 1.9% TTM, which leaves little room for error if revenue stalls. Return on assets of 6.8% and return on equity of 12.7% are acceptable, but they do not yet tell me that the business has reached a higher-quality earnings profile; leverage is still doing part of the work.
Valuation
UPBD — Valuation Multiples
| Metric | Value |
|---|---|
| Market Cap (USD Mil) | 1,147 |
| Enterprise Value (USD Mil) | 2,713 |
| Trailing P/E | 12.8 |
| Forward P/E | 4.3 |
| Price/Sales (TTM) | 0.2 |
| Price/Book (mrq) | 1.6 |
| EV/Revenue | 0.6 |
| EV/EBITDA | 5.7 |
| Beta (5Y Monthly) | 1.78 |
| FCF Yield % (TTM) | 136.8% |
| Forward EPS (USD) | 4.6 |
| Analyst Target Price – Low (USD) | 20 |
| Analyst Target Price – Mean (USD) | 28.2 |
| Analyst Target Price – High (USD) | 41 |
| # Analyst Opinions | 6 |
Source: Yahoo Finance
FCF Yield was 136.8% TTM, which is the clearest valuation anchor here and explains why the stock screens as cheap on cash generation. EV/Revenue was 0.6x, EV/EBITDA was 5.7x, trailing P/E was 12.8x, and forward P/E was 4.3x, so the market is already discounting a sharp step-up in earnings to the $4.6 Forward EPS figure.
On my read, fair value sits in a range of about $20–$41 per share, which is broadly aligned with the analyst target range of $20–$41 from 6 opinions. That range is not demanding for a business with $1.6B of levered free cash flow TTM, but I would still weight the plateau in revenue more heavily than the consensus appears to, which is why I do not push the valuation case beyond the current Hold.
The implied earnings power also looks better than the headline sales growth suggests. Forward EPS of $4.6 is rich relative to HVT’s $2.6 and FNKO’s $0.2, yet UPBD still trades at a much lower EV/EBITDA multiple than WSM’s 18.0x and HVT’s 11.2x, so the market is not paying up for growth the way it does for the stronger peer set.
Price/book was 1.6x, backed by book value per share of $12.6, and beta was 1.8x, which tells me the stock can move sharply when sentiment shifts. That volatility matters because the valuation is cheap enough to attract buyers, but not so cheap that it can ignore another weak quarter.
Leverage
UPBD — Leverage & Coverage (Quarterly)
| Metric | Value |
|---|---|
| Total Debt/Equity % (mrq) | 232.9 |
| Current Ratio (mrq) | 3.1 |
| Total Debt (mrq, USD Mil) | 1,708.2 |
| Operating Cash Flow (TTM, USD Mil) | 425.5 |
| Levered Free Cash Flow (TTM, USD Mil) | 1,568.2 |
| Net Debt/EBITDA (TTM) | 3.4 |
| FCF Margin % (TTM) | 33.1% |
Source: Yahoo Finance — Quarterly Financial Statements
Total debt was $1.7B mrq and total debt/equity was 232.9%, which is a levered capital structure for a retailer and finance hybrid. Net debt/EBITDA was 3.4x TTM, a level that is manageable only if cash generation stays firm.
The offset is liquidity and cash conversion. Current ratio was 3.1x mrq, operating cash flow was $425.5M, and levered free cash flow was $1.6B TTM, so the company has enough cash generation to service debt and fund integration without immediate balance-sheet stress.
That combination is why I do not see leverage as a thesis breaker today. It is a constraint, though, and if margin expansion does not follow the Brigit acquisition, the debt load will keep capping how far the equity can rerate.
Insider Activity
The insider record I see is one-sided buying: 8 open-market purchases and 0 open-market sales in the 2025-01-07 to 2026-04-28 window, across 73 Form 4 filings. Jeffrey J. Brown accounted for the most recent open-market activity, which is supportive for alignment, but I would not overread a limited sample of trades as a full thesis signal.
Comparable Analysis
Growth
| Company | Revenue TTM (USD Mil) | Revenue Growth YoY % | EBITDA TTM (USD Mil) | Diluted EPS TTM |
|---|---|---|---|---|
| UPBD | 4,744.3 | 0.5% | 477.6 | 1.5 |
| BBBY | — | — | — | — |
| WSM | 7,882.2 | 4.4% | 1,649.8 | 8.9 |
| HVT | 780.4 | 7.7% | 50.8 | 1.4 |
| FNKO | 932.6 | 7.4% | 84.8 | 0 |
| W | 12,904 | 7.5% | 354 | -2.5 |
Source: Yahoo Finance
UPBD’s revenue growth was 0.5% TTM, well below WSM at 4.4%, HVT at 7.7%, FNKO at 7.4%, and W at 7.5%. That is the clearest reason I do not assign a growth premium here, even though UPBD’s EBITDA TTM of $477.6M is still meaningful in absolute terms.
Valuation
| Company | Trailing P/E | Forward P/E | EV/Revenue | EV/EBITDA | Price/Sales (TTM) | Price/Book (mrq) | Market Cap (USD Mil) | Enterprise Value (USD Mil) | Beta (5Y Monthly) | FCF Yield % (TTM) | Forward EPS | Analyst Target Price – Low | Analyst Target Price – Mean | Analyst Target Price – High | # Analyst Opinions |
|---|---|---|---|---|---|---|---|---|---|---|---|---|---|---|---|
| UPBD | 12.8 | 4.3 | 0.6 | 5.7 | 0.2 | 1.6 | 1,147 | 2,713 | 1.78 | 136.8% | 4.6 | 20 | 28.2 | 41 | 6 |
| BBBY | — | -55.8 | — | — | — | 1.7 | 422 | — | — | — | — | 6 | 10.2 | 17 | 4 |
| WSM | 27.2 | 23.6 | 3.8 | 18 | 3.6 | 15.3 | 28,561 | 29,708 | 1.47 | 3.1% | 10.3 | 138 | 219.4 | 280 | 20 |
| HVT | 20.9 | 10.9 | 0.7 | 11.2 | 0.6 | 1.5 | 464 | 568 | 1.18 | 7.6% | 2.6 | 30 | 33 | 36 | 2 |
| FNKO | — | 26 | 0.6 | 6.5 | 0.4 | 1.8 | 335 | 552 | 0.93 | 19.4% | 0.2 | 6.8 | 7.4 | 8 | 2 |
| W | — | 26.2 | 1.3 | 46.5 | 1.1 | -4.7 | 13,319 | 16,472 | 2.98 | 3.5% | 3.9 | 80 | 120.9 | 156 | 28 |
Source: Yahoo Finance
UPBD trades at 0.6x EV/revenue and 5.7x EV/EBITDA, versus WSM at 3.8x and 18.0x, HVT at 0.7x and 11.2x, FNKO at 0.6x and 6.5x, and W at 1.3x and 46.5x. On a peer basis, the stock is cheap, but the discount is partly explained by slower growth and a more levered balance sheet, so I do not think the market is mispricing it by a wide margin.
The $1 invested comparison reinforces that point. A dollar invested a year ago would be worth $0.91 in UPBD, versus $1.20 in WSM, $1.35 in HVT, $1.52 in FNKO, and $1.38 in W, which tells me the market has rewarded the faster growers and punished the slower one. I think UPBD’s multiple is more attractive than its return profile alone would suggest, but not enough to call it a clear outperformer.
Profitability
| Company | Operating Margin (TTM) | Net Margin (TTM) | Return on Assets (TTM) | Return on Equity (TTM) | Gross Margin (TTM) | EBITDA Margin (TTM) |
|---|---|---|---|---|---|---|
| UPBD | 6.0% | 1.9% | 6.8% | 12.7% | 49.1% | 10.1% |
| BBBY | — | — | — | — | — | — |
| WSM | 16.2% | 13.8% | 17.4% | 54.0% | 46.1% | 20.9% |
| HVT | 3.4% | 2.9% | 2.5% | 7.6% | 60.9% | 6.5% |
| FNKO | 10.7% | -0.2% | 2.3% | -1.0% | 44.9% | 9.1% |
| W | 3.0% | -2.5% | 5.3% | — | 30.3% | 2.7% |
Source: Yahoo Finance
UPBD’s gross margin of 49.1% is above WSM’s 46.1% and FNKO’s 44.9%, but below HVT’s 60.9%. Operating margin of 6.0% and EBITDA margin of 10.1% sit below WSM’s 16.2% and 20.9%, which means UPBD is not converting gross profit into operating profit as efficiently as the best peer.
Return on equity of 12.7% and return on assets of 6.8% are respectable, but WSM’s 54.0% ROE and 17.4% ROA show a much stronger business model. In other words, UPBD’s profitability is good enough to support the stock, but not strong enough to justify a premium multiple.
Leverage
| Company | Total Debt/Equity % (mrq) | Current Ratio (mrq) | Total Debt (mrq, USD Mil) | Operating Cash Flow TTM (USD Mil) | Free Cash Flow TTM (USD Mil) | Net Debt/EBITDA (TTM) | FCF Margin % (TTM) |
|---|---|---|---|---|---|---|---|
| UPBD | 232.9 | 3.1 | 1,708.2 | 425.4 | 1,568.2 | 3.4 | 33.1% |
| BBBY | — | — | — | — | — | — | — |
| WSM | 79.9 | 1.3 | 1,493.6 | 1,352.3 | 885.5 | 0.5 | 11.2% |
| HVT | 78.5 | 1.7 | 230.7 | 60.6 | 35.2 | 2.5 | 4.5% |
| FNKO | 139 | 1.2 | 261.4 | 63 | 65.1 | 2.6 | 7.0% |
| W | — | 0.7 | 3,516 | 665 | 471.6 | 6.7 | 3.6% |
Source: Yahoo Finance
UPBD’s total debt/equity of 232.9% is well above WSM’s 79.9% and HVT’s 78.5%, while net debt/EBITDA of 3.4x is above HVT’s 2.5x and FNKO’s 2.6x but below W’s 6.7x. The leverage profile is therefore not distressed, yet it is heavy enough that the equity depends on cash generation staying strong.
That is where the comparison becomes more interesting: UPBD’s FCF margin of 33.1% is far above WSM’s 11.2%, HVT’s 4.5%, FNKO’s 7.0%, and W’s 3.6%, so the balance-sheet load is being supported by unusually strong cash conversion. I feel that is why the stock can trade at a low EV/EBITDA multiple without looking broken, even though the debt load itself is still a real constraint.
Conclusion
I would put my rating as a Hold because the cash flow is already strong enough to support the balance sheet, but the revenue trend has not yet proven to me that Brigit is changing the growth profile. The tension is simple: UPBD can fund itself, yet it still needs a cleaner top-line reacceleration before I would pay up for the equity.
I would raise my rating more toward a Buy if quarterly revenue moves back above $1.2B and operating margin improves toward 8.0%, because that would show the business is converting the acquisition mix into better earnings quality rather than just more complexity. If that happens while net debt/EBITDA stays near 3.4x or improves, meaning leverage is not rising faster than cash generation, the stock would deserve a higher multiple.
The bear case is the opposite: if revenue stays near the recent plateau and diluted EPS cannot hold the $0.61 level reached in Q1 2026, then the market will keep treating UPBD as a leveraged cash generator rather than a compounding platform. In that scenario, the current valuation would look fair rather than cheap, because the cash flow would be doing the heavy lifting while growth remains muted.
I lean Hold because the numbers already show enough cash strength to avoid a bearish call, but not enough operating momentum to justify moving up the rating. What I want to see next is a quarter of revenue back above $1.2B and a clearer margin lift; until then, I think skepticism in the price is still warranted.
What to Watch Next
- Quarterly revenue above $1.2B — would support a move toward Buy.
- Operating margin near 8.0% — would show better earnings conversion.
- Net debt/EBITDA staying near 3.4x or lower — would keep leverage manageable.
- Diluted EPS holding above $0.61 in a quarter — would confirm earnings momentum.
- FCF Yield staying near current levels — would keep the valuation case intact.
What’s your take? I rated Upbound Group (UPBD) HOLD above — but the goal here is to get this right, not just to publish an opinion. What would you add to this analysis, or which risk or catalyst do you think I’m under- or over-weighting? Tell me in the comments.
Sources
- SEC 10-K Annual Report — filed 2026-02-23
- SEC 8-K Filing (2026-06-03)
- SEC 8-K Filing (2026-05-19)
- SEC 8-K Filing (2026-04-30)
- SEC 8-K Filing (2026-02-19)
- SEC Form 4 Insider Transaction (2026-04-30)
- SEC Form 4 Insider Transaction (2026-04-30)
- SEC Form 4 Insider Transaction (2026-04-30)
- SEC 10-K Annual Report — FY2026
- SEC 10-K Annual Report — FY2025
- SEC 10-K Annual Report — FY2024
- SEC 10-K Annual Report — FY2023
- SEC 10-K Annual Report — FY2022
Data sourced from Yahoo Finance and SEC EDGAR. Not investment advice.
Leave a Comment