Expected price range
Each range is set from the stock’s recent price history and our Hold rating, using its own 1-year realised volatility (53% annualised) as the width of a ~68% statistical band, and checked against that rating so the range leans the same way as our view. Starting price $82.89 (close 2026-11-20). The stock traded between $82.89 and $177 over the last 6 months and between $82.89 and $216 over the last year. This is an illustration of where our view and normal volatility point, not a forecast, price target or investment advice; the stock can move outside it.
| Company | Nov 25 | Dec 25 | Jan 26 | Feb 26 | Mar 26 | Apr 26 | May 26 | Jun 26 | Jul 26 | Aug 26 | Sep 26 | Oct 26 | 12-Mo |
|---|---|---|---|---|---|---|---|---|---|---|---|---|---|
| ALB | +32% | +9% | +21% | +5% | +1% | +10% | -10% | -23% | -13% | +15% | -21% | -14% | -6% |
| LYB | +6% | -9% | +13% | +17% | +42% | -7% | -11% | -20% | +18% | +6% | -12% | +19% | +57% |
| SQM | +31% | +7% | +12% | -1% | +6% | +14% | -6% | -14% | -9% | +18% | -16% | -16% | +15% |
| LAC | +2% | -23% | +12% | +4% | -22% | +45% | -9% | -26% | -25% | +8% | -15% | -23% | -63% |
| SGML | +74% | +17% | -18% | +34% | -14% | +79% | -24% | -25% | -22% | +28% | -26% | -26% | +8% |
| ICL | -14% | +2% | -6% | -10% | +9% | +6% | +21% | -24% | +2% | +13% | -11% | -9% | -28% |
Source: Yahoo Finance monthly adjusted close.
Quick Thesis
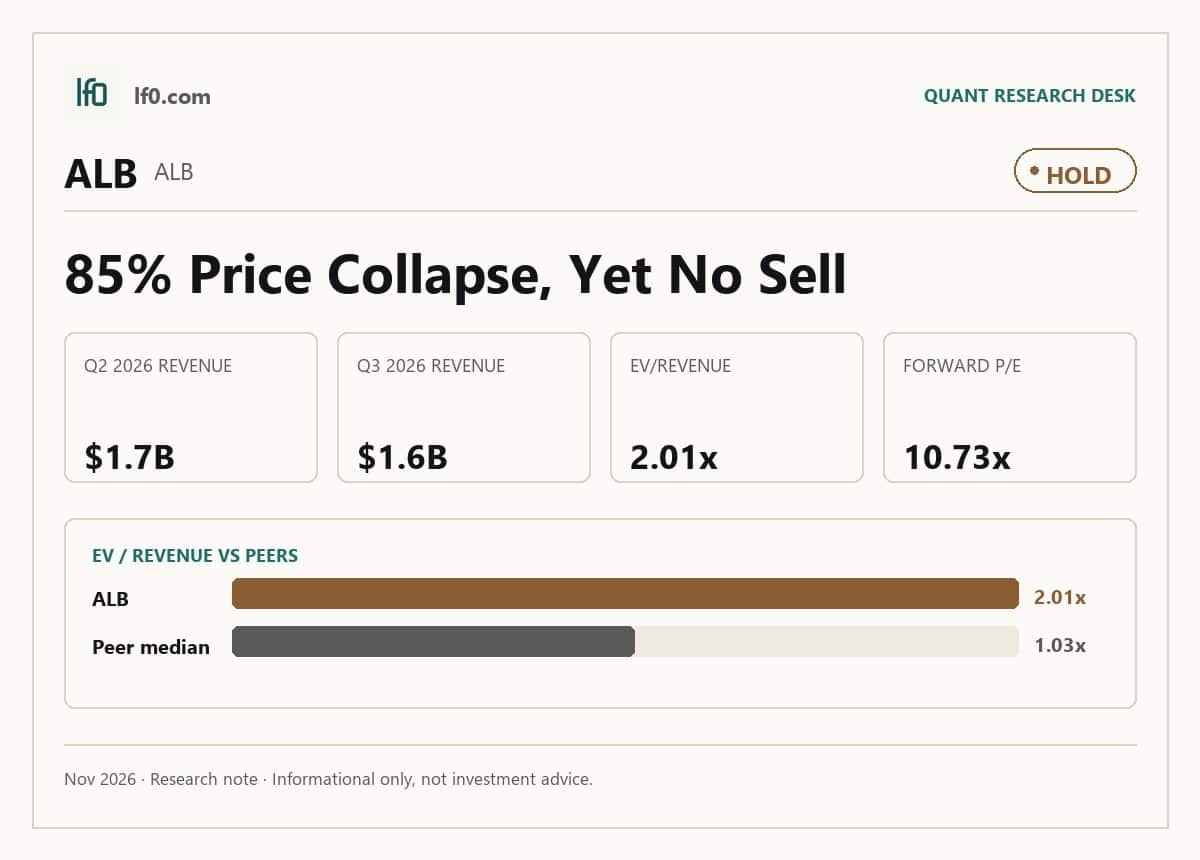
- Rated Hold — lithium recovery is real, but not yet durable enough for a Buy.
- Strongest support: $1.3B of levered free cash flow TTM and 2.34x current ratio.
- Biggest risk: lithium prices fell 85% to 95% from the January 2023 peak through 2025.
- Valuation is fair to slightly rich at 9.3x EV/EBITDA and 10.7x forward P/E.
- I would move toward Buy if Energy Storage holds revenue above $1.5B and EBITDA near $628.4M.
Executive Summary
We’ll begin tracking this call’s performance since publication once sufficient adjusted-close data is available.
I would put my rating as a Hold because Albemarle has a real lithium franchise and a cleaner balance sheet than many peers, but the earnings base is still too dependent on a lithium price recovery that has not yet fully shown up in the numbers. TTM revenue of $6.2B and operating margin of 17.1% show the business is profitable, yet the stock already trades at 10.7x forward earnings and 9.3x EV/EBITDA, so investors are paying for a rebound that still needs confirmation.
I would raise my rating more toward a Buy if Energy Storage can hold revenue above $1.5B in the next quarter and keep adjusted EBITDA near the $628.4M level reached in Q2 2026, because that would show the pricing recovery is sticking rather than fading after one strong quarter. If that run rate holds, annualized EBITDA would be roughly $2.5B, which would make the current multiple look much less demanding and would support a materially higher equity value without needing a heroic rerating.
Company Profile
Albemarle Corporation is a global producer of lithium compounds, bromine specialties, and catalyst materials that feed grid storage, electric vehicles, electronics, pharmaceuticals, and refining. It is headquartered in Charlotte, North Carolina, and listed on the New York Stock Exchange under ALB.
The company operates more than 25 production and research and development facilities across the Americas, Asia Pacific, Europe, and the Middle East, and as of December 31, 2025 it served about 1,900 customers in roughly 70 countries. Its portfolio is organized into Energy Storage, Specialties, and Ketjen, and it is reshaping that mix through the planned sale of Ketjen’s Refining Solutions business and the completed January 2026 sale of its 50% stake in Eurecat S.A., a catalyst joint venture.
Economic Moat
Business Model
The most defensible part of Albemarle’s model is its access to scarce, qualified lithium supply paired with process chemistry that lets it deliver consistent product quality at scale. In my view, a well-funded competitor cannot replicate that combination within 3 years because the company sources lithium through long-lived positions at Greenbushes, Wodgina, the Salar de Atacama, Silver Peak, Kings Mountain, and Antofalla, while also backing those resources with more than 1,500 active patents and more than 750 pending patent applications as of December 31, 2025.
That matters because lithium customers in batteries and specialty applications do not just buy tonnage; they buy reliability, specification control, and continuity of supply. Albemarle can therefore compete on product quality, product diversity, reliability of supply, and customer service rather than only on price. The secondary moat is its global operating footprint, with more than 25 production and research and development facilities and about 1,900 customers in about 70 countries, which makes it harder for a new entrant to match service coverage and application support quickly.
Business & Operating Risks
The most material disclosed risk is lithium price collapse and the knock-on effect on Albemarle’s cash generation, because the filing says lithium prices decreased by about 85% to 95% from their January 2023 high through 2025 and that a further decline could force additional inventory valuation charges and hurt revenue and profitability. That is not hypothetical in the financial data already in this article: the company has already taken care and maintenance actions at Kemerton and Chengdu, and those moves were tied directly to depressed lithium prices.
A second risk is execution on the capital structure and project base. The filing says required capital expenditures can be complex, costs may exceed estimates, and development projects may require more capital than anticipated while still failing to prove economically viable. That language is especially relevant now because Albemarle halted construction of Kemerton Trains 3 and 4, placed Kemerton Train 2 and the Chengdu conversion plant into care and maintenance, and then announced Kemerton Train 1 for care and maintenance in February 2026.
The third risk is concentration in China and foreign operating exposure. The filing quantifies 39% of total net sales shipped to or within China in 2025 and notes three active production facilities there, while also pointing to tariffs on Chinese electric vehicles and lithium-ion batteries, possible further trade restrictions, and Chinese government curtailments of manufacturing or energy quotas. In my view, that is a live earnings risk rather than a generic overseas disclosure.
Taken together, these risks do threaten the moat, but they threaten the economics of lithium conversion and asset utilization more than the underlying chemistry and supply-position advantage itself.
Management Discussion & Analysis
Management is signaling a capital-allocation reset around the Refining Solutions exit, and that is the clearest response to the risks above. The company signed a definitive agreement on October 25, 2025 to divest the controlling ownership interest in that business, expects to receive about $536 million in cash, and says the proceeds will go to debt reduction and other general corporate purposes. That is a clear balance-sheet priority, but it also tells investors not to treat the transaction as a growth reinvestment.
The same pattern shows up in operations. Management cut capital expenditures to $589.8 million in 2025 from $1.7B in 2024 and now expects $550M to $600M in 2026, which signals a more defensive posture and a lower capital-intensity model rather than an aggressive expansion cycle. The company also says it has achieved its $400M per year cost and productivity improvement target, and the 2025 numbers partly support that claim because SG&A fell to $550M from $618M while adjusted EBITDA held at $1.1B even as net sales fell 4.0%.
I think the most important read-through is that management is trying to protect cash and simplify the portfolio while the lithium cycle remains weak. That is the right response to the disclosed risks, but it also means the equity case still depends on pricing recovery rather than on a self-funding growth engine.
Recent Events
The most significant development is the March 19, 2026 third amendment to the 2022 Credit Agreement, which pushes maturity to at least October 28, 2028 and trims the SOFR spread adjustment. That extends liquidity runway and lowers financing friction, so it supports the balance-sheet repair angle rather than forcing near-term refinancing risk.
On May 5, 2026, shareholders approved the Albemarle Corporation 2026 Incentive Plan, replacing the 2017 plan, and also approved the shareholder proposal allowing special meetings. In my view, the new plan is neutral to slightly positive because it preserves equity-based retention, while the special-meeting vote increases governance pressure on management and can sharpen capital allocation discipline.
The same meeting also rejected the charter amendment that would have removed supermajority provisions tied to affiliated transactions, which leaves existing control protections in place. That is a modest negative for governance flexibility, but it does not change the operating thesis on its own. Separately, on April 13 and June 1, 2026, Chief Accounting Officer Donald J. LaBauve Jr. retired and Neal R. Sheorey was named interim Principal Accounting Officer, which looks like orderly backfilling rather than a disruption in financial reporting.
Financial Analysis
LF0 has published standalone analyses of these peers: LyondellBasell (LYB) (rated Hold).
Growth
ALB — Financial Growth (Quarterly, USD Mil)
| Metric | 2025-09-30 | 2025-12-31 | 2026-03-31 | 2026-06-30 | 2026-09-30 |
|---|---|---|---|---|---|
| REVENUE (USD Mil) | 1,307.8 | 1,428 | 1,428.7 | 1,743.3 | 1,553.1 |
| EBIT (USD Mil) | -188.2 | -227.2 | 287.3 | 472.6 | 161 |
| EBITDA (USD Mil) | -23.7 | -63.5 | 445.1 | 628.4 | 329.4 |
| NET INCOME (USD Mil) | -160.7 | -414.2 | 319.1 | 480 | 296.8 |
| DILUTED EPS | -1.7 | -3.9 | 2.3 | 3.7 | 2.1 |
Source: Yahoo Finance — Quarterly Financial Statements
Albemarle’s revenue moved from $1.3B in Q3 2025 to $1.4B in Q4 2025, then held at $1.4B in Q1 2026 before rising to $1.7B in Q2 2026 and easing to $1.6B in Q3 2026. That is a sharp rebound from the Q3 2025 trough, but the Q3 2026 pullback shows the recovery is not linear.
EBITDA and net income outpaced revenue in Q1 2026 and Q2 2026, with EBITDA up to $445M and $628M versus revenue growth of 0.0% and 22.0%. That tells me operating leverage is real when pricing and volume cooperate, but the Q3 step-down means the market should not extrapolate one quarter too far.
Growth versus peers
| Company | Revenue TTM (USD Mil) | Revenue Growth YoY % | EBITDA TTM (USD Mil) | Diluted EPS TTM |
|---|---|---|---|---|
| ALB | 6,153.2 | 18.8% | 1,696.2 | 4.2 |
| LYB | 31,964 | 10.0% | 4,229 | 4.1 |
| SQM | 7,664.4 | 80.0% | 3,665.7 | 6.1 |
| LAC | — | — | -64.2 | 0.3 |
| SGML | 142.5 | 223.9% | 41.6 | -0.4 |
| ICL | 7,769 | 3.1% | 1,384 | 0.2 |
Source: Yahoo Finance
ALB’s revenue growth of 18.8% TTM sits above LYB at 10.0% and ICL at 3.1%, but well below SQM at 80.0% and SGML at 223.9%. That premium is only partly justified because ALB’s $6.2B revenue base is much larger and more durable than SGML’s $142.5M base, but it is still not the kind of growth rate that usually earns a top-tier multiple.
Profitability
ALB — Profitability (TTM)
| Metric | TTM |
|---|---|
| Operating Margin (TTM) | 17.1% |
| Net Margin (TTM) | 11.1% |
| Return on Assets (TTM) | 4.0% |
| Return on Equity (TTM) | 7.0% |
Source: Yahoo Finance — Trailing Twelve Months (TTM)
TTM operating margin of 17.1% and net margin of 11.1% point to a business that is already profitable at the operating line. TTM return on assets of 4.0% and return on equity of 7.0% show the company is earning acceptable returns, but not the kind of returns that would justify ignoring cycle risk.
The key signal to watch is further margin expansion, especially net margin moving closer to operating margin, because that would show earnings quality is improving rather than just stabilizing. That would also confirm the moat described above is translating into cash, not just into accounting profit.
Profitability versus peers
| Company | Operating Margin (TTM) | Net Margin (TTM) | Return on Assets (TTM) | Return on Equity (TTM) |
|---|---|---|---|---|
| ALB | 17.1% | 11.1% | 4.0% | 7.0% |
| LYB | 9.2% | 4.1% | 5.4% | 12.2% |
| SQM | 42.6% | 22.9% | 14.0% | 26.7% |
| LAC | n/m | n/m | -1.5% | 15.7% |
| SGML | 18.9% | -19.3% | 4.1% | -31.6% |
| ICL | 10.7% | 4.0% | 4.1% | 5.5% |
Source: Yahoo Finance Note: n/m means not meaningful. LAC (Lithium Americas) has no reported revenue yet, so Yahoo Finance shows its operating and net margins as 0.0%; that reflects no sales, not break-even operations.
ALB’s operating margin of 17.1% and net margin of 11.1% sit above LYB’s 9.2% and 4.1% and ICL’s 10.7% and 4.0%, but below SQM’s 42.6% and 22.9%. That puts ALB in the middle of the pack: better than the diversified chemical names, but still well short of the best lithium economics.
The margin gap matters because it explains why ALB can trade above LYB and ICL without looking obviously expensive, yet it also shows why the stock should not be valued like a pure high-growth lithium leader. In other words, the market is paying for quality, not for category-leading profitability.
Valuation
ALB — Valuation Multiples
| Metric | Value |
|---|---|
| Current Share Price (USD) | 82.9 |
| Market Cap (USD Mil) | 9,787 |
| Enterprise Value (USD Mil) | 12,057 |
| Trailing P/E | 20.7 |
| Forward P/E | 10.7 |
| Price/Sales (TTM) | 1.8 |
| Price/Book (mrq) | 1.2 |
| EV/Revenue | 2 |
| EV/EBITDA | 9.3 |
| Beta (5Y Monthly) | 1.36 |
| Forward EPS (USD) | 7.7 |
| Analyst Target Price – Low (USD) | 86 |
| Analyst Target Price – Mean (USD) | 140.6 |
| Analyst Target Price – High (USD) | 211 |
| # Analyst Opinions | 21 |
Source: Yahoo Finance
Albemarle trades at 2.0x enterprise value to revenue and 1.8x price to sales on trailing twelve month results, which is the right lens here because the latest reported earnings are still volatile and the market is mainly paying for a lithium recovery rather than stable current profits. At a current share price of $82.9, the stock is also on 10.7x forward earnings and 9.3x EV/EBITDA, so the market is already assuming a meaningful normalization in profitability from the recent quarter run rate.
The balance sheet adds context rather than cheapness: total debt of $2B against $1.8B of cash leaves $15.6 of cash per share and $70.4 of book value per share, so the stock trades at 1.2x book and the leverage profile is not the issue. Levered free cash flow of $1.3B TTM against a $9.8B market cap, which supports the valuation if lithium pricing holds.
Analyst coverage is broad, with 21 opinions and a $141 mean target. My fair-value range on the analysis here is roughly $90-$130 per share: that sits above the current price because I give credit for the cash generation and cleaner balance sheet, but below the consensus mean because I weight the pricing risk and uneven quarterly recovery more heavily than the sell-side appears to. On earnings, I would frame a reasonable forward EPS range around $7.0-$8.0, which brackets the company’s 7.7 forward EPS and implies the stock is not obviously cheap versus peers on a like-for-like basis.
Valuation versus peers
| Company | Current Share Price (USD) | Trailing P/E | Forward P/E | EV/Revenue | EV/EBITDA | Price/Sales (TTM) | Price/Book (mrq) | Market Cap (USD Mil) | Enterprise Value (USD Mil) | Beta (5Y Monthly) | Forward EPS | Analyst Target Price – Low | Analyst Target Price – Mean | Analyst Target Price – High | # Analyst Opinions |
|---|---|---|---|---|---|---|---|---|---|---|---|---|---|---|---|
| ALB | 82.9 | 20.7 | 10.7 | 2 | 9.3 | 1.8 | 1.2 | 9,787 | 12,057 | 1.36 | 7.7 | 86 | 140.6 | 211 | 21 |
| LYB | 57.9 | 14.2 | 9.1 | 0.9 | 7.8 | 0.6 | 1.7 | 18,897 | 29,238 | 0.32 | 6.3 | 58 | 71.8 | 93 | 18 |
| SQM | 47.3 | 7.9 | 7.7 | 1.9 | 4.4 | 1.8 | 2.1 | 13,668 | 14,147 | — | 6.3 | 44.4 | 77.4 | 110 | 18 |
| LAC | 1.3 | 3.9 | — | — | — | — | 0.3 | 500 | 968 | 3.47 | -0.1 | 1.8 | 4 | 8 | 9 |
| SGML | 3.9 | — | 6.2 | 5.8 | 45.3 | 3.7 | 8.2 | 461 | 729 | 0.76 | 0.9 | 7 | 8.2 | 10.7 | 3 |
| ICL | 4.1 | 16.6 | — | 1 | 5.9 | 0.7 | 0.9 | 5,397 | 8,023 | 1 | 0.5 | 5.5 | 5.7 | 6 | 4 |
Source: Yahoo Finance
ALB trades at 2.0x EV/Revenue and 20.7x trailing P/E, versus LYB at 0.9x and 14.2x, SQM at 1.9x and 7.9x, ICL at 1.0x and 16.6x, and SGML at 5.8x and no trailing P/E, so ALB is priced richer than the diversified chemical names but far below the speculative lithium multiple. On forward earnings, ALB’s 10.7x P/E against forward EPS of 7.7 is more demanding than LYB’s 9.1x on $6.3 and SQM’s 7.7x on $6.3, which implies the market is giving ALB credit for a cleaner earnings path than peers.
That said, ALB’s richer multiple is not backed by a clear lead in profitability or returns, so the premium is really a bet on balance-sheet quality and a steadier lithium recovery. I do not think the peer set supports a much higher multiple unless the next few quarters show that the recovery is durable rather than episodic.
Leverage
ALB — Leverage & Coverage (Quarterly)
| Metric | Value |
|---|---|
| Total Debt/Equity % (mrq) | 18.5 |
| Current Ratio (mrq) | 2.3 |
| Total Debt (mrq, USD Mil) | 1,998.2 |
| Operating Cash Flow (TTM, USD Mil) | 1,850.5 |
| Levered Free Cash Flow (TTM, USD Mil) | 1,250.1 |
Source: Yahoo Finance — Quarterly Financial Statements
Total debt was $2B, while total debt to equity was 18.5% and the current ratio was 2.34. That is a manageable leverage load for a company with $1.8B of operating cash flow TTM and $1.3B of levered free cash flow TTM, so near-term liquidity looks solid.
The cash conversion is also healthy: operating cash flow of $1.8B and free cash flow of $1.3B show that earnings are turning into cash rather than being trapped in working capital or capex. I would treat refinancing risk as low because the balance sheet has $1.8B of cash and the current ratio gives room to absorb a downturn before any maturity pressure becomes urgent.
Leverage versus peers
| Company | Total Debt/Equity % (mrq) | Current Ratio (mrq) | Total Debt (mrq, USD Mil) | Operating Cash Flow TTM (USD Mil) | Free Cash Flow TTM (USD Mil) |
|---|---|---|---|---|---|
| ALB | 18.5 | 2.3 | 1,998.2 | 1,850.5 | 1,250.1 |
| LYB | 120.5 | 1.8 | 13,711 | 3,706 | 1,778.6 |
| SQM | 1.1 | 2.7 | 101.9 | 3,202.9 | 806.8 |
| LAC | 64 | 4.6 | 1,339.3 | -35.3 | -1,434.8 |
| SGML | 336.6 | 0.3 | 277 | 37.8 | 44.1 |
| ICL | 50 | 1.8 | 3,263 | 1,055 | 191.9 |
Source: Yahoo Finance
ALB’s debt/equity of 18.5% is far lighter than LYB’s 120.5% and ICL’s 50.0%, and its current ratio of 2.3 is stronger than LYB’s 1.8 and ICL’s 1.8, which points to a more flexible balance sheet. That said, ALB’s $1.3B of free cash flow TTM is smaller than LYB’s $1.8B on a much larger debt base, so the balance sheet is solid but not a clear financing advantage versus the best cash generators.
The lower leverage helps explain part of ALB’s valuation premium to LYB and ICL. Investors are paying for balance-sheet safety as much as for operating quality, which is why the stock can look fair even without peer-leading margins.
Insider Activity
The insider transaction record is one-sided: 8 open-market sales and 0 open-market purchases from 2023-10-03 to 2026-05-15, so insiders are net sellers. The activity is concentrated almost entirely in Chairman & CEO J Kent Masters, which makes it more of a single-insider selling pattern than broad-based insider distribution.
In my view, that is a bear signal because the record shows persistent open-market selling with no offsetting buying. It does not by itself break the thesis, but it does sit awkwardly beside the claim that management is fully aligned with a near-term rerating.
Conclusion
I would put my rating as a Hold because Albemarle’s lithium recovery is real enough to support a rerating, but the business is still absorbing the damage from an 85% to 95% price collapse from January 2023 through 2025 and the latest quarter did not show a clean earnings inflection. The strongest support is cash generation: levered free cash flow of $1.3B TTM against $9.8B of market value, which gives the stock a cushion if pricing stabilizes. The biggest risk is execution under pressure, with $1B of 2024 charges tied to Kemerton and Chengdu plus $181.1M of goodwill impairment in Q3 2025 and $245.6M of long-lived asset impairment in Q4 2025.
I would raise my rating more toward a Buy if Energy Storage revenue stays above $1.5B for another quarter and EBITDA remains near $628.4M, because that would show the pricing recovery is durable rather than a one-quarter bounce. If that happens, the annualized EBITDA base would be roughly $2.5B, which would make the current 9.3x EV/EBITDA look much less demanding and would support a meaningfully higher equity value.
I would move from Hold to Sell if Energy Storage revenue slips back below $1.3B for two consecutive quarters or if lithium weakness forces another round of asset write-downs. The company has already taken a $1B charge in 2024 and additional impairments in 2025, so another step down in pricing would likely hit both earnings and confidence at the same time.
Weighing both paths, I think the bull case needs a cleaner and more sustained lithium recovery than the latest quarter alone provides, while the bear case already has evidence in prior impairments and uneven segment performance. That is why I stay at Hold: the upside is real if pricing stabilizes, but the next decisive move in the stock is more likely to come from proof that the recovery is durable than from another quarter of headline improvement.
What to Watch Next
- Energy Storage revenue above $1.5B — would support a move toward Buy.
- EBITDA near $628.4M for another quarter — would confirm the recovery is durable.
- Revenue below $1.3B for two straight quarters — would strengthen the Sell case.
- Another asset write-down — would signal the pricing trough is still not behind the company.
- Free cash flow staying near $1.3B TTM — would keep downside contained.
What’s your take? I rated Albemarle (ALB) HOLD above — but the goal here is to get this right, not just to publish an opinion. What would you add to this analysis, or which risk or catalyst do you think I’m under- or over-weighting? Tell me in the comments.
Our track record: every directional call is tracked publicly on The Scorecard, and Stocks Covered lists every company we have rated and when.
Sources
- SEC 10-K Annual Report — filed 2026-02-11
- SEC 8-K Filing (2026-06-05)
- SEC 8-K Filing (2026-05-08)
- SEC 8-K Filing (2026-05-06)
- SEC 8-K Filing (2026-04-17)
- SEC 8-K Filing (2026-03-25)
- SEC 8-K Filing (2026-03-06)
- SEC Form 4 Insider Transaction (2026-05-19)
- SEC Form 4 Insider Transaction (2026-04-02)
- SEC Form 4 Insider Transaction (2026-03-12)
- SEC 10-K Annual Report — FY2026
- SEC 10-K Annual Report — FY2025
- SEC 10-K Annual Report — FY2024
- SEC 10-K Annual Report — FY2023
- SEC 10-K Annual Report — FY2022
Data sourced from Yahoo Finance and SEC EDGAR. Not investment advice.
Get daily options strategies built on our research
Sign up and get access to our private Discord and Telegram options channels, updated daily. Every play is built on our equity research and the rating we give the company.
Educational content only, not investment advice. Hypothetical results, not a guarantee of future performance.
Our options track record so far: +33% in 4 weeks, hypothetical and unrealised. See the track record.
Leave a Comment