The Short Version
LiveWire Group is in the Consumer Cyclical sector and the Recreational Vehicles industry, and its stock sits in the Penny Stocks category. Short selling means borrowing shares and selling them now, hoping to buy them back later at a lower price. On this name, 2.79M shares are sold short out of 13.59M shares free to trade, so about 20.5% of the float is borrowed and sold. That is much higher than the market median of 4.4% and above the industry median of 5.2%.⁽¹⁾
The stock also traded 65.68M shares in the last session, which was 135.7 times its 60-day average volume of 483,977.⁽²⁾ That kind of burst can force short sellers to buy back shares if the price keeps rising. But the company is still losing money, and cash runway is about 10 months, so the bear case is that the move fades before shorts are squeezed out.⁽³⁾
Our read is simple: this is a crowded short with real squeeze fuel, but it also carries serious business and balance-sheet risk.⁽¹⁾⁽³⁾
Squeeze Scorecard
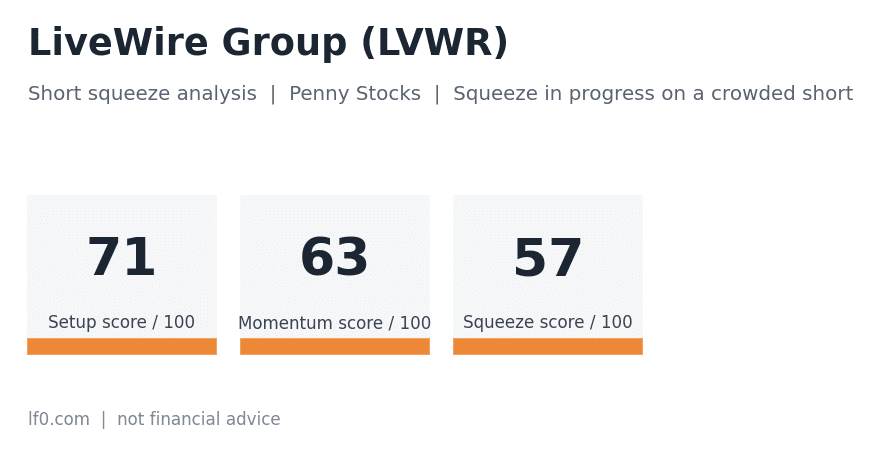
LiveWire Group (LVWR) | Penny Stocks | Squeeze in progress on a crowded short
| Score | Value | Reading | What it measures |
|---|---|---|---|
| Setup Score | 71 / 100 | strong | How crowded and fragile the bet against the stock is |
| Momentum Score | 63 / 100 | strong | Whether price and volume are already forcing short sellers to react |
| Squeeze Score | 57 / 100 | strong | Both together, reduced for dilution and cash risks |
Prices as of 2026-11-19; short interest as of the 2026-10-30 report.
How to read the scorecard
We give every stock three scores out of 100. Setup asks: how crowded is the bet against this stock, and how hard would it be for the people betting against it to get out? Momentum asks: is something already happening, with price rising on unusually heavy trading? Squeeze combines the two. It needs both, because a crowded short with nothing happening can sit for months, and a price spike with no crowded short is just a spike.
Rough guide: 0 to 30 weak, 30 to 55 moderate, 55 to 75 strong, 75 and above extreme. Most stocks score under 30 on both.
| Low Momentum | High Momentum | |
|---|---|---|
| High Setup | Loaded spring: crowded short, trigger not yet pulled | Squeeze underway |
| Low Setup | Nothing to see | Price spike without a crowded short: often fades |
This stock: Setup 71 (strong), Momentum 63 (strong), Squeeze 57 (strong). Of the 3,154 stocks we scanned, this one ranked #1 on Squeeze Score. In plain terms, a crowded bet against the stock and buying pressure are both present, so a squeeze may already be underway.
Key data
| Metric | Value |
|---|---|
| Share price (latest close) | $0.65 |
| Market value of the company | $134.1M |
| Float (shares free to trade) | 13.59M |
| Shares sold short | 2.79M |
| Short interest as % of float | 20.5% |
| Days to cover | 6.40 |
| Cost to borrow the shares (per year) | nan% |
| Shares still available to borrow | nan |
| Latest volume vs usual | 135.7x |
| Price change over 5 trading days | 38.6% |
Executive Summary
We are looking at a stock that has already started to move like a squeeze candidate, not a sleepy microcap. LiveWire closed at $0.65 on 2026-11-19, up 76.5% in the last session and 38.6% over the last 5 sessions. It also gained 122.9% from its 20-day low and reached a 5-month high of $2.59 in the recent period.⁽²⁾
The short side is meaningful. Short interest, the number of shares investors have borrowed and sold betting the price will fall, stands at 2.79M shares, or 20.5% of the float, which is the pool of shares available to trade. That is above the market 95th percentile of 17.8% and far above the market median of 4.4%. In the broader industry group, the stock ranks 85 of 95 by short interest, so it is not the most crowded name in its peer set, but it is still heavily shorted versus the typical stock.⁽¹⁾
The setup is not just about short interest. Days to cover, which estimates how many trading days it would take shorts to buy back their shares using normal volume, is 6.40. That is above the market median of 4.3 and below the market 90th percentile of 10.2, so the squeeze pressure is real but not extreme.⁽¹⁾ In plain terms, shorts are not trapped yet, but they would need a lot of liquidity to exit cleanly.
The counterweight is the company itself. LiveWire has $39.9M of cash, $77.6M of total debt, and negative trailing operating cash flow of $46.2M. That means the stock can squeeze on trading mechanics, but the business still has to survive long enough for any squeeze to matter.⁽³⁾
Get daily options strategies built on our research
Sign up and get access to our private Discord and Telegram options channels, updated daily. Every play is built on our equity research and the rating we give the company.
Educational content only, not investment advice. Hypothetical results, not a guarantee of future performance.
Our options track record so far: +33% in 4 weeks, hypothetical and unrealised. See the track record.
Short Interest and Days to Cover
Short interest is the first thing we watch because it tells us how many traders are leaning against the stock. LiveWire has 2.79M shares sold short, which is 20.5% of the 13.59M shares in the float. Put differently, for every 100 shares that can trade freely, about 21 have been borrowed and sold. That is a crowded position for a stock in the market, and it sits above the market 90th percentile of 13.3% and 95th percentile of 17.8%.⁽¹⁾
Days to cover matters because it connects the short position to actual trading liquidity. LiveWire’s 6.40 days to cover means that, at the recent average pace of trading used in the calculation, shorts would need more than six full sessions to buy back their shares. That is above the market median of 4.3 days and below the market 90th percentile of 10.2 days. It is also above the broader industry median of 4.6 days.⁽¹⁾
The history shows that this is not a one-day anomaly. Short interest was 3.24M shares on 2026-07-15, rose to 3.90M on 2026-07-31, and then moved around before reaching 2.79M on 2026-10-30. The latest report is dated 2026-10-30, so the short data is already a few weeks old and can lag the current tape.⁽¹⁾ That matters because a fast rally can force shorts to cover before the next report shows up.
The bull case is straightforward: if the stock keeps rising and volume stays elevated, shorts may have to buy into strength, which can push the price higher still. The bear case is just as simple: if the move stalls, shorts can wait, and a high short interest alone does not guarantee a squeeze.⁽¹⁾⁽²⁾
| Short interest (% of all shares) | Days to cover | |
|---|---|---|
| LVWR (this stock) | 1.4% | 6.40 |
| Industry median (94 peers: Motorcycles, Bicycles & Parts) | 5.2% | 4.6 |
| Peer: Lucid Group (LCID) | 25.5% | 9.1 |
| Peer: Redwire Corporation (RDW) | 19.6% | 4.5 |
| Peer: Harley-Davidson (HOG) | 19.6% | 8.5 |
| Peer: Visteon Corporation (VC) | 16.5% | 5.4 |
| Peer: Patrick Industries, Inc. Commo (PATK) | 16.4% | 5.6 |
| Typical US-listed stock (median) | 4.4% | 4.3 |
| Most-shorted 10% of stocks start at | 13.3% | 10.2 |
| Most-shorted 1% of stocks start at | 28.0% |
Context for the numbers. This table measures short interest as a percent of all shares the company has issued, because that is the one measure we can compare across 3,587 stocks. The stricter percent-of-float figure used elsewhere in this article is always higher than this one. On this measure LVWR is more heavily shorted than about 18% of exchange-listed stocks.
Hover over a bar for the figures. Red bars: shares sold short at each twice-monthly report. Dashed blue line: the float, meaning the shares free to trade. Latest: 2.79M shares short, 20.5% of the float.
Borrow Fee and Availability
Borrow fee, the annual cost to borrow shares for short selling, is not available here. Shares available to borrow are also not available. That means we cannot tell whether the lending market is tight or loose right now, which removes one of the usual clues for how painful it is to stay short.⁽⁴⁾
We do know there were 76,499 failed deliveries in the latest half month. Failed deliveries happen when shares are not delivered on time after a trade, and they can be a sign of settlement stress, though they do not by themselves prove a squeeze. The stock is not on the regulatory threshold list for persistent delivery failures.⁽⁴⁾
That mix is important. A stock can still squeeze without a visible borrow fee spike if the price and volume move fast enough, but a tight borrow market would make the setup even more dangerous for shorts. Here, we do not have that confirmation.⁽⁴⁾⁽²⁾ So the squeeze case rests more on price action and short positioning than on a documented borrow shortage.
For traders, the missing borrow data cuts both ways. It means shorts may not be paying a visible premium to stay in the trade, but it also means we cannot rule out a sudden tightening if demand for borrow rises.⁽⁴⁾ In a name this small, that can change quickly.
Price and Volume Trigger
The tape is the clearest trigger we have. LiveWire traded 65.68M shares in the last session, compared with a 60-day average of 483,977 shares. That is 135.7 times normal volume, which tells us the stock is not moving on a quiet drift.⁽²⁾ When a heavily shorted stock trades that much more than usual, shorts can lose the ability to exit calmly.
The price move has been sharp enough to matter. The stock rose 76.5% in the last session and 38.6% over the last 5 sessions. It is also up 122.9% from its 20-day low.⁽²⁾ That kind of acceleration can create a feedback loop: rising price hurts shorts, shorts buy to reduce risk, and that buying can lift the stock again.
We also note the stock’s recent high of $2.59 over the last 5 months. That gives traders a reference point for where momentum has already been tested. If the stock can hold above the recent breakout area while volume stays far above average, the squeeze argument gets stronger. If volume collapses, the move can lose fuel quickly.⁽²⁾
The counter-argument is that very fast moves often attract profit-taking. A stock that jumps this hard can also retrace hard, especially if buyers step back and shorts do not need to chase.⁽²⁾ So the same volume that can force a squeeze can also mark a blow-off move if it fades.
Hover over any day for its price and volume. Blue line: daily closing price. Bars: shares traded each day; dashed line: the usual (60-day average) volume. The latest price of $0.65 is 75% below the six-month high of $2.59 (Jul 29). Orange bars mark days with at least three times the usual trading volume; the most recent was Nov 19.
Options and Gamma
Options are available on this stock, which matters because call option, a contract that rises in value when the stock rises, can add fuel to a squeeze. LiveWire has 11,050 call open interest contracts and 3,592 put open interest contracts across the expiries used here. That means call positioning is larger than put positioning, but not wildly so.⁽⁵⁾
Call volume was 226 contracts versus 760 put contracts, and the call-put volume ratio was 0.3. That tells us the most recent trading flow leaned more toward puts than calls, so we do not have a clean options-fueled bullish stampede.⁽⁵⁾ In other words, the options market is present, but it is not screaming one-way speculation.
Call open interest in shares is 8.13% of the float. That is enough to matter if the stock keeps rising, because market makers who sold those calls may need to hedge by buying shares. That hedging effect can create gamma squeeze, a move where option hedging helps push the stock higher. But the data also show 0 out-of-the-money call open interest 10% to 30% above spot, so there is not a big stack of far-out bullish bets waiting to ignite.⁽⁵⁾
Implied volatility, which measures how expensive options are relative to expected future movement, is not available near the money. Without that, we cannot judge whether traders are already paying up for the move. The options market may still amplify the stock, but the current data do not show a classic explosive call-chasing setup.⁽⁵⁾
Catalysts and Filings
We do not have any recent headlines listed here, so no clear catalyst was identified for the latest move. That is important because a squeeze can start without news, but it is harder to judge whether the move has a fundamental anchor when there is no headline to point to.⁽²⁾
The filing picture is mixed. There were 3 Form 8-K filings in the last 60 days, covering departure or appointment of directors or officers, notice of delisting or listing-standard failure, and results of operations. An 8-K is a filing companies use to report material events quickly, so these items tell us the company has had governance, listing, and operating updates recently. We do not have a specific new dilution filing in the last 12 months.⁽⁶⁾
That matters because dilution, the issuance of new shares that can reduce each existing share’s claim on the business, is one of the main ways a small company can relieve pressure or raise cash at the expense of shareholders. Here, no dilution filing was found, so we do not have evidence of an immediate share-issuance overhang from the filings list. Still, the delisting-related 8-K shows the company has already had listing-standard stress, which is a separate risk from the squeeze itself.⁽⁶⁾
For traders, the key question is whether a filing or headline appears that changes the story. A positive operational update could help the squeeze continue. A negative filing, especially one tied to listing issues or financing, could stop the rally fast.⁽⁶⁾
Solvency and Dilution Risk: The Bear Case
The bear case starts with the balance sheet. LiveWire has $39.9M of cash and $77.6M of total debt, for net debt of $37.7M. It also has trailing operating cash flow of negative $46.2M and free cash flow of negative $32.5M. That means the company is burning cash, not generating it.⁽³⁾
Revenue over the trailing twelve months was $33.4M, while net income was negative $72.6M and gross margin was negative 4.0%. Negative gross margin means the company is losing money even before overhead, which is a serious warning sign for any long squeeze setup. Cash runway is about 10 months, so if the burn rate stays similar, the company does not have a long cushion.⁽³⁾
This is where short sellers often make their case. A stock can be heavily shorted and still deserve to be short if the business is weak enough.⁽¹⁾⁽³⁾ If the market decides the rally is only a trading event and not a business turnaround, the stock can fall back quickly once momentum cools. That is especially true in a penny stock, where small changes in sentiment can create large percentage swings.
There is also a structural issue: insiders hold 94.1% of the shares, while institutions hold only 2.1%. That leaves a relatively small public float, which can magnify moves in both directions.⁽¹⁾ It helps the squeeze case because fewer freely traded shares can move the price more violently, but it also means the stock can gap down just as fast if buyers disappear.
How I Would Play This
As an illustration only, not advice: I would treat this as a high-volatility squeeze candidate and keep size small if I wanted exposure at all. I would rather wait for the stock to hold strength after the big volume day than chase the first spike. If I were using shares, I would think in terms of a small position that I could survive if the move reverses sharply. If I were using call options, I would only do that if I understood that a call option is a contract that can expire worthless, so the most I can lose is the premium paid. I would want a clear trigger, such as continued price strength on heavy volume, before adding. If that trigger fails and the stock loses momentum, I would assume the squeeze thesis is breaking. If the company issues a negative filing or the price gives back the breakout, I would step aside.
A share position is the simplest way to express the idea, but it still carries full downside if the stock falls. Call options can give leveraged upside with limited loss, which fits a squeeze, but they can decay fast if the move stalls. Staying out is always a valid choice, especially when the balance sheet is weak and the catalyst is not clear. Shorting a crowded stock can lose more than you put in, because a rising price has no built-in ceiling. For this name, I would only lean in if the tape keeps confirming the squeeze and I would be ready to leave if it does not.
What Would Invalidate the Thesis
The thesis weakens if volume drops back toward normal and the stock cannot hold its recent gains. The last session’s 65.68M shares were the key signal, so a sharp fade from that level would suggest the squeeze fuel is drying up. If the stock gives back the 122.9% move from the 20-day low, the market may be telling us the rally was only a burst of forced buying.⁽²⁾
The thesis also weakens if short interest falls materially in the next report. Short interest is reported twice a month, so the current 2.79M share figure can lag what is happening now. If shorts have already covered, then the squeeze argument becomes much less powerful even if the stock stays volatile.⁽¹⁾
A negative filing, a financing move, or any sign that the company needs fresh capital would also hurt the setup.⁽⁶⁾ With cash runway about 10 months and negative cash flow, the market may quickly shift from squeeze talk back to solvency concerns.⁽³⁾ In that case, the stock could stop acting like a squeeze and start acting like a distressed penny stock again.
Conclusion
LiveWire Group is a crowded short relative to the market, with 20.5% of float sold short and 6.40 days to cover, both above typical levels.⁽¹⁾ The stock has also already shown a strong price and volume trigger, with 65.68M shares traded in the last session and a 76.5% one-day gain.⁽²⁾ That gives the squeeze case real fuel.
At the same time, the bear case is serious. The company is burning cash, has negative gross margin, and carries net debt, so the business risk is not theoretical.⁽³⁾ We also do not have a clear news catalyst, and the options market is not showing a dramatic call-led blowout.⁽²⁾⁽⁵⁾
Our overall read is that this is a squeeze in progress, but not a clean one.⁽¹⁾ The crowding is meaningful, the trigger is real, and the main risk is that the move fades before shorts are forced out.
Sources
Where the figures in this article come from, so you can check them yourself:
- FINRA equity short interest report, settlement date 2026-10-30
- Daily price and volume history for LVWR
- Financial statements and balance sheet for LVWR
- Borrow fee and shares available from Interactive Brokers’ public stock loan file; failed deliveries and threshold list from SEC and exchange data
- Listed options chain for LVWR
- SEC filings for LVWR
How We Score This (Methodology v1)
Every stock in our daily scan gets two scores from 0 to 100. Each ingredient is scaled between a level that earns no points and a level that earns full points, then weighted by how much it matters. A score is the points earned divided by the weight of the ingredients we could measure, so a stock without listed options is not penalised for it.
Setup Score: how crowded and fragile is the bet against the stock?
| Ingredient | Weight | Points earned | How it scales |
|---|---|---|---|
| Short interest as % of float | 30 | 13.3 | 5% = 0 pts, 40% = full |
| Days to cover | 10 | 7.7 | 1 day = 0, 8 days = full |
| Borrow fee (annualised) | 15 | n/a | 5% = 0, 100% = full (log scale) |
| Shares available to borrow vs shares short | 10 | n/a | 50% of short = 0, 1% = full |
| Change in short interest since the prior report | 10 | 7.2 | 0% = 0, +30% = full |
| Float size | 10 | 10.0 | 500M shares = 0, 50M = full |
| Fails-to-deliver / Reg SHO threshold list | 5 | 5.0 | On threshold list = full |
| Listing pressure (low share price) | 10 | 10.0 | $3 = 0, $1 or below = full |
Momentum Score: is the squeeze already starting?
| Ingredient | Weight | Points earned | How it scales |
|---|---|---|---|
| Volume vs 60-day average | 30 | 30.0 | 1.5x = 0, 8x = full (log scale) |
| 5-day price change | 20 | 7.1 | +5% = 0, +100% = full |
| Gain from the 20-day low | 15 | 12.0 | +15% = 0, +150% = full |
| Call open interest (in shares) vs float | 15 | 4.5 | 1% = 0, 25% = full |
| Call/put volume ratio | 5 | 0.0 | 1.0 = 0, 5.0 = full |
| Implied volatility (nearest expiry, near the money) | 5 | n/a | 60% = 0, 300% = full |
| Social attention (StockTwits / Reddit) | 10 | n/a | Not scored in v1 (needs a browser session) |
Squeeze Score. The geometric mean of Setup and Momentum, so a stock needs both a crowded short and price pressure to rank highly. It is reduced by 20% if the company has recently filed paperwork that lets it sell new shares into a rally (which gives short sellers an exit), and by 15% if it has less than 12 months of cash at its current burn.
Size categories. Large Caps: market value of $10B or more. Penny Stocks: share price under $5 and market value under $300M. Small Caps: everything else.
A caution on timing. Short interest is only reported twice a month, so the true position today may be higher or lower than the figure shown.
This article is for educational and informational purposes only. It is not financial advice or a recommendation to buy or sell any security. Short squeeze stocks are extremely volatile and you can lose all of your investment. We may hold positions in securities we discuss. Do your own research.
Get daily options strategies built on our research
Sign up and get access to our private Discord and Telegram options channels, updated daily. Every play is built on our equity research and the rating we give the company.
Educational content only, not investment advice. Hypothetical results, not a guarantee of future performance.
Our options track record so far: +33% in 4 weeks, hypothetical and unrealised. See the track record.
Join the LF0 Equity Research community on Discord
Get each new research article as it is published and talk it through with other readers.
Leave a Comment