Expected price range
Each range is set from the stock’s recent price history and our Hold rating, using its own 1-year realised volatility (35% annualised) as the width of a ~68% statistical band, and checked against that rating so the range leans the same way as our view. Starting price $23.15 (close 2026-11-19). The stock traded between $18.90 and $24.37 over the last 6 months and between $18.90 and $31.66 over the last year. This is an illustration of where our view and normal volatility point, not a forecast, price target or investment advice; the stock can move outside it.
| Company | Nov 25 | Dec 25 | Jan 26 | Feb 26 | Mar 26 | Apr 26 | May 26 | Jun 26 | Jul 26 | Aug 26 | Sep 26 | Oct 26 | 12-Mo |
|---|---|---|---|---|---|---|---|---|---|---|---|---|---|
| CPB | +1% | -9% | +2% | -4% | -17% | -5% | +2% | +5% | +0% | +8% | -16% | +9% | -24% |
| KR | +6% | -7% | +1% | +9% | +6% | -6% | -8% | -11% | +4% | +0% | +2% | +14% | +7% |
| HSY | +12% | -3% | +7% | +22% | -12% | -11% | +5% | -10% | -0% | +1% | -11% | +5% | +1% |
| KHC | +5% | -5% | -2% | +4% | -7% | +1% | +6% | +0% | +9% | -1% | -10% | +7% | +5% |
| GIS | +2% | -2% | +1% | -2% | -18% | -4% | -4% | +3% | +5% | +15% | -22% | +9% | -21% |
| SJM | +2% | -6% | +7% | +12% | -17% | +2% | +6% | +9% | +6% | +11% | -9% | +9% | +31% |
Source: Yahoo Finance monthly adjusted close.
Quick Thesis
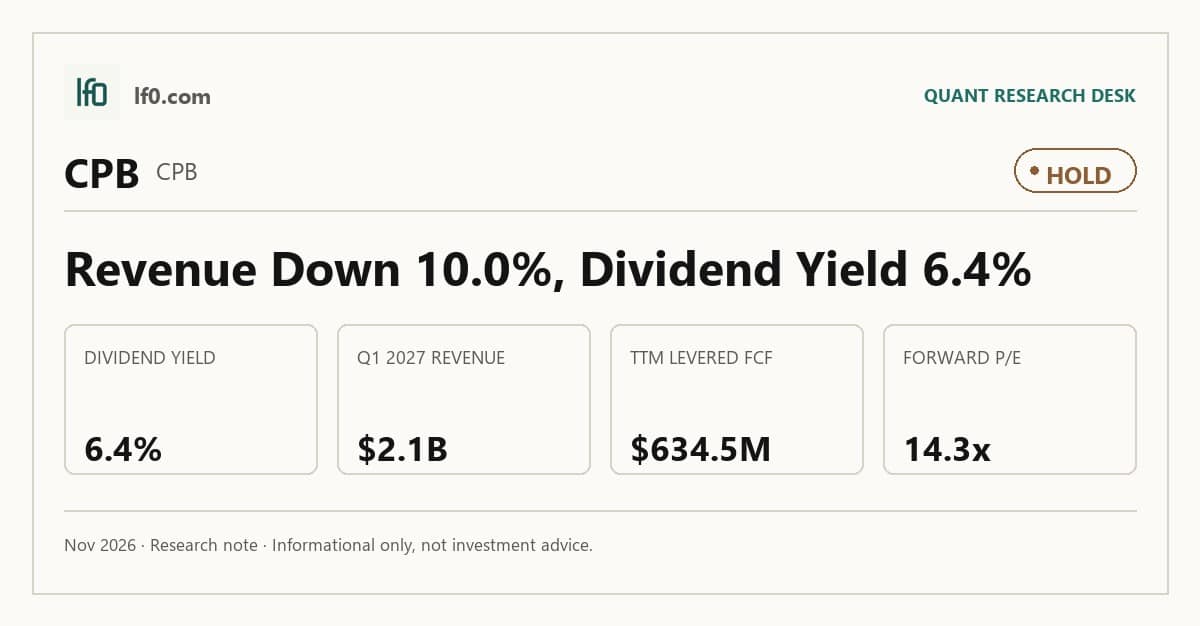
- Rated hold — revenue is weakening faster than the dividend can offset.
- Strongest support: $634.5M of TTM levered free cash flow.
- Main risk: 7.45B of debt with a 0.8 current ratio.
- Valuation is mixed: 11.3x EV/EBITDA and 14.3x forward P/E.
- I would turn more constructive if quarterly revenue stabilizes above $2.3B.
Executive Summary
We’ll begin tracking this call’s performance since publication once sufficient adjusted-close data is available.
I would put my rating as a Hold because Campbell still generates enough cash to support its 6.4% dividend, but the latest quarter shows the earnings base is slipping faster than I want to see. Revenue fell to $2.1B in Q1 2027 from $2.4B in Q1 2026, and net income swung to a $60M loss, so the near-term trend is weaker than the income yield alone suggests. I would raise my rating more towards a Buy if quarterly revenue stabilizes above $2.3B and net margin moves closer to operating margin, which would show that pricing and cost savings are finally offsetting the drag from interest and integration.
Company Profile
Campbell Soup Company is a branded food manufacturer with two reportable segments: Meals & Beverages and Snacks. Meals & Beverages includes soups, broths, sauces, beverages, and the Sovos Brands portfolio, while Snacks includes Pepperidge Farm, Goldfish, Snyder’s of Hanover, Cape Cod, Kettle Brand, Late July, and Snack Factory. The company is headquartered in Camden, New Jersey, trades on Nasdaq under CPB, and sells across the U.S., Canada, and Latin America. Its direct-store-delivery model in Snacks and its broad trademark portfolio are central to how it keeps shelf space and pricing power in a category where private label is always a threat.
Economic Moat
Business Model
Campbell’s moat is built on brand equity, shelf presence, and distribution reach rather than on a hard-to-copy technology edge. As of September 11, 2024, it owned more than 3,000 trademark registrations and applications in over 150 countries, which protects brands such as Campbell’s, Goldfish, Kettle Brand, Prego, Rao’s, Pepperidge Farm, Snyder’s of Hanover, and V8. I view that trademark base as the core structural advantage because branded food is won at shelf, where private label competes mainly on price. The Snacks segment’s direct-store-delivery model adds another layer of control over execution and retail visibility, and the company’s scale with major customers helps keep those brands in front of shoppers.
Business & Operating Risks
The main disclosed risk is inflation, because Campbell has to pass through higher commodity, labor, packaging, fuel, and distribution costs without losing volume to cheaper alternatives. The Sovos acquisition adds a second risk: management itself says the integration will be complex, time-consuming, and expensive, and that expected synergies may not arrive on schedule. Customer concentration is also meaningful, with the five largest customers accounting for about 47% of net sales and Walmart alone representing about 22%. Taken together, these risks do not break the moat, but they do pressure the pricing and shelf-space advantages that the moat depends on.
Management Discussion & Analysis
Management is responding to those risks with a mix of financing, restructuring, and portfolio simplification, but the response is still in progress. The March 2024 Sovos acquisition was funded with debt and then refinanced with senior notes, which pushed maturities out but also left the company with a heavier interest burden. Campbell is also targeting about $250M of annual savings by the end of 2028, plus up to about $115M from its Snacks route-to-market initiative, yet the 2024 gross margin still fell to 30.8% from 31.2%, so the savings have not yet fully offset inflation and acquisition dilution. In my view, management is actively addressing the disclosed risks, but the numbers show the fix is not complete.
Recent Events
The most important recent event was the leadership transition announced in December 2024, when Mark A. Clouse said he would retire and Mick J. Beekhuizen was named CEO effective February 1, 2025. Because Beekhuizen already led Meals & Beverages and previously served as CFO, I read this as continuity rather than a strategic reset. Campbell also issued $1.15B of senior unsecured notes in October 2024, which strengthens liquidity but reinforces that the balance sheet is being managed for stability, not rapid deleveraging. The noosa sale and the company name change to The Campbell’s Company both point in the same direction: a cleaner portfolio and a more focused corporate identity.
Financial Analysis
LF0 has published standalone analyses of these peers: Kraft Heinz (KHC) (rated Hold); General Mills (GIS) (rated Hold).
Growth
CPB — Financial Growth (Quarterly, USD Mil)
| Metric | 2025-07-31 | 2025-10-31 | 2026-01-31 | 2026-04-30 | 2026-07-31 |
|---|---|---|---|---|---|
| REVENUE (USD Mil) | 2,321 | 2,677 | 2,564 | 2,366 | 2,137 |
| EBIT (USD Mil) | 269 | 337 | 275 | 242 | 6 |
| EBITDA (USD Mil) | 375 | 436 | 377 | 347 | 113 |
| NET INCOME (USD Mil) | 145 | 194 | 145 | 124 | -60 |
| DILUTED EPS | 0.5 | 0.7 | 0.5 | 0.4 | -0.2 |
Source: Yahoo Finance — Quarterly Financial Statements
Revenue rose to $2.7B in Q2 2026 before sliding to $2.1B in Q1 2027, so the recent trend is clearly down rather than flat. The latest quarter was down $2.6B year over year from $2.6B, and EBITDA fell to $113M from $347M in the prior quarter. That kind of drop is more than normal seasonality, and it tells me the post-Sovos portfolio is still absorbing cost pressure and mix headwinds rather than compounding cleanly. The moat is still visible in the scale of the business, but the growth line is not yet reinforcing it.
Growth versus peers
| Company | Revenue TTM (USD Mil) | Revenue Growth YoY % | Diluted EPS TTM |
|---|---|---|---|
| CPB | 9,744 | -7.9% | 1.3 |
| KR | 149,326 | 2.0% | 1.8 |
| HSY | 12,258 | 3.0% | 8.8 |
| KHC | 24,778 | -2.0% | -2.9 |
| GIS | 18,296.6 | -2.8% | -1.6 |
| SJM | 9,156.9 | 5.0% | 2.1 |
Source: Yahoo Finance
Campbell’s revenue declined 7.9% TTM, while KR grew 2.0%, HSY grew 3.0%, KHC fell 2.0%, GIS fell 2.8%, and SJM grew 5.0%. That puts CPB at the weak end of the peer set on top-line momentum, so the market is not paying for growth leadership here. The comparison also matters for valuation: a slower-growing name can still work if the balance sheet is cleaner, but Campbell does not have that advantage.
Profitability
CPB — Profitability (TTM)
| Metric | TTM |
|---|---|
| Operating Margin (TTM) | 12.4% |
| Net Margin (TTM) | 4.1% |
| Return on Assets (TTM) | 4.9% |
| Return on Equity (TTM) | 10.1% |
Source: Yahoo Finance — Trailing Twelve Months (TTM)
TTM operating margin of 12.4% and net margin of 4.14% show a profitable packaged-food business, but the spread between the two still leaves room for financing and other below-the-line costs to eat into equity returns. Return on assets of 4.94% and return on equity of 10.1% are respectable, yet they do not point to a premium return profile. I would watch net margin more than operating margin from here, because a narrower gap would show that interest expense and other non-operating items are becoming less of a drag. In other words, the company is profitable, but the current return profile looks steady rather than exceptional.
Profitability versus peers
| Company | Operating Margin (TTM) | Net Margin (TTM) | Return on Assets (TTM) | Return on Equity (TTM) |
|---|---|---|---|---|
| CPB | 12.4% | 4.1% | 4.9% | 10.1% |
| KR | 3.2% | 0.7% | 5.8% | 14.4% |
| HSY | 21.2% | 14.6% | 11.8% | 38.0% |
| KHC | 17.7% | -14.0% | 3.6% | -9.0% |
| GIS | 15.6% | -4.9% | 5.6% | -10.5% |
| SJM | 18.6% | 2.5% | 6.3% | 3.9% |
Source: Yahoo Finance
CPB’s operating margin of 12.4% and net margin of 4.14% sit below HSY’s 21.2% and 14.6%, KHC’s 17.7% and -14.0%, GIS’s 15.6% and -4.9%, and SJM’s 18.6% and 2.5%, while KR runs at 3.2% operating margin and 0.7% net margin. The gap looks more like a mid-tier branded-food profile than a best-in-class one, which is why the stock deserves a moderate multiple rather than a premium. CPB’s 10.1% ROE is respectable, but it does not stand out enough to justify paying up versus the stronger margin names.
Valuation
CPB — Valuation Multiples
| Metric | Value |
|---|---|
| Current Share Price (USD) | 23.1 |
| Market Cap (USD Mil) | 7,289 |
| Enterprise Value (USD Mil) | 14,345 |
| Trailing P/E | 18.6 |
| Forward P/E | 14.3 |
| Price/Sales (TTM) | 0.8 |
| Price/Book (mrq) | 1.9 |
| EV/Revenue | 1.5 |
| EV/EBITDA | 11.3 |
| Beta (5Y Monthly) | 0.05 |
| FCF Yield % (TTM) | — |
| Forward EPS (USD) | 1.8 |
| Analyst Target Price – Low (USD) | 16 |
| Analyst Target Price – Mean (USD) | 20.8 |
| Analyst Target Price – High (USD) | 41.5 |
| # Analyst Opinions | 17 |
Source: Yahoo Finance
Campbell trades at 11.3x EV/EBITDA, 14.3x forward P/E, 18.6x trailing P/E, 1.47x EV/revenue, and 0.751x price/sales at a share price of $23.1. On my read, that is not expensive for a low-beta consumer staple, but it is not cheap enough to ignore the growth slowdown and the leverage load. The 6.4% trailing dividend yield is doing a lot of the work in the valuation case, which is why the stock still screens as an income name rather than a rerating candidate.
On the analysis here, I would put fair value in a broad $20-$26 range. That sits below the $20.8 analyst mean only modestly, and I think that gap is justified because I weight the weaker revenue trend and balance-sheet strain more heavily than the consensus appears to. The company’s forward EPS of 1.84 also looks reasonable versus peers, but the market is not paying for a strong earnings acceleration story; it is paying for a defensive cash stream. Relative to peers, that makes the current multiple look fair rather than obviously cheap.
Valuation versus peers
| Company | Current Share Price (USD) | Trailing P/E | Forward P/E | EV/Revenue | EV/EBITDA | Price/Sales (TTM) | Price/Book (mrq) | Market Cap (USD Mil) | Enterprise Value (USD Mil) | Beta (5Y Monthly) | Forward EPS | Analyst Target Price – Low | Analyst Target Price – Mean | Analyst Target Price – High | # Analyst Opinions |
|---|---|---|---|---|---|---|---|---|---|---|---|---|---|---|---|
| CPB | 23.1 | 18.6 | 14.3 | 1.5 | 11.3 | 0.8 | 1.9 | 7,289 | 14,345 | 0.05 | 1.8 | 16 | 20.8 | 41.5 | 17 |
| KR | 66.9 | 37.3 | 12.6 | 0.4 | 10.7 | 0.3 | 7 | 40,780 | 62,202 | 0.36 | 5.5 | 57 | 70 | 85 | 23 |
| HSY | 173.9 | 19.9 | 18.6 | 3.3 | 13 | 2.9 | 7.3 | 35,360 | 40,114 | 0.07 | 9.5 | 154 | 180.9 | 230 | 21 |
| KHC | 24.9 | — | 12 | 1.9 | 8.9 | 1.2 | 0.8 | 30,117 | 46,216 | 0.10 | 2 | 20 | 25.1 | 41 | 17 |
| GIS | 34.1 | 9.2 | 11.2 | 1.7 | 21.1 | 1 | 2.5 | 18,463 | 31,645 | -0.01 | 3.1 | 30 | 36.5 | 45 | 17 |
| SJM | 131.3 | 62.5 | 13.1 | 2.3 | 15.8 | 1.6 | 2.5 | 14,284 | 21,138 | 0.25 | 11 | 120 | 142.4 | 160 | 16 |
Source: Yahoo Finance
CPB trades at 1.47x EV/revenue and 11.3x EV/EBITDA, versus KR at 0.4x and 10.7x, HSY at 3.3x and 13.0x, KHC at 1.9x and 8.9x, GIS at 1.7x and 21.1x, and SJM at 2.3x and 15.8x. On a stock-performance basis, a $1 investment a year ago would be worth $0.84 in CPB, versus $1.09 in KHC and $1.30 in SJM, which tells me the market has already discounted the weaker growth profile. That is why I do not see a valuation gap large enough to offset the slower revenue trend and the leverage profile.
Leverage
CPB — Leverage & Coverage (Quarterly)
| Metric | Value |
|---|---|
| Total Debt/Equity % (mrq) | 179.3 |
| Current Ratio (mrq) | 0.8 |
| Total Debt (mrq, USD Mil) | 7,450 |
| Operating Cash Flow (TTM, USD Mil) | 1,039 |
| Levered Free Cash Flow (TTM, USD Mil) | 634.5 |
| Net Debt/EBITDA (TTM) | — |
| FCF Margin % (TTM) | — |
Source: Yahoo Finance — Quarterly Financial Statements
Total debt was 7.45B and the current ratio was 0.815, so the balance sheet is stretched even though cash generation remains solid. Operating cash flow of 1039 and levered free cash flow of 634.5 show that the company can still service the debt and fund the dividend, but the cushion is not wide. I view that as a financing constraint, not a thesis breaker: leverage is manageable as long as earnings stabilize, but it leaves little room for another leg down in operating profit.
Leverage versus peers
| Company | Total Debt/Equity % (mrq) | Current Ratio (mrq) | Total Debt (mrq, USD Mil) | Operating Cash Flow TTM (USD Mil) | Free Cash Flow TTM (USD Mil) |
|---|---|---|---|---|---|
| CPB | 179.3 | 0.8 | 7,450 | 1,039 | 634.5 |
| KR | 413.2 | 0.7 | 24,158 | 6,708 | 2,535.5 |
| HSY | 111.4 | 1.2 | 5,430.1 | 2,565.4 | 1,671.2 |
| KHC | 49.9 | 1 | 18,003 | 4,336 | 3,191.4 |
| GIS | 182.4 | 0.7 | 13,615.6 | 2,067 | 1,302.6 |
| SJM | 120.7 | 0.9 | 6,940.2 | 1,909.9 | 1,464.3 |
Source: Yahoo Finance
CPB’s debt/equity of 179.3% is below KR’s 413.2% but above HSY’s 111.4%, KHC’s 49.9%, and SJM’s 120.7%, while its current ratio of 0.815 trails HSY’s 1.2 and KHC’s 1.0. Free cash flow of 634.5 is solid, but the balance sheet still looks stretched relative to the cleaner names, so the leverage profile is a constraint rather than a source of upside. That matters because the weaker growth profile leaves less room for execution error if rates stay higher for longer.
Insider Activity
The insider record is one-sided, with 3 open-market sales and no open-market purchases in the sample shown. I do not read that as a major negative by itself because the trades are limited and concentrated, but it does not give me any confidence signal either. In a stock already under earnings pressure, the absence of buying matters more than the small size of the sales.
Conclusion
The key tension is that Campbell still throws off enough cash to support the dividend, but the latest quarter shows the earnings base is not yet stable enough for me to call the stock a Buy. Revenue fell to $2.1B in Q1 2027 and EBITDA dropped to $113M, so the question is not whether the business is profitable — it is — but whether the post-Sovos portfolio can stop sliding before leverage and interest expense start to matter more.
I would raise my rating more towards a Buy if quarterly revenue stabilizes above $2.3B and net margin moves closer to operating margin, because that would show pricing, mix, and cost savings are finally working together. I would also want to see the current ratio move back toward 1.0, meaning near-term assets are at least roughly covering near-term liabilities, because that would tell me the balance sheet is no longer tightening as the business absorbs the acquisition. On the downside, I would move from Hold to Sell if revenue stays near $2.1B for another quarter and net income remains negative, since that would suggest the latest decline is not a one-off and the debt load is being carried by a weaker earnings base.
My final view is still Hold. The dividend and cash flow keep this out of Sell territory for now, but the numbers have not yet shown me that the earnings slide has ended, and I would rather wait for a cleaner bottom than pay for a recovery that is not visible yet.
What to Watch Next
- Quarterly revenue above $2.3B — would support a move toward Buy.
- Net margin moving closer to operating margin — would show less below-the-line drag.
- Current ratio moving back toward 1.0 — would ease near-term liquidity pressure.
- Another quarter of negative net income — would push the rating toward Sell.
- EBITDA recovering above $200M — would help confirm the earnings base has stabilized.
What’s your take? I rated Campbell Soup (CPB) HOLD above — but the goal here is to get this right, not just to publish an opinion. What would you add to this analysis, or which risk or catalyst do you think I’m under- or over-weighting? Tell me in the comments.
Our track record: every directional call is tracked publicly on The Scorecard, and Stocks Covered lists every company we have rated and when.
Sources
- SEC 10-K Annual Report — filed 2024-09-19
- SEC 8-K Filing (2024-12-03)
- SEC 8-K Filing (2024-11-20)
- SEC 8-K Filing (2024-11-12)
- SEC 8-K Filing (2024-10-02)
- SEC 8-K Filing (2024-09-10)
- SEC 8-K Filing (2024-08-29)
- SEC Form 4 Insider Transaction (2026-05-21)
- SEC Form 4 Insider Transaction (2026-04-02)
- SEC Form 4 Insider Transaction (2026-03-31)
Data sourced from Yahoo Finance and SEC EDGAR. Not investment advice.
Get daily options strategies built on our research
Sign up and get access to our private Discord and Telegram options channels, updated daily. Every play is built on our equity research and the rating we give the company.
Educational content only, not investment advice. Hypothetical results, not a guarantee of future performance.
Our options track record so far: +33% in 4 weeks, hypothetical and unrealised. See the track record.
Leave a Comment