Expected price range
Each range is set from the stock’s recent price history and our Hold rating, using its own 1-year realised volatility (78% annualised) as the width of a ~68% statistical band, and checked against that rating so the range leans the same way as our view. Starting price $43.33 (close 2026-11-19). The stock traded between $34.90 and $73.91 over the last 6 months and between $21.38 and $73.91 over the last year. This is an illustration of where our view and normal volatility point, not a forecast, price target or investment advice; the stock can move outside it.
| Company | Nov 25 | Dec 25 | Jan 26 | Feb 26 | Mar 26 | Apr 26 | May 26 | Jun 26 | Jul 26 | Aug 26 | Sep 26 | Oct 26 | 12-Mo |
|---|---|---|---|---|---|---|---|---|---|---|---|---|---|
| COHU | +2% | -4% | +23% | +6% | +1% | +55% | +11% | +40% | -35% | -4% | +48% | -25% | +113% |
| TER | +0% | +6% | +25% | +33% | -7% | +16% | +9% | +29% | -24% | -5% | +15% | -32% | +51% |
| ONTO | +6% | +10% | +28% | +7% | -5% | +44% | -12% | +47% | -32% | +3% | +15% | -35% | +49% |
| CAMT | -15% | +1% | +38% | +14% | -9% | +27% | -11% | -5% | -19% | +1% | +16% | -25% | -6% |
| AEHR | -12% | -12% | +27% | +46% | -1% | +144% | +2% | +4% | -17% | -1% | +26% | -45% | +111% |
| FORM | +0% | +1% | +26% | +40% | -2% | +40% | -8% | +28% | -34% | -5% | +48% | -41% | +59% |
Source: Yahoo Finance monthly adjusted close.
Quick Thesis
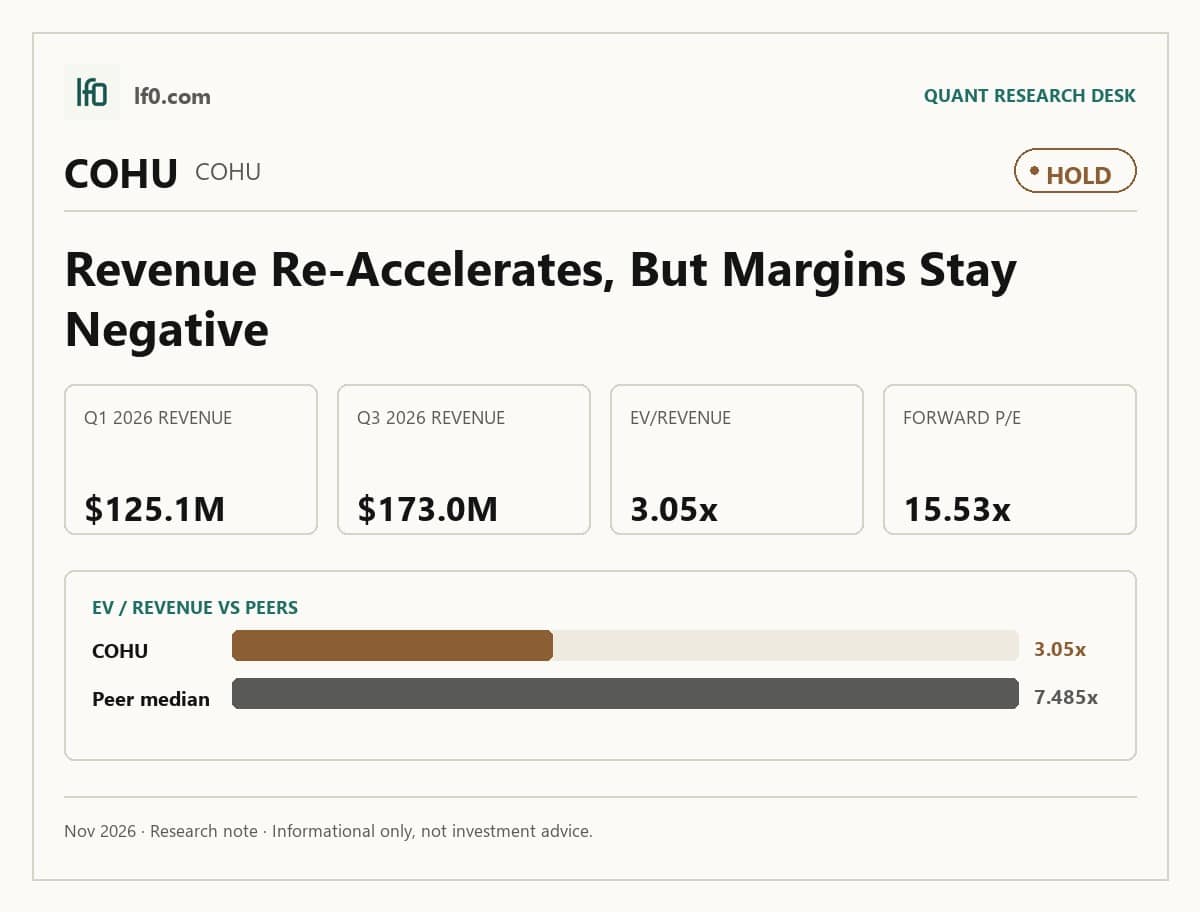
- Rated hold — revenue has re-accelerated, but margins are still negative.
- Strongest point: Q3 2026 revenue reached $173M, up 37.0% year over year.
- Biggest risk: TTM operating margin remains -1.7%, so profits have not caught up.
- Valuation is mixed: 3.0x EV/revenue is below peers, but 41.5x EV/EBITDA is demanding.
- I would turn more constructive if operating margin stays positive for two straight quarters.
Executive Summary
We’ll begin tracking this call’s performance since publication once sufficient adjusted-close data is available.
I would put my rating as a Hold because Cohu has a real installed-base advantage and a visible revenue inflection, but the stock already prices in a cleaner earnings recovery than the latest margins justify. Revenue reached $173M in Q3 2026, up 37.0% year over year, yet TTM operating margin was still -1.7% and TTM net margin was -4.0%, so the business is growing faster than it is converting that growth into profit. I would raise my rating more toward a Buy if operating margin stays positive for two consecutive quarters and TTM net margin moves materially closer to breakeven, because that would show the higher recurring mix is finally flowing through the income statement rather than just lifting the top line.
Company Profile
Cohu, Inc. was founded in 1947 and is a global supplier of semiconductor test and inspection equipment and related services that improve manufacturing yield and productivity. Revenue comes from test automation systems, semiconductor automated test equipment, inspection and metrology tools, interface products, software analytics, spares, upgrades, and service agreements, with recurring revenue accounting for 60% of fiscal 2025 net sales. The company went public long before the current semiconductor cycle and has expanded through acquisitions, including Xcerra in 2018, which broadened its test and interface portfolio. It serves 108 customers across more than 280 high-volume manufacturing facilities in 31 countries, with an installed base above 25,000 systems. Cohu is listed on Nasdaq under COHU and is financed with public equity and operating cash flow, while management continues to invest in research and development.
Economic Moat
Business Model
The installed base of more than 25,000 systems is the hardest asset for a well-funded competitor to replicate within 3 years, because it already sits inside 280 high-volume manufacturing facilities across 108 customers in 31 countries and feeds recurring revenue from interface products, services, spares, upgrades, configuration tooling, and software analytics. In my view, that base is more durable than a one-time equipment sale because the interface products are specific to individual semiconductor device designs, need frequent replacement, and become more valuable as device complexity rises. A secondary advantage is the company’s broad product stack, which spans test automation, inspection and metrology, semiconductor automated test equipment, interface solutions, software analytics, and services, so Cohu can attach more of the factory workflow than a single point-tool vendor. The current 60% recurring revenue mix in 2025, up from 49% in 2023, tells me the model is becoming less cyclical, which is a clear bull signal for investors because it improves revenue visibility and reduces dependence on customer capital spending.
Business & Operating Risks
The most material disclosed risk is product transition and inventory obsolescence: according to their SEC filings, Cohu expects rapid technological change, spent $92.2M on research and development in fiscal 2025, and warns that new products, including acquired products, can adversely affect sales and margins of existing products. The same language ties this directly to significant excess and obsolete inventory exposure and possible inventory write-offs, which matters because the company is still carrying a heavy R&D load and the financial data shows margin pressure rather than a clean step-up from new launches. In plain terms, if a platform transition misses customer adoption, the damage is not just slower growth but lower gross margin and a higher reserve bill.
The second risk is customer concentration and semiconductor cyclicality, and the filing is unusually specific here: in fiscal 2025, Cohu’s ten largest customers represented 60% of total revenue, while mobile market sales fell 54% in 2023, 10% in 2024, and 17% in 2025, and automotive and industrial system sales fell 24% in 2023 and 65% in 2024 before rebounding 45% in 2025. That combination means a small number of order deferrals can swing results sharply, so the risk is already embedded in the business model rather than hypothetical. The financial data is consistent with that pattern because the company’s results are exposed to abrupt demand changes, not a broad, stable customer base.
A third company-specific risk is supply chain dependence on Jabil in Malaysia and critical single-source parts. The filing says Cohu depends on Jabil to manufacture most semiconductor test systems and that 2025 supply constraints and delays in critical test-socket components, driven by governmental regulatory changes, could have adversely affected fiscal 2025 gross margin. That is not boilerplate because it names the manufacturing node and the component class, and it matters because a delay at one contract manufacturer can block shipments across the portfolio. The financial data already shows this is more than theoretical: supply interruptions would hit revenue recognition and margin conversion in the same quarter. I do not think these risks threaten the moat itself so much as they threaten how quickly the moat can translate into earnings; the installed base remains intact, but execution and supply discipline determine how much value it creates.
Management Discussion & Analysis
Management is signaling a capital-light, repair-and-reinvest posture: it launched a global restructuring program on February 19, 2025 to improve profitability while maintaining investment in product development, and that sequencing matters because the company is choosing margin repair without stepping back from R&D. The share repurchase of 432,288 shares for approximately $8.6M in fiscal 2025 was explicitly framed as offsetting dilution from share-based compensation, so I read it as maintenance buybacks rather than aggressive capital return. The bigger financing move was the issuance of $287.5M of 1.5% convertible senior notes due 2031, which pushes maturity risk out to January 15, 2031 and leaves liquidity comfortable, but it also adds leverage and does not reduce the absolute debt load. Management is leaning on AI demand to justify the next leg of growth, citing stronger demand for mobile and AI-based computing applications and growing demand for semiconductor testing and inspection used in AI data centers, yet fiscal 2025 gross margin still fell to 42.7% from 44.9% in fiscal 2024 and operating loss widened to 15.5% of sales, so the narrative of improving mix is only partly supported by the numbers. The acquisition of Tignis on January 7, 2025, a process-control and analytics software provider, and the $3.9M of incremental integration costs in fiscal 2025 show management is trying to add software content to the hardware base, which is strategically sensible, but Tignis was not material to fiscal 2025 sales, so investors should not expect it to change the earnings profile quickly. Management is responding to the risks above with restructuring, software investment, and a longer-dated capital structure, but the margin trend shows the response is still in progress rather than complete.
Management’s credibility is mixed rather than cleanly strong. In fiscal 2024, prior filings said gross margin had improved from favorable revenue mix and greater insourcing of contactor manufacturing, and fiscal 2025 did show gross margin at 42.7% versus 44.9% in fiscal 2024, which contradicts the idea that the margin trend was still improving; the current year instead points to product mix pressure and a one-time charge from ending manufacturing of certain products. Prior filings also emphasized continued debt reduction, and that was confirmed by the February 9, 2024 repayment of the remaining term loan principal, but the 2025 capital structure then shifted back toward borrowing with the $287.5M convertible notes, so the deleveraging message was only temporary. On tone, management stayed optimistic in 2023 and 2024 about long-term drivers, AI, and new products even as fiscal 2024 net sales fell 36.9% and fiscal 2025 still produced a net loss of $74.3M, which makes the narrative sound ahead of the actual earnings path. The team has delivered on debt repayment and cost actions, but repeated optimism about mix improvement and long-term demand has not yet translated into sustained profitability.
Recent Events
The most significant development I see here is the May 15, 2026 capital structure reset: Cohu increased authorized common shares from 90M to 150M and adopted a new 2026 Equity Incentive Plan plus an amended employee stock purchase plan. That combination strengthens financial flexibility for future equity issuance and employee retention, but it also raises dilution risk, so I view it as a mixed signal for shareholders rather than a pure positive.
The same filing also added an exclusive forum bylaw, with Delaware Chancery Court as the default venue for internal corporate claims and federal courts for Securities Act claims. In my view, that reduces litigation fragmentation and should lower governance noise, which modestly supports the investment case by making disputes more predictable.
The April 30, 2026 and February 12, 2026 8-Ks were routine earnings releases, so they do not change the thesis on their own. Taken together, the recent 8-Ks leave the operating case materially unchanged, while the share authorization and incentive actions tilt the capital allocation signal slightly toward dilution risk.
Financial Analysis
LF0 has published standalone analyses of these peers: Teradyne (TER) (rated Hold); Onto Innovation (ONTO) (rated Sell); Aehr Test Systems (AEHR) (rated Sell); FormFactor (FORM) (rated Hold).
Growth
COHU — Financial Growth (Quarterly, USD Mil)
| Metric | 2025-09-30 | 2025-12-31 | 2026-03-31 | 2026-06-30 | 2026-09-30 |
|---|---|---|---|---|---|
| REVENUE (USD Mil) | 126.2 | 122.2 | 125.1 | 149 | 173 |
| EBIT (USD Mil) | -7.7 | -12.2 | -7.4 | 3.6 | 16.1 |
| EBITDA (USD Mil) | 5.9 | -1.6 | 3 | 14 | 26.4 |
| NET INCOME (USD Mil) | -4.1 | -22.5 | -12.1 | -0.2 | 12.1 |
| DILUTED EPS | -0.1 | -0.5 | -0.3 | 0 | 0.2 |
Source: Yahoo Finance — Quarterly Financial Statements
Cohu’s revenue has re-accelerated over the last three reported quarters, from $125.1M in Q1 2026 to $149M in Q2 2026 and $173M in Q3 2026, after $122.2M in Q4 2025 and $126.2M in Q3 2025. That implies YoY growth of 37.1% in Q2 2026 and 37.0% in Q3 2026, versus 2.3% in Q1 2026, so the business moved from flat to sharply higher demand. EBITDA grew faster than revenue in Q2 2026 and Q3 2026, rising to $14M and $26.4M from $3M in Q1 2026, while net income turned positive at $12.1M in Q3 2026. The Q2 step-up looks like a real inflection, not a seasonal swing, and it is consistent with the installed-base and recurring-revenue model described above.
Growth versus peers
| Company | Revenue TTM (USD Mil) | Revenue Growth YoY % | EBITDA TTM (USD Mil) | Diluted EPS TTM |
|---|---|---|---|---|
| COHU | 569.3 | 37.0% | 31.8 | -0.5 |
| TER | 5,000.8 | 69.8% | 1,764.8 | 8.7 |
| ONTO | 1,311.7 | 87.8% | 394.2 | 3 |
| CAMT | 544.3 | 28.0% | 144.4 | 2.7 |
| AEHR | 50 | — | -11.3 | -0.2 |
| FORM | 980.1 | 38.4% | 251.9 | 2.2 |
Source: Yahoo Finance
Cohu’s revenue growth of 37.0% TTM is below TER at 69.8%, ONTO at 87.8%, and FORM at 38.4%, while CAMT is close at 28.0% and AEHR has no comparable growth figure in the table. That gap says Cohu is growing fast enough to matter, yet not fast enough to justify being priced like the highest-growth semiconductor test names, so the premium has to come from a recovery in earnings rather than from top-line leadership. I read the growth profile as solid but not category-leading.
Profitability
COHU — Profitability (TTM)
| Metric | TTM |
|---|---|
| Operating Margin (TTM) | -1.7% |
| Net Margin (TTM) | -4.0% |
| Return on Assets (TTM) | -0.5% |
| Return on Equity (TTM) | -2.8% |
| Gross Margin (TTM) | — |
| EBITDA Margin (TTM) | — |
Source: Yahoo Finance — Trailing Twelve Months (TTM)
TTM operating margin was -1.7%, TTM net margin was -4.0%, TTM ROA was -0.5%, and TTM ROE was -2.8%. Those negative returns tell me Cohu is still in an early, uneven profitability phase, where the business is not yet converting revenue into bottom-line earnings on a sustained basis. The gap between the -1.7% operating margin and the -4.0% net margin shows that below the operating line, interest, taxes, and other items are still pulling earnings further into the red, so I weight operating margin more heavily than net margin when judging progress. The company is not yet at a durable earnings inflection, and the margin profile still strains the moat thesis because the installed base is not yet translating into consistent profit. I would watch for operating margin moving into positive territory and net margin closing the gap toward it, because that would show the business is moving toward profitability rather than merely reducing losses.
Profitability versus peers
| Company | Operating Margin (TTM) | Net Margin (TTM) | Return on Assets (TTM) | Return on Equity (TTM) | Gross Margin (TTM) | EBITDA Margin (TTM) |
|---|---|---|---|---|---|---|
| COHU | -1.7% | -4.0% | -0.5% | -2.8% | — | — |
| TER | 32.5% | 27.5% | 21.6% | 42.7% | — | — |
| ONTO | 22.7% | 11.5% | 6.2% | 7.6% | — | — |
| CAMT | 24.2% | 24.6% | 6.2% | 20.1% | — | — |
| AEHR | -28.3% | -14.3% | -4.5% | -4.2% | — | — |
| FORM | 22.0% | 17.7% | 10.2% | 15.8% | — | — |
Source: Yahoo Finance
Cohu’s operating margin of -1.7%, net margin of -4.0%, ROA of -0.5%, and ROE of -2.8% trail TER at 32.5%, 27.5%, 21.6%, and 42.7%, ONTO at 22.7%, 11.5%, 6.2%, and 7.6%, and FORM at 22.0%, 17.7%, 10.2%, and 15.8%. Because the margin gap is visible in both operating and net results, this looks like a cost and scale problem rather than a one-line accounting issue, which means Cohu needs more volume before the peer multiple can be defended. The return profile is still negative, so the company has not yet proven to me that the installed base is producing peer-level economics.
Valuation
COHU — Valuation Multiples
| Metric | Value |
|---|---|
| Current Share Price (USD) | 43.2 |
| Market Cap (USD Mil) | 1,912 |
| Enterprise Value (USD Mil) | 1,736 |
| Trailing P/E | — |
| Forward P/E | 15.5 |
| Price/Sales (TTM) | 3.3 |
| Price/Book (mrq) | 2.4 |
| EV/Revenue | 3 |
| EV/EBITDA | 41.5 |
| Beta (5Y Monthly) | 1.61 |
| FCF Yield % (TTM) | — |
| Forward EPS (USD) | 2.4 |
| Analyst Target Price – Low (USD) | 62 |
| Analyst Target Price – Mean (USD) | 73 |
| Analyst Target Price – High (USD) | 90 |
| # Analyst Opinions | 8 |
Source: Yahoo Finance
Cohu trades at 3.0x EV/revenue and 3.3x price/sales on a current share price of 43.2, which implies the market is paying for a recovery in semiconductor test demand and a cleaner earnings mix rather than for current profitability. The earnings multiples are less useful here because trailing P/E is not quoted and the company is still carrying a negative TTM operating margin of -1.7% and net margin of -4.0%, so the valuation is being anchored by sales and cash generation instead. Forward P/E is 15.5x on forward EPS of 2.4, which means the stock is priced for a return to solid profitability, not just break-even. EV/EBITDA is 41.5x, a demanding multiple that only makes sense if EBITDA expands sharply from the current trough. Beta is 1.61, so the stock is still being valued as a cyclical name with above-market volatility.
The balance sheet adds context: book value per share is 16.7 and total cash per share is 10.73, so the stock trades at 2.42x book and about 4.0x cash-adjusted book value. FCF yield is not quoted, but the current valuation still looks rich relative to the current earnings base. Analyst targets run from 62 to 90, with a 73 mean across 8 opinions. On the analysis here, I would put fair value in a range of roughly $45-$65, which sits below the $73 consensus mean because I weight the still-negative margin profile and the 41.5x EV/EBITDA multiple more heavily than the market appears to. That range is still above the current share price, so I am not arguing that the stock is deeply cheap; I am arguing that the market is already discounting a recovery that has to show up in margins before the multiple can be justified. Forward EPS of 2.4 also looks reasonable versus peers on a like-for-like basis, but the stock’s current price implies a much cleaner earnings path than the company has yet delivered.
Valuation versus peers
| Company | Current Share Price (USD) | Trailing P/E | Forward P/E | EV/Revenue | EV/EBITDA | Price/Sales (TTM) | Price/Book (mrq) | Market Cap (USD Mil) | Enterprise Value (USD Mil) | Beta (5Y Monthly) | FCF Yield % (TTM) | Forward EPS | Analyst Target Price – Low | Analyst Target Price – Mean | Analyst Target Price – High | # Analyst Opinions |
|---|---|---|---|---|---|---|---|---|---|---|---|---|---|---|---|---|
| COHU | 43.2 | — | 15.5 | 3 | 41.5 | 3.3 | 2.4 | 1,912 | 1,736 | 1.61 | — | 2.4 | 62 | 73 | 90 | 8 |
| TER | 241.5 | 27 | 17.4 | 7.3 | 20.8 | 7.4 | 10 | 36,722 | 36,393 | 1.75 | — | 12 | 284 | 415.9 | 550 | 16 |
| ONTO | 204.9 | 66.1 | 17 | 7.7 | 31.5 | 7.6 | 5 | 9,867 | 10,089 | 1.68 | — | 12.9 | 240 | 329 | 450 | 12 |
| CAMT | 100.1 | 37 | 19.5 | 8.2 | 86.5 | 9.3 | 6.1 | 4,599 | 4,481 | 1.73 | — | 5.1 | 120 | 150.7 | 200 | 11 |
| AEHR | 51.7 | — | 66.2 | 30.7 | — | 30.5 | 7.3 | 1,630 | 1,535 | 3.33 | — | 1.7 | 90 | 117 | 140 | 5 |
| FORM | 84.8 | 38.1 | 19.8 | 6.3 | 24.9 | 6.7 | 5.5 | 6,501 | 6,134 | 1.28 | — | 4.3 | 102 | 144.7 | 200 | 10 |
Source: Yahoo Finance
Cohu trades at 3.0x EV/revenue and 3.3x price/sales, versus TER at 7.3x and 7.4x, ONTO at 7.7x and 7.6x, CAMT at 8.2x and 9.3x, and FORM at 6.3x and 6.7x, while its 15.5x forward P/E is below TER at 17.4x, ONTO at 17.0x, CAMT at 19.5x, and FORM at 19.8x. The catch is that Cohu’s forward EPS is only 2.4, far below TER at $12 and ONTO at $12.9, so the lower multiple is partly a reflection of a much smaller earnings base; even so, the market is already paying for a recovery because the stock at 43.2 sits well above the peer-implied range from EV/revenue, which is roughly $18-$45 after applying the peer band to Cohu’s $569.3M of revenue and netting its $335.9M of debt and $508M of cash. I read that as a valuation that is not cheap enough for a business still carrying negative TTM diluted EPS of -$0.5, and the peer comparison reinforces that the market is valuing a recovery before the earnings base has fully turned.
Leverage
COHU — Leverage & Coverage (Quarterly)
| Metric | Value |
|---|---|
| Total Debt/Equity % (mrq) | 42.5 |
| Current Ratio (mrq) | 5.2 |
| Total Debt (mrq, USD Mil) | 335.9 |
| Operating Cash Flow (TTM, USD Mil) | 66.2 |
| Levered Free Cash Flow (TTM, USD Mil) | 75 |
| Net Debt/EBITDA (TTM) | — |
| FCF Margin % (TTM) | — |
Source: Yahoo Finance — Quarterly Financial Statements
Cohu’s leverage profile is mixed but still manageable. Total debt/equity was 42.47% (mrq), current ratio was 5.155x (mrq), and total debt was $335.9M (mrq), which gives the company a solid near-term liquidity cushion and room to absorb a softer demand patch. Operating cash flow was $66.19M and levered free cash flow was $74.96M, so cash generation is covering the balance sheet without strain. I focus on the reported liquidity and debt figures because they show the company can fund operations without immediate financing pressure, even if the earnings base is still weak. In my opinion, this is low to medium refinancing risk because the current ratio is strong and debt is moderate, but the business is still cyclical and a prolonged downturn would matter if cash flow weakens before the next refinancing window. The balance sheet is a neutral to mildly positive signal: it supports flexibility today, but it is not a clear competitive advantage.
Leverage versus peers
| Company | Total Debt/Equity % (mrq) | Current Ratio (mrq) | Total Debt (mrq, USD Mil) | Operating Cash Flow TTM (USD Mil) | Free Cash Flow TTM (USD Mil) | Net Debt/EBITDA (TTM) | FCF Margin % (TTM) |
|---|---|---|---|---|---|---|---|
| COHU | 42.5 | 5.2 | 335.9 | 66.2 | 75 | — | — |
| TER | 3.7 | 2.1 | 137.1 | 1,329.5 | 601 | — | — |
| ONTO | 74.4 | 6.8 | 1,473.2 | 261.6 | 163.6 | — | — |
| CAMT | 64.8 | 5.9 | 489.2 | — | — | — | — |
| AEHR | 4.4 | 10.3 | 9.8 | -3.3 | -2 | — | — |
| FORM | 2.4 | 3.7 | 27.8 | 257 | 160.9 | — | — |
Source: Yahoo Finance
Cohu’s debt/equity of 42.47% is higher than TER at 3.7% and FORM at 2.4%, but lower than ONTO at 74.4%, and its current ratio of 5.155 is solid versus TER at 2.1 and FORM at 3.7. The more telling comparison is cash per share, where Cohu has 10.73 versus TER at $3.0 and ONTO at $25.5, so the balance sheet is not strained even though the debt ratio is not pristine; that cash cushion helps explain why the equity can absorb a weak earnings base without immediate financing risk. Relative to peers, the leverage profile is not the reason the stock trades at a discount; the discount is really about profitability.
Insider Activity
The insider transaction record I see here is one-sided: 18 open-market sales and 0 open-market purchases from 2025-01-10 to 2026-05-22, so insiders are net sellers. The pattern is broad, not just one person, because the CEO, CFO, and multiple directors all sold in the latest window, which weakens the alignment signal for outside shareholders. This is a bear signal because the selling is clustered across senior insiders with no offsetting open-market buying.
Conclusion
I would put my rating as a Hold because Cohu’s revenue has re-accelerated to $173M in Q3 2026, but the business still posted a TTM operating margin of -1.7% and net margin of -4.0%, so the stock is pricing a recovery before the earnings base has fully turned. The strongest point is the shift toward recurring revenue, which reached 60% of fiscal 2025 net sales from 49% in 2023, and that mix change makes the model less cyclical and more investable. The biggest risk is still the earnings gap: EV/EBITDA is 41.5x and forward EPS is only 2.4, so investors are paying for a sharp profit rebound that has not yet shown up in the TTM numbers.
I would raise my rating more toward a Buy if operating margin stays positive for two straight quarters, because that would show the revenue recovery is finally converting into durable profit. If revenue stays above $150M per quarter, roughly the Q2 2026 to Q3 2026 run rate, and EBITDA holds above $20M per quarter, that would imply the current recovery is not a one-quarter spike but a base that can support a lower earnings multiple. On the other side, if quarterly revenue slips back below $130M, roughly the Q1 2026 level, while operating margin turns negative again, then the market is left with a 15.5x forward P/E on 2.4 of forward EPS and a 41.5x EV/EBITDA multiple that still depends on a sharp earnings rebound that has not yet been proven.
Weighing both paths, I lean to the cautious side because the bull case needs margin repair to arrive quickly, while the bear case only needs the current growth burst to normalize. The installed base and recurring mix keep this from being a Sell, but until profitability turns with the revenue, I think the market is still paying ahead of the fundamentals.
What to Watch Next
- Operating margin positive for two straight quarters — would support raising the rating toward Buy.
- Quarterly revenue above $150M — would confirm the current demand run rate is holding.
- EBITDA above $20M per quarter — would show the recovery is becoming durable.
- Quarterly revenue below $130M — would weaken the recovery case and pressure the multiple.
- Operating margin turning negative again — would argue the earnings rebound has stalled.
What’s your take? I rated Cohu (COHU) HOLD above — but the goal here is to get this right, not just to publish an opinion. What would you add to this analysis, or which risk or catalyst do you think I’m under- or over-weighting? Tell me in the comments.
Our track record: every directional call is tracked publicly on The Scorecard, and Stocks Covered lists every company we have rated and when.
Sources
- SEC 10-K Annual Report — filed 2026-02-17
- SEC 8-K Filing (2026-05-15)
- SEC 8-K Filing (2026-04-30)
- SEC 8-K Filing (2026-02-12)
- SEC Form 4 Insider Transaction (2026-05-26)
- SEC Form 4 Insider Transaction (2026-05-26)
- SEC Form 4 Insider Transaction (2026-05-26)
- SEC 10-K Annual Report — FY2026
- SEC 10-K Annual Report — FY2025
- SEC 10-K Annual Report — FY2024
- SEC 10-K Annual Report — FY2023
- SEC 10-K Annual Report — FY2022
Data sourced from Yahoo Finance and SEC EDGAR. Not investment advice.
Get daily options strategies built on our research
Sign up and get access to our private Discord and Telegram options channels, updated daily. Every play is built on our equity research and the rating we give the company.
Educational content only, not investment advice. Hypothetical results, not a guarantee of future performance.
Our options track record so far: +33% in 4 weeks, hypothetical and unrealised. See the track record.
Leave a Comment