Expected price range
Each range is set from the stock’s recent price history and our Hold rating, using its own 1-year realised volatility (59% annualised) as the width of a ~68% statistical band, and checked against that rating so the range leans the same way as our view. Starting price $81.64 (close 2026-11-18). The stock traded between $53.60 and $107 over the last 6 months and between $43.30 and $107 over the last year. This is an illustration of where our view and normal volatility point, not a forecast, price target or investment advice; the stock can move outside it.
| Company | Nov 25 | Dec 25 | Jan 26 | Feb 26 | Mar 26 | Apr 26 | May 26 | Jun 26 | Jul 26 | Aug 26 | Sep 26 | Oct 26 | 12-Mo |
|---|---|---|---|---|---|---|---|---|---|---|---|---|---|
| ESTC | -21% | +7% | -13% | -21% | -4% | -7% | +39% | -12% | +15% | +48% | -6% | +6% | +9% |
| DDOG | -2% | -15% | -5% | -13% | +5% | +12% | +87% | +5% | +3% | -12% | +16% | -14% | +45% |
| PANW | -14% | -3% | -4% | -16% | +8% | +12% | +57% | +21% | -3% | +15% | +4% | -8% | +66% |
| S | -9% | -7% | -7% | -6% | -2% | +10% | +17% | +3% | +12% | +16% | +8% | +6% | +41% |
| CHKP | -5% | -1% | -3% | -15% | -6% | -21% | +20% | -3% | -3% | +9% | -8% | +19% | -22% |
| ORCL | -23% | -3% | -15% | -12% | +1% | +10% | +40% | -35% | -11% | +15% | -8% | -4% | -50% |
Source: Yahoo Finance monthly adjusted close.
Quick Thesis
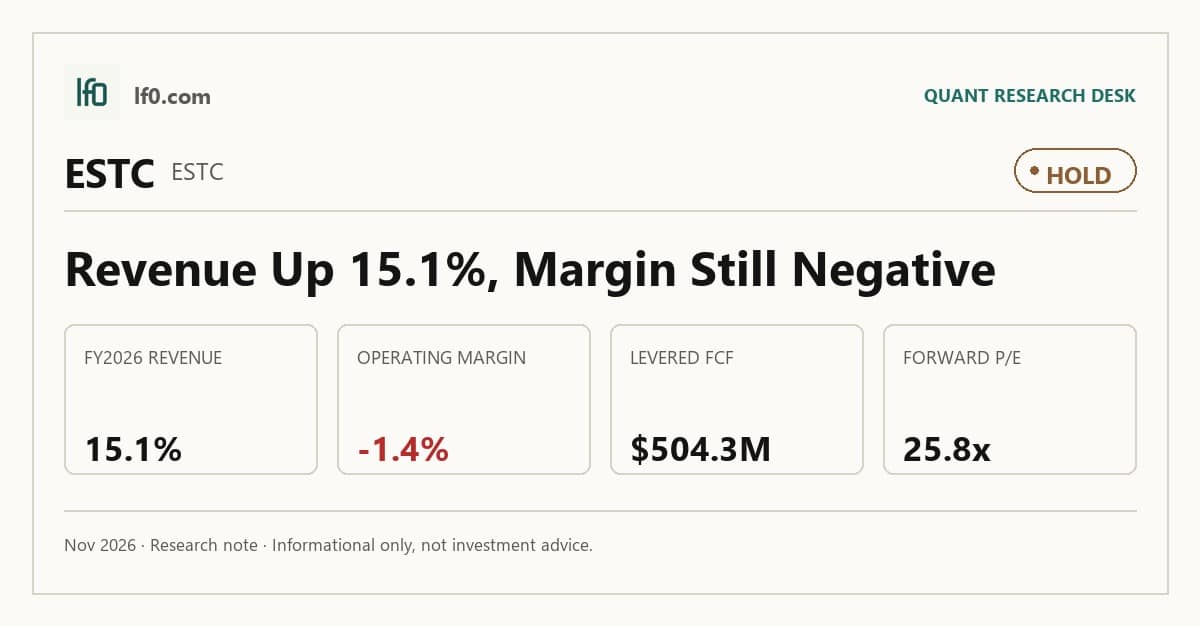
- Rated Hold — revenue growth is real, but operating margin is still negative.
- Strongest financial point: levered free cash flow was 504.3M TTM.
- Main risk: operating margin was -1.4% TTM while insider selling was one-sided.
- Valuation is fair to slightly rich at 4.6x EV/revenue and 25.8x forward P/E.
- I would turn more constructive if operating margin turns positive for two straight quarters.
Executive Summary
We’ll begin tracking this call’s performance since publication once sufficient adjusted-close data is available.
I would put my rating as a Hold because Elastic is still growing revenue, but the core operating line remains negative, so the market is already paying for a profitability path that has not yet fully shown up. The balance sheet helps, with $1.5B of cash against $595.8M of debt in mrq, but that cushion supports patience rather than an outright Buy at 4.6x EV/revenue and 25.8x forward P/E.
I would raise my rating more towards a Buy if Elastic can keep revenue growth above 15% while moving to a positive operating margin for two straight quarters, because that would show the current revenue base is finally converting into durable operating profit rather than just headline scale. On the current revenue run rate of $1.8B, a 3-point margin improvement from -1.4% to 1.6% would add roughly $54M of annual operating profit, which would materially improve the earnings bridge and make the present multiple easier to justify.
Company Profile
Elastic N.V. develops the Elasticsearch Platform, which combines search, analytics, vector database, and machine learning functions to turn large data sets into search, observability, and security applications. It earns revenue mainly from subscriptions, with 94% of FY2026 revenue from paid services and self-managed software, and it sells through Elastic Cloud Hosted, Elastic Cloud Serverless, and Elastic Self-Managed deployments.
The company was founded in 2012 and went public in 2018, and it keeps a single code base across open source and proprietary offerings. Elastic serves more than 24,000 customers across over 55 public cloud regions on AWS, Google Cloud Platform, and Microsoft Azure, with 46% of FY2026 revenue from outside the United States. It is headquartered in Amsterdam, employs 4,019 people in over 40 countries, and is listed on the New York Stock Exchange under ESTC.
Economic Moat
Business Model
Elastic’s most defensible advantage is the combination of a common code base and an open development model, because it lets the company ship one platform across Elastic Cloud Hosted, Elastic Cloud Serverless, and Elastic Self Managed without splitting the product into a free version and a separate enterprise version. In my view, that is hard for a well funded competitor to copy within 3 years because the 2026 10-K ties the platform to public repositories, a single code base, and a community that feeds product feedback directly into development, while the company also runs the world’s most downloaded open source vector database and serves more than 55 public cloud regions globally.
The practical result is that customers can start free, expand into paid resource based subscriptions, and move across Search & AI, Elastic Observability, and Elastic Security without changing platforms. That supports expansion inside existing accounts rather than one off deployments, which is the kind of operating leverage I want to see in a software moat.
Secondary moat elements are narrower but still useful. Elasticsearch sits at the core as a distributed, real time vector database and analytics engine, and the filing highlights active patents with expirations ranging from 2030 to 2044, which gives some protection around the platform even though open source licensing limits how much exclusivity that IP can create. Elastic also benefits from a broad deployment footprint across AWS, Google Cloud Platform, and Microsoft Azure, plus hybrid and multi cloud support, so customers are not locked into one infrastructure choice.
Business & Operating Risks
The most material disclosed risk is slower customer consumption and longer, less predictable sales cycles, because that is already showing up in the numbers. According to the risk factors in their SEC 10-K, Elastic Cloud contributed 48% of total revenue in FY2026, while the company also warns that consumption can slow when customers optimize usage and that sales cycles can extend to more than a year for some customers. That is not just boilerplate: subscription revenue still made up 94% of FY2026 revenue, so any delay in new or renewed subscriptions can roll through the income statement with a lag and pressure future quarters rather than the current one.
Competition is the second risk that matters, especially from larger platform vendors and cloud partners that can bundle similar functionality. The 10-K names Amazon Web Services as a direct example of a third party offering forked versions of Elastic technology, and it also says competitors may adopt more aggressive pricing policies and respond faster to AI-related changes. That is material because Elastic Cloud is now 48% of FY2026 revenue, so any pricing pressure or partner conflict can hit the highest-growth part of the mix first.
AI-related execution risk is the newest and most company-specific addition to the risk stack. In prior filings, the emphasis was on growth, cloud adoption, and macro demand; in the current 10-K, Elastic adds detailed language on generative and agentic AI, third-party model behavior changing without advance notice, and the possibility that developer workflows shift toward AI tools that reduce preference for its platform. The filing also says those investments may not produce meaningful revenue for several years, if at all, which means the company is taking on near-term cost before the payoff is proven.
Earlier filings were more focused on COVID-19 and the Ukraine-linked macro shock, both of which were prominent in 2021 to 2023 and are absent as standalone headline risks now. That removal matters because it shows the risk profile has shifted away from pandemic disruption and toward structural issues in consumption, competition, and AI. The current filing also keeps the standard boilerplate on cybersecurity, regulation, and key-person risk, but those are background risks for a software company rather than the main bear points here.
The disclosed risks pressure the moat, but they do not break it. In my view, they test Elastic’s ability to monetize the platform advantage rather than threatening the single-code-base model itself.
Management Discussion & Analysis
Management is signalling that capital allocation is now tilted toward shareholder returns and product investment rather than balance-sheet repair. The board authorized a $500M share repurchase program in October 2025, and Elastic repurchased 4.4 million ordinary shares for $340M at a weighted-average price of $76.91 per share in FY2026. That tells me management sees the stock as attractive enough to buy back aggressively, but it also means cash is being returned while the company still carries $595.8M of debt, so this is not a deleveraging signal.
The operating plan is still expansionary, with research and development expense rising to $451.9M in FY2026 from $365.8M in FY2025 and sales and marketing rising to $710.2M from $617.2M. That supports the growth narrative, but it also keeps the burden on execution high because spending is rising faster than operating profit. Management is also leaning into Elastic Cloud and AI features, including investments in context engineering, AI models, and agentic workflows, while the addition of AGPL in November 2024 was meant to widen adoption in vector search and AI use cases; the numbers partly back that up because subscription revenue grew 18.0% in FY2026 and Elastic Cloud revenue grew 22.0%, but services gross margin fell to -1.0% from 2.0%, which shows the mix shift is still dilutive near term.
The release of valuation allowances in the Netherlands, the United Kingdom, and California for $390.5M, $23.7M, and $20.7M in FY2026 is a tax benefit, not an operating improvement, so investors should not read the $367.8M net income as a clean step-up in core earnings power. Management has delivered on revenue growth and customer expansion, but the operating story has lagged the strategic tone, and the FY2026 profit swing was driven more by tax items than by durable margin improvement.
Recent Events
No material corporate events since the most recent 10-K stand out beyond routine quarterly earnings updates. That leaves the buyback authorization and the ongoing AI/product push as the main post-filing developments to watch, because they are the clearest signals of how management is trying to defend the moat while growth normalizes.
Financial Analysis
LF0 has published standalone analyses of these peers: Datadog (DDOG) (rated Hold).
Growth
ESTC — Financial Growth (Quarterly, USD Mil)
| Metric | 2025-07-31 | 2025-10-31 | 2026-01-31 | 2026-04-30 | 2026-07-31 |
|---|---|---|---|---|---|
| REVENUE (USD Mil) | 415.3 | 423.5 | 449.9 | 450.7 | 478.1 |
| EBIT (USD Mil) | 6.3 | 7.6 | 12.4 | -3.5 | -11 |
| EBITDA (USD Mil) | 8.7 | 10.5 | 15.8 | -0.3 | -7.6 |
| NET INCOME (USD Mil) | -24.6 | -51.3 | 7.8 | 435.9 | -16.7 |
| DILUTED EPS | -0.2 | -0.5 | 0.1 | 4.1 | -0.2 |
Source: Yahoo Finance — Quarterly Financial Statements
Revenue rose from $415.3M in 2025-07-31 to $478.1M in 2026-07-31, but the path was uneven: $423.5M in 2025-10-31, $449.9M in 2026-01-31, and $450.7M in 2026-04-30 show a slower middle stretch before the latest step up. EBITDA moved faster than revenue early, from $8.7M to $15.8M, but then turned negative at -$0.3M in 2026-04-30 and -$7.6M in 2026-07-31, so earnings are now lagging sales.
The sharp net income spike to $435.9M in 2026-04-30 looks like a one-off swing, not a durable operating inflection. I read the growth data as constructive on demand, but not yet strong enough to prove that the platform is converting scale into steady earnings.
Growth versus peers
| Company | Revenue TTM (USD Mil) | Revenue Growth YoY % | EBITDA TTM (USD Mil) | Diluted EPS TTM |
|---|---|---|---|---|
| ESTC | 1,802.2 | 15.1% | -22.3 | 3.5 |
| DDOG | 4,278.2 | 35.2% | 170.3 | 0.7 |
| PANW | 11,480 | 34.5% | 1,560 | 0.4 |
| S | 1,098.7 | 20.6% | -237.8 | -1 |
| CHKP | 2,756.7 | -1.1% | 816.1 | 8.3 |
| ORCL | 71,776 | 29.6% | 34,433 | 6.4 |
Source: Yahoo Finance
Elastic’s revenue grew 15.1% TTM to $1.8B, which is well below DDOG’s 35.2% on $4.3B and PANW’s 34.5% on $11.5B, but above CHKP’s -1.1% on $2.8B and in line with S’s 20.6% on $1.1B. That mix says ESTC is not the fastest grower, yet it is still growing faster than the mature security names, so the growth discount looks real but not punitive.
Profitability
ESTC — Profitability (TTM)
| Metric | TTM |
|---|---|
| Operating Margin (TTM) | -1.4% |
| Net Margin (TTM) | 20.8% |
| Return on Assets (TTM) | -0.6% |
| Return on Equity (TTM) | 33.1% |
| Gross Margin (TTM) | — |
| EBITDA Margin (TTM) | — |
Source: Yahoo Finance — Trailing Twelve Months (TTM)
TTM operating margin was -1.4%, TTM net margin was 20.8%, TTM return on assets was -0.6%, and TTM return on equity was 33.1%. The negative operating margin and negative ROA show Elastic is still not consistently profitable at the operating level, so I weight the operating line more heavily than the headline net margin because the latter is flattered by items below operating profit.
The 21.2-point gap between operating margin and net margin points to a business that can still swing sharply with non-operating items, which is typical of a software company still in the scaling phase rather than a mature cash compounder. ROE far above ROA also implies returns are being amplified by leverage and financial structure rather than pure asset productivity, so that 33.1% figure is less durable than it looks. I would watch for operating margin turning positive and staying there, because that would be the clearest sign the business is moving toward durable profitability.
Profitability versus peers
| Company | Operating Margin (TTM) | Net Margin (TTM) | Return on Assets (TTM) | Return on Equity (TTM) | Gross Margin (TTM) | EBITDA Margin (TTM) |
|---|---|---|---|---|---|---|
| ESTC | -1.4% | 20.8% | -0.6% | 33.1% | — | — |
| DDOG | 2.4% | 6.1% | 0.9% | 6.4% | — | — |
| PANW | 7.0% | 2.7% | 1.4% | 1.7% | — | — |
| S | -26.0% | -31.0% | -7.6% | -23.0% | — | — |
| CHKP | 28.3% | 31.7% | 7.4% | 30.6% | — | — |
| ORCL | 34.3% | 26.4% | 6.4% | 41.2% | — | — |
Source: Yahoo Finance
Elastic’s operating margin is -1.4%, below DDOG’s 2.4%, PANW’s 7.0%, S’s -26.0%, CHKP’s 28.3%, and ORCL’s 34.3%, while net margin is 20.8%, ahead of DDOG’s 6.1% and PANW’s 2.7% but behind CHKP’s 31.7% and ORCL’s 26.4%. The gap between a negative operating margin and a positive net margin points to non-operating items rather than core cost discipline, so the issue looks more like earnings quality and scale than a structurally weak gross model.
Valuation
ESTC — Valuation Multiples
| Metric | Value |
|---|---|
| Current Share Price (USD) | 82.1 |
| Market Cap (USD Mil) | 8,520 |
| Enterprise Value (USD Mil) | 7,654 |
| Trailing P/E | 24.5 |
| Forward P/E | 25.8 |
| Price/Sales (TTM) | 5.1 |
| Price/Book (mrq) | 7 |
| EV/Revenue | 4.6 |
| EV/EBITDA | — |
| Beta (5Y Monthly) | 0.96 |
| FCF Yield % (TTM) | — |
| Forward EPS (USD) | 4 |
| Analyst Target Price – Low (USD) | 75 |
| Analyst Target Price – Mean (USD) | 111.4 |
| Analyst Target Price – High (USD) | 132 |
| # Analyst Opinions | 26 |
Source: Yahoo Finance
Elastic is priced as a profitable software platform, not as a distressed one. The current share price is $82.1, and the stock trades at 4.6x enterprise value to revenue, 5.1x price to sales, 24.5x trailing P/E, and 25.8x forward P/E. That mix says the market is paying for continued earnings normalization and durable subscription demand, not for a rapid reacceleration.
The rest of the tape is consistent with that read. Beta is 0.96, so the shares are moving about in line with the market. Book value per share is $12.3, which means investors are paying about 6.7x book for a software asset base that is mostly intangible. Total cash per share is $13.9, so the stock still carries a meaningful cash cushion relative to the current quote.
With 26 analyst opinions, the consensus target range of $75.0 to $132.0 and mean of $111.4 frames the stock as fairly valued to modestly cheap, but my own range sits closer to the lower half of that band because I give more weight to the negative operating margin and the fact that free cash flow is still being supported by a business model that has not yet proven a clean operating inflection. On the analysis here, I would put fair value in a range of roughly $75-$110, which sits below the consensus mean but inside the published analyst range. Forward EPS of 4.0 implies about 20.5x forward earnings at the current price, which is not cheap for a company still working through margin repair; by comparison, the peer set shows that higher-quality earnings streams can command richer multiples, but Elastic’s own earnings trajectory is not yet as clean as those names.
Valuation versus peers
| Company | Current Share Price (USD) | Trailing P/E | Forward P/E | EV/Revenue | EV/EBITDA | Price/Sales (TTM) | Price/Book (mrq) | Market Cap (USD Mil) | Enterprise Value (USD Mil) | Beta (5Y Monthly) | FCF Yield % (TTM) | Forward EPS | Analyst Target Price – Low | Analyst Target Price – Mean | Analyst Target Price – High | # Analyst Opinions |
|---|---|---|---|---|---|---|---|---|---|---|---|---|---|---|---|---|
| ESTC | 82.1 | 24.5 | 25.8 | 4.6 | — | 5.1 | 7 | 8,520 | 7,654 | 0.96 | — | 4 | 75 | 111.4 | 132 | 26 |
| DDOG | 167.7 | 229.4 | 52.4 | 13 | 147.7 | 14.3 | 12.6 | 59,637 | 55,711 | 1.51 | — | 3.2 | 171 | 269.7 | 330 | 48 |
| PANW | 329.5 | 790.2 | 75.8 | 22.5 | 185.6 | 21 | 9.4 | 258,806 | 258,235 | 0.97 | — | 4.9 | 190 | 398.6 | 525 | 51 |
| S | 22.9 | — | 46.7 | 6.4 | — | 6.7 | 5.3 | 7,640 | 7,026 | 0.56 | — | 0.5 | 17.5 | 24.9 | 31 | 30 |
| CHKP | 155.3 | 17.9 | 13.2 | 5.4 | 15.4 | 5.7 | 5.7 | 15,151 | 14,973 | 0.42 | — | 11 | 130 | 153.1 | 192 | 31 |
| ORCL | 114.6 | 18 | 14.1 | 6.7 | 12.8 | 4.7 | 5.8 | 358,536 | 482,344 | 1.78 | — | 11.1 | 110 | 236.2 | 400 | 40 |
Source: Yahoo Finance
Elastic trades at 4.6x EV/revenue and 5.1x price/sales, versus DDOG at 13.0x and 14.3x, PANW at 22.5x and 21.0x, S at 6.4x and 6.7x, and CHKP at 5.4x and 5.7x. On a peer-multiple range, ESTC’s $1.8B of revenue implies an enterprise value of $8.2B to $40.6B and an illustrative equity value of about $72.4 to $454.8 per share after netting $865M of net cash and dividing by 106.0M shares, which brackets the $82.1 share price but also shows the market is already paying for more than just average software growth.
I would not call that a deep discount. The multiple is below the fastest growers, but it is not obviously cheap versus CHKP or S once cash and growth are both considered, and the market is not giving Elastic a growth premium for a margin profile that is still under repair.
Leverage
ESTC — Leverage & Coverage (Quarterly)
| Metric | Value |
|---|---|
| Total Debt/Equity % (mrq) | 45.9 |
| Current Ratio (mrq) | 1.8 |
| Total Debt (mrq, USD Mil) | 595.8 |
| Operating Cash Flow (TTM, USD Mil) | 354.1 |
| Levered Free Cash Flow (TTM, USD Mil) | 504.3 |
| Net Debt/EBITDA (TTM) | — |
| FCF Margin % (TTM) | — |
Source: Yahoo Finance — Quarterly Financial Statements
Elastic’s leverage profile is manageable, but it is not a balance sheet advantage. Total Debt/Equity was 45.9% in mrq, Current Ratio was 1.8x, and Total Debt was $595.8M, which gives the company enough liquidity to absorb a near-term slowdown without immediate refinancing pressure.
Total Cash was $1.5B in mrq and Total Cash Per Share was $13.9, so the debt load is more than covered by cash on hand, not just by operating earnings. Operating Cash Flow was $354.1M in TTM and Levered Free Cash Flow was $504.3M in TTM, which tells me the business is still converting earnings into cash well enough to fund operations and preserve flexibility. In my opinion, refinancing risk is low because cash exceeds debt and the current ratio is above 1.0x, but the leverage picture would become more relevant if cash burn reappears or if debt has to be refinanced into a materially higher rate environment.
Leverage versus peers
| Company | Total Debt/Equity % (mrq) | Current Ratio (mrq) | Total Debt (mrq, USD Mil) | Operating Cash Flow TTM (USD Mil) | Free Cash Flow TTM (USD Mil) | Net Debt/EBITDA (TTM) | FCF Margin % (TTM) |
|---|---|---|---|---|---|---|---|
| ESTC | 45.9 | 1.8 | 595.8 | 354.1 | 504.3 | — | — |
| DDOG | 27.7 | 3.5 | 1,307.2 | 1,267.5 | 1,066.5 | — | — |
| PANW | 9.3 | 0.9 | 2,567 | 4,553 | 4,240.6 | — | — |
| S | — | 1.4 | 0 | 57.3 | 296.9 | — | — |
| CHKP | 74.9 | 1.6 | 1,976.3 | 1,156.6 | 716.4 | — | — |
| ORCL | 251.7 | 1.2 | 169,143 | 46,940 | -45,853.6 | — | — |
Source: Yahoo Finance
Elastic carries 45.9% debt to equity against DDOG’s 27.7%, PANW’s 9.3%, and ORCL’s 251.7%, while its $1.5B of cash versus $595.8M of debt leaves a net cash position that is cleaner than CHKP’s $2B debt load and far safer than ORCL’s negative free cash flow of $45.9B TTM. Free cash flow of $504.3M TTM, or about $4.8 per share, is also stronger than DDOG’s $3.2 per share and CHKP’s $7.0 per share on a per-share basis, which means Elastic is funding itself without balance-sheet strain even if it is not yet a cash machine on CHKP’s level.
The leverage gap helps explain part of the valuation gap. Investors are paying up for balance-sheet safety and cash generation quality at CHKP and ORCL, while Elastic sits in the middle: better funded than many growth names, but not yet strong enough on operating margin to deserve a premium multiple.
Insider Activity
The insider transaction record I see here is one-sided: 27 open-market sales, $27.5M of selling, and no open-market purchases in the 2025-03-02 to 2026-03-09 window. The activity is broad rather than isolated, with multiple executives selling on 2026-03-09, so alignment looks weak at the margin even though the sample is limited to 16 filings.
That does not change the core thesis by itself, but it does matter because the stock is already pricing in a cleaner earnings path. I would rather see at least some insider buying before reading the current valuation as fully supported.
Conclusion
I would put my rating as a Hold because Elastic has enough scale and cash to keep compounding, but the operating margin is still negative and the market is already paying for a cleaner earnings path than the company has yet delivered. The strongest support for the stock is the $504.3M of levered free cash flow and the $1.5B cash balance, which give management room to keep investing and buying back stock without stressing the balance sheet.
The key question is whether the current revenue base can turn into durable operating profit before growth slows. I would raise my rating more towards a Buy if revenue growth stays above 15% and operating margin turns positive for two straight quarters, because that would show the platform is finally converting scale into earnings rather than relying on tax items and buybacks to bridge the gap. I would move from Hold to Sell if revenue growth falls below 10% for two consecutive quarters or if operating margin stays negative while sales and marketing spending remains elevated, because that would mean the stock is still priced for a recovery that is not arriving fast enough.
My final stance is that the bull case is plausible, but it is not yet proven in the operating line. I would wait for a positive operating margin before moving more constructive, and I would want to see that improvement hold long enough to show it is not just a quarter of noise.
What to Watch Next
- Revenue growth above 15% — would support a move toward Buy.
- Operating margin turning positive for two straight quarters — would confirm durable earnings conversion.
- Sales and marketing spending staying elevated while growth slows — would support a move toward Sell.
- Levered free cash flow staying above $500M — would reinforce the balance-sheet cushion.
- Insider buying, not just selling — would improve alignment with the thesis.
What’s your take? I rated Elastic (ESTC) HOLD above — but the goal here is to get this right, not just to publish an opinion. What would you add to this analysis, or which risk or catalyst do you think I’m under- or over-weighting? Tell me in the comments.
Our track record: every directional call is tracked publicly on The Scorecard, and Stocks Covered lists every company we have rated and when.
Sources
- SEC 10-K Annual Report — filed 2026-06-08
- SEC 8-K Filing (2026-05-28)
- SEC 8-K Filing (2026-02-26)
- SEC Form 4 Insider Transaction (2026-03-10)
- SEC Form 4 Insider Transaction (2026-03-10)
- SEC Form 4 Insider Transaction (2026-03-10)
- SEC 10-K Annual Report — FY2026
- SEC 10-K Annual Report — FY2024
- SEC 10-K Annual Report — FY2023
- SEC 10-K Annual Report — FY2022
- SEC 10-K Annual Report — FY2021
Data sourced from Yahoo Finance and SEC EDGAR. Not investment advice.
Leave a Comment