Expected price range
Each range is set from the stock’s recent price history and our Hold rating, using its own 1-year realised volatility (41% annualised) as the width of a ~68% statistical band, and checked against that rating so the range leans the same way as our view. Starting price $83.79 (close 2026-11-16). The stock traded between $73.53 and $94.95 over the last 6 months and between $73.53 and $133 over the last year. This is an illustration of where our view and normal volatility point, not a forecast, price target or investment advice; the stock can move outside it.
| Company | Nov 25 | Dec 25 | Jan 26 | Feb 26 | Mar 26 | Apr 26 | May 26 | Jun 26 | Jul 26 | Aug 26 | Sep 26 | Oct 26 | 12-Mo |
|---|---|---|---|---|---|---|---|---|---|---|---|---|---|
| LEN | +6% | -22% | +6% | +5% | -24% | +5% | -1% | +1% | -8% | +2% | -3% | +7% | -28% |
| DHI | +7% | -9% | +3% | +8% | -14% | +12% | -4% | +11% | -12% | +1% | -5% | +7% | -1% |
| TOL | +4% | -3% | +7% | +9% | -13% | +4% | -3% | +19% | -11% | -2% | -6% | +9% | +9% |
| PHM | +6% | -8% | +7% | +10% | -14% | +4% | -3% | +16% | -8% | -0% | -8% | +7% | +5% |
| NVR | +4% | -3% | +5% | -2% | -12% | -4% | -3% | +12% | -10% | +3% | -3% | -3% | -17% |
| KBH | +3% | -12% | +2% | +11% | -19% | +2% | -7% | +28% | -12% | -3% | -13% | +3% | -22% |
Source: Yahoo Finance monthly adjusted close.
Quick Thesis
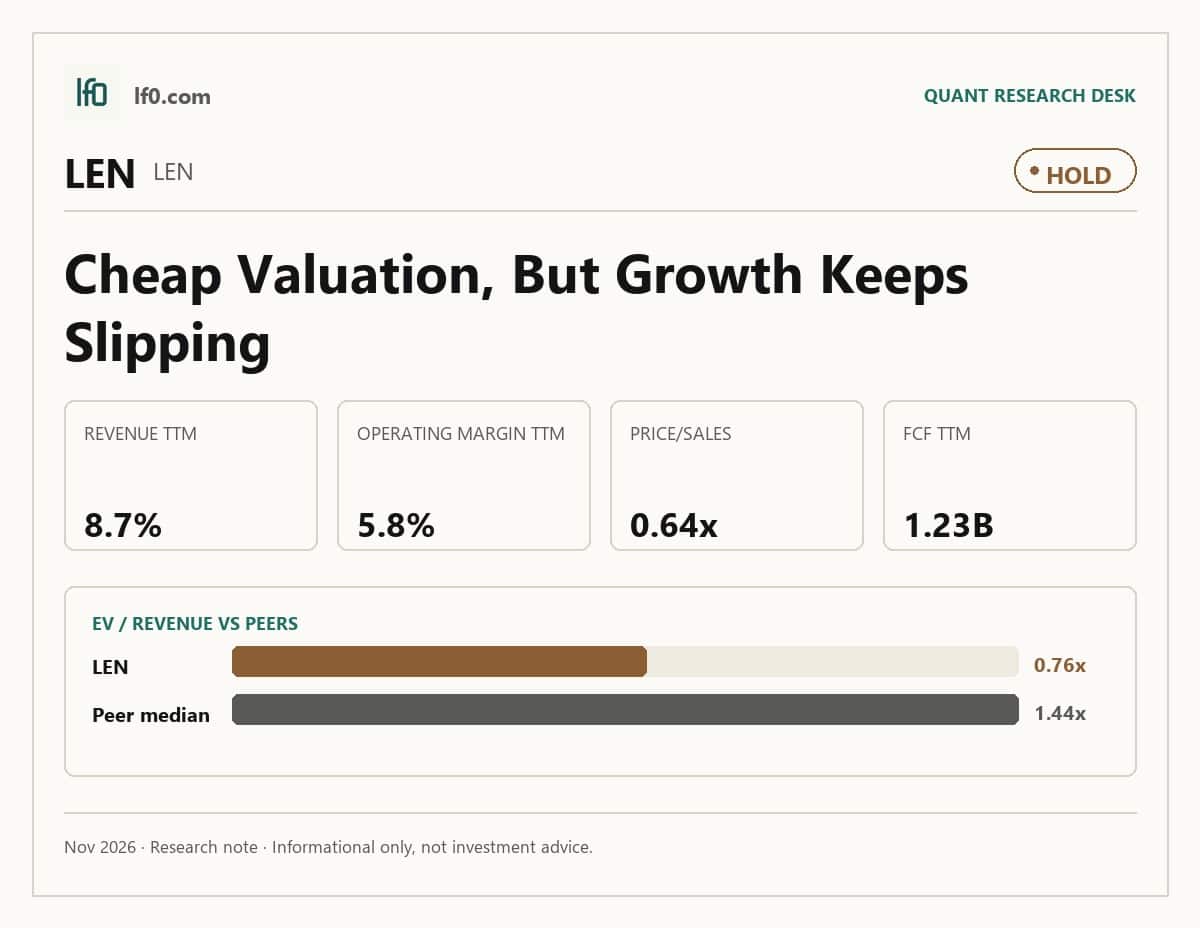
- Rated Hold — profitable and cash generative, but revenue is still shrinking.
- Strongest support: $1.23B of levered free cash flow TTM and a 10.1x current ratio.
- Main risk: revenue fell 8.7% TTM, with margins still under pressure.
- Valuation is mixed: 0.64x price/sales and 15.8x trailing P/E are not cheap enough for a clear Buy.
- I would turn more constructive if first-quarter 2026 margins move back toward the mid-teens.
Executive Summary
We’ll begin tracking this call’s performance since publication once sufficient adjusted-close data is available.
I would put my rating as a Hold because Lennar is still profitable and liquid, but the latest numbers do not yet show a durable earnings inflection. TTM operating margin of 5.8% and net margin of 4.1% show the core business is earning money, while $1.23B of levered free cash flow TTM and a 10.1x current ratio give the company room to absorb a softer housing backdrop.
The key question is whether that flexibility turns into better pricing power. I would raise my rating more towards a Buy if first-quarter 2026 margins move back toward the mid-teens, because that would show incentives are easing and the current valuation is being backed by earnings rather than hope.
Company Profile
Lennar was founded in Miami in 1954, went public in 1971, and listed on the New York Stock Exchange in 1972. It builds and sells single-family attached and detached homes, which generated $32B of revenue in fiscal 2025, or about 94% of consolidated revenue. The company also originates residential and commercial mortgage loans through Lennar Mortgage, provides title and closing services, develops multifamily rental properties, and manages rental funds and joint ventures.
As of November 30, 2025, Lennar operated 1,708 active homebuilding communities across the East, Central, South Central and West regions, plus urban divisions and other investments mainly in California. The February 2025 Rausch Coleman acquisition expanded the footprint into Arkansas, Oklahoma, Alabama and Kansas/Missouri, while the Millrose Properties spin-off separated a large land portfolio and pushed the company further toward a land-light model. That structure matters because Lennar now earns most of its revenue from home sales while relying on mortgage, title and rental-related businesses to deepen the customer relationship and support the core housing platform.
Economic Moat
Business Model
Lennar’s moat is built on a land-light operating model and scale. At November 30, 2025, 98% of total homesites were controlled through options with land banks, land sellers and joint ventures, up from 82% a year earlier, which lowers capital intensity and gives the company more flexibility when local demand shifts. I feel that this is hard for a well-funded competitor to copy quickly because it combines optioned land, strategic land banks and a centralized acquisition process with national purchasing leverage and the “Everything’s Included®” standardization model.
Scale reinforces that advantage. Lennar was one of the largest homebuilders in the United States by deliveries, revenue and net earnings in fiscal 2025, and its financial services arm provided loans to 84% of homebuyers who used mortgage financing. In my view, that keeps more of each transaction inside Lennar’s ecosystem and makes the operating model more efficient than a smaller builder’s.
Business & Operating Risks
The main disclosed risk is affordability pressure. Lennar says inflation, high interest rates, tariffs and trade policy are raising what buyers pay for new homes, and it also notes that several markets experienced significant softening that forced substantial price reductions. That is already showing up in the numbers: margins are lower and revenue is still declining, so the risk is not theoretical.
The second risk is the land-light structure itself. Lennar relies more heavily on Millrose and other land banking entities, and if those partners refuse to honor options or cannot raise capital, Lennar could lose access to land and delay deliveries. The third risk is financing, because the company still has meaningful debt and must manage warehouse-line renewals while mortgage-market liquidity remains sensitive to rates.
Taken together, these risks do not break the moat, but they do test it. The land-light model still looks intact, yet the current pricing pressure and financing dependence are exactly the points where that advantage can be strained.
Management Discussion & Analysis
Management is responding to those risks by keeping the balance sheet flexible and the operating model asset-light, but it is not pretending the cycle has already turned. The Millrose spin-off moved roughly 87,000 homesites and $1.0B of cash out of Lennar in February 2025, and the later exchange offer reduced the remaining investment further, which supports capital efficiency even as it reduces reported equity. At the same time, the company repurchased 14.1 million shares of stock in 2025 and kept the dividend in place, so capital return remains part of the playbook.
The message on operations is more cautious than in prior years. Management is still guiding to first-quarter 2026 margins of 15% to 16%, 18,000 to 19,000 homes sold, and about 85,000 homes delivered for fiscal 2026, which tells me the near term is still a volume and incentive management exercise rather than a clean pricing recovery. That is consistent with the risk profile above: the company is defending throughput, but it has not yet proven to me that pricing pressure is behind it.
Recent Events
The March 12, 2026 first-quarter earnings release did not change the strategic picture. It confirmed the normal reporting cadence and did not point to any major corporate reset, so the core thesis remains intact.
The June 5, 2026 leadership change was more interesting. Jim Parker was named chief operating officer and David Grove was named executive vice president, homebuilding, both as long-tenured internal operators. I read that as an execution move rather than a strategic pivot, which supports continuity in the operating model and reduces transition risk.
The April 8, 2026 annual meeting also reinforced stability. Shareholders re-elected the board, approved executive compensation and ratified Deloitte & Touche LLP for fiscal 2026, while rejecting the equal voting rights and class-level voting disclosure proposals. In my view, the recent 8-Ks leave the moat thesis unchanged: Lennar is still executing the same land-light model, but the market has not yet seen a new catalyst that would materially re-rate the stock.
Financial Analysis
Growth
LEN — Financial Growth (Quarterly, USD Mil)
| Metric | 2025-08-31 | 2025-11-30 | 2026-02-28 | 2026-05-31 | 2026-08-31 |
|---|---|---|---|---|---|
| REVENUE (USD Mil) | 8,810.3 | 9,367.6 | 6,619.5 | 7,939.9 | 8,046.1 |
| EBIT (USD Mil) | 721.2 | 667 | 233.1 | 418.8 | 480.7 |
| EBITDA (USD Mil) | 755.4 | 701.9 | 266.5 | 454.1 | 516.6 |
| NET INCOME (USD Mil) | 591 | 490.2 | 229.4 | 304.8 | 283.9 |
| DILUTED EPS | 2.3 | 1.9 | 0.9 | 1.2 | 1.2 |
Source: Yahoo Finance — Quarterly Financial Statements
LEN’s revenue fell 8.7% TTM, which is weaker than DHI’s -3.2% and close to TOL’s -9.7%, PHM’s -9.8% and NVR’s -8.2%. That tells me the company is not gaining share through the cycle; it is still working through a softer housing backdrop.
Quarterly revenue also remains choppy. It moved from $8.81B in 2025-08-31 to $9.37B in 2025-11-30, then dropped to $6.62B in 2026-02-28 before recovering to $7.94B in 2026-05-31 and $8.05B in 2026-08-31. EBITDA followed the same pattern, falling to $266M in 2026-02-28 from $702M in 2025-11-30, which shows operating leverage is still sensitive to volume and incentives.
Growth versus peers
| Company | Revenue TTM (USD Mil) | Revenue Growth YoY % | EBITDA TTM (USD Mil) | Diluted EPS TTM |
|---|---|---|---|---|
| LEN | 31,973.1 | -8.7% | 1,982.1 | 5.3 |
| DHI | 33,043.4 | -3.2% | 3,809.7 | 10.1 |
| TOL | 10,759 | -9.7% | 1,682.2 | 12.4 |
| PHM | 15,976.1 | -9.8% | 2,608.2 | 9.4 |
| NVR | 9,413.9 | -8.2% | 1,427.6 | 361.8 |
| KBH | 5,180.9 | -20.0% | 340.9 | 3.5 |
Source: Yahoo Finance
LEN’s revenue TTM of $32B fell 8.7% year over year, which is worse than DHI’s -3.2% but better than KBH’s -20.0%. TOL, PHM and NVR were also negative, so the peer set is weak overall and Lennar is not being singled out for growth leadership.
Profitability
LEN’s TTM operating margin was 5.8%, net margin was 4.1%, return on assets was 3.4% and return on equity was 6.0%. Those are positive, but they sit well below DHI, TOL, PHM and NVR, so the company is profitable without yet looking like a high-return compounder.
The gap between ROE and ROA is 2.6 percentage points, which tells me leverage is helping returns but not transforming them. That matters because the moat is operational, not financial: the land-light model should support better capital efficiency, but the current return profile still leaves room for improvement before I would call the earnings power fully normalized.
Profitability versus peers
| Company | Operating Margin (TTM) | Net Margin (TTM) | Return on Assets (TTM) | Return on Equity (TTM) | Gross Margin (TTM) | EBITDA Margin (TTM) |
|---|---|---|---|---|---|---|
| LEN | 5.8% | 4.1% | 3.4% | 6.0% | — | — |
| DHI | 11.2% | 8.7% | 6.6% | 12.1% | — | — |
| TOL | 14.9% | 11.1% | 6.9% | 14.4% | — | — |
| PHM | 15.6% | 11.2% | 8.6% | 13.9% | — | — |
| NVR | 14.9% | 11.1% | 15.1% | 28.3% | — | — |
| KBH | 5.8% | 4.4% | 2.7% | 5.9% | — | — |
Source: Yahoo Finance
LEN’s operating margin of 5.8% and net margin of 4.1% trail DHI’s 11.2% and 8.7%, TOL’s 14.9% and 11.1%, PHM’s 15.6% and 11.2% and NVR’s 14.9% and 11.1%. KBH is the closest comp at 5.8% and 4.4%, which tells me Lennar is closer to the lower end of the peer set on returns.
ROE of 6.0% and ROA of 3.4% are also below most peers, so the valuation discount is tied to a lower-return operating model rather than just a temporary margin dip. In other words, the market is not paying Lennar for premium profitability, and I think that is fair.
Valuation
LEN trades at 0.64x price/sales, 0.76x EV/revenue, 15.8x trailing P/E and 17.2x forward P/E. On book value, the shares change hands at 0.92x price/book against a current share price of $83.8 and book value per share of $90.62, so the stock is below book but not at a distressed level.
Using the peer EV/revenue range of 0.9x to 1.7x on LEN’s $32B TTM revenue gives an implied enterprise value of roughly $30.1B to $52.8B, or about $115 to $228 per share after netting $6.1B of debt and $1.2B of cash and dividing by 207.9M shares. That range sits well above the current price, but I weight Lennar’s weaker growth and lower returns more heavily than the peer average, so I do not read the gap as a clean mispricing.
Analyst coverage is meaningful at 15 opinions, and the consensus target range of $58 to $115 with a $77.3 mean sits below the top end of the peer-implied range. My own fair-value view is narrower than the peer multiple math because I think the market is right to discount the current margin profile and the still-soft revenue trend. Forward EPS of 5.22 also looks modest relative to DHI’s $10.8, TOL’s $13.6, PHM’s $9.4 and NVR’s $346.4, which reinforces that Lennar is cheaper than the premium names for a reason.
Valuation versus peers
| Company | Current Share Price (USD) | Trailing P/E | Forward P/E | EV/Revenue | EV/EBITDA | Price/Sales (TTM) | Price/Book (mrq) | Market Cap (USD Mil) | Enterprise Value (USD Mil) | Beta (5Y Monthly) | FCF Yield % (TTM) | Forward EPS | Analyst Target Price – Low | Analyst Target Price – Mean | Analyst Target Price – High | # Analyst Opinions |
|---|---|---|---|---|---|---|---|---|---|---|---|---|---|---|---|---|
| LEN | 83.8 | 15.8 | 17.2 | 0.8 | 12.5 | 0.6 | 0.9 | 19,829 | 24,245 | 1.38 | — | 5.2 | 58 | 77.3 | 115 | 15 |
| DHI | 144.8 | 14.4 | 18.4 | 1.3 | 11.7 | 1.3 | 1.7 | 39,507 | 43,501 | 1.37 | — | 10.8 | 114 | 146.5 | 186 | 14 |
| TOL | 147.2 | 11.9 | 10.9 | 1.4 | 9.9 | 1.3 | 1.6 | 13,624 | 15,479 | 1.30 | — | 13.6 | 118 | 169.1 | 195 | 18 |
| PHM | 127 | 13.6 | 15 | 1.5 | 9.6 | 1.5 | 1.8 | 23,381 | 23,769 | 1.18 | — | 9.4 | 100 | 132.4 | 162 | 17 |
| NVR | 5,793.4 | 16.2 | 18.1 | 1.7 | 10.8 | 1.8 | 4.5 | 15,488 | 15,431 | 0.94 | — | 346.4 | 4,864 | 6,229.7 | 7,425 | 6 |
| KBH | 47.4 | 13.5 | 13.8 | 0.9 | 16.1 | 0.6 | 0.8 | 2,911 | 4,891 | 1.36 | — | 3.6 | 37 | 51 | 70 | 14 |
Source: Yahoo Finance
LEN trades at 0.64x price/sales and 0.76x EV/revenue, versus DHI at 1.3x and 1.3x, TOL at 1.3x and 1.4x, PHM at 1.5x and 1.5x, NVR at 1.8x and 1.7x, and KBH at 0.6x and 0.9x. On a growth-adjusted basis, the discount is only partial because LEN’s revenue decline is still close to the peer group, so the market is not paying up for a clear growth edge.
A $1 investment in LEN one year ago would be worth $0.75 today, versus $1.06 in DHI, $1.17 in TOL, $1.12 in PHM, $0.83 in NVR and $0.82 in KBH. That underperformance tells me the market has already been skeptical of Lennar’s earnings path, which is why the low sales multiple does not automatically translate into a bargain.
Leverage
Lennar’s leverage is moderate rather than stretched. Total debt to equity was 28.2% mrq, current ratio was 10.1x and total debt was $6.1B mrq, while cash was $1.2B mrq. That gives the company room to refinance and keep returning capital without immediate balance-sheet stress.
Operating cash flow was $937.3M TTM and levered free cash flow was $1.23B TTM, so cash generation is covering the capital structure with a wide cushion. I would not call leverage a competitive advantage, but it is not the constraint on the thesis either; the real issue is whether earnings can improve fast enough to make the current valuation look cheap rather than merely supported.
Leverage versus peers
| Company | Total Debt/Equity % (mrq) | Current Ratio (mrq) | Total Debt (mrq, USD Mil) | Operating Cash Flow TTM (USD Mil) | Free Cash Flow TTM (USD Mil) | Net Debt/EBITDA (TTM) | FCF Margin % (TTM) |
|---|---|---|---|---|---|---|---|
| LEN | 28.2 | 10.1 | 6,118.7 | 937.3 | 1,227.2 | — | — |
| DHI | 25.5 | 4.3 | 6,053.9 | 3,507.2 | 7,815.4 | — | — |
| TOL | 34.1 | 4.5 | 2,912.8 | 1,192.1 | 557.7 | — | — |
| PHM | 18.4 | 7 | 2,414.2 | 1,408.1 | 844.2 | — | — |
| NVR | 32.2 | 5.4 | 1,105.1 | 851.8 | 706.5 | — | — |
| KBH | 56.3 | 5.5 | 2,140.1 | 75 | -27.4 | — | — |
Source: Yahoo Finance
LEN’s total debt to equity of 28.2% sits above DHI’s 25.5% and PHM’s 18.4%, but below TOL’s 34.1%, NVR’s 32.2% and KBH’s 56.3%. The current ratio of 10.1x is stronger than every peer shown, which helps explain why Lennar can keep buying back stock and paying a dividend without looking financially stretched.
That combination matters for valuation: the balance sheet is strong enough to avoid distress, but not so clean that the market should award a premium multiple. I think the peer discount is therefore more about lower returns and softer growth than about leverage risk.
Insider Activity
I see no open-market insider purchases or sales in the available filing window. The activity that is present is limited to awards, tax withholding and one gift, so it does not give me a strong directional signal.
That said, the absence of meaningful open-market buying also means insiders are not sending a clear confidence signal at the current price. I treat that as neutral rather than negative.
Conclusion
I would put my rating as a Hold because Lennar’s balance sheet and cash generation are good enough to support the business, but the latest revenue and margin trends still do not show a durable recovery. The company is profitable, liquid and still returning capital, yet the 5.8% operating margin and 8.7% TTM revenue decline tell me the housing cycle is still doing most of the work.
I would raise my rating more towards a Buy if first-quarter 2026 operating margin moves back into the low double digits and stays there for two quarters, because that would show incentives are easing and pricing power is returning rather than just bouncing for one quarter. I would also want to see revenue stop shrinking and turn positive on a year-over-year basis, since that would mean the 98% optioned homesite model is translating into actual demand rather than just preserving flexibility. If deliveries hold near the 85,000-unit fiscal 2026 guide while incentive intensity falls, that would be the clearest sign that earnings are improving on a sustainable basis.
The bear case is that revenue keeps sliding and incentives stay elevated, which would keep gross margin and operating leverage under pressure even with the land-light model. If Lennar has to keep leaning on price cuts while refinancing $3.0B of warehouse lines and carrying $6.1B of debt, the cash flow cushion narrows and the current valuation stops looking like a discount.
Weighing both sides, I think the softer operating trend is more likely to show up first than a clean re-rating. The balance sheet is strong enough to avoid distress, but not strong enough to force the market to pay up before earnings improve, so I would stay at Hold until the margin recovery is visible in the numbers.
What to Watch Next
- First-quarter 2026 operating margin back in the low double digits — would support a move toward Buy.
- Year-over-year revenue turning positive — would show demand is improving, not just being defended.
- Deliveries near the 85,000-unit fiscal 2026 guide — would confirm the operating model is holding volume.
- Incentive intensity falling — would signal pricing power is returning.
- Refinancing of the $3B warehouse lines — would reduce a key financing overhang.
What’s your take? I rated Lennar (LEN) HOLD above — but the goal here is to get this right, not just to publish an opinion. What would you add to this analysis, or which risk or catalyst do you think I’m under- or over-weighting? Tell me in the comments.
Our track record: every directional call is tracked publicly on The Scorecard, and Stocks Covered lists every company we have rated and when.
Sources
- SEC 10-K Annual Report — filed 2026-01-28
- SEC 8-K Filing (2026-06-08)
- SEC 8-K Filing (2026-04-13)
- SEC 8-K Filing (2026-03-12)
- SEC Form 4 Insider Transaction (2026-06-02)
- SEC Form 4 Insider Transaction (2026-06-02)
- SEC Form 4 Insider Transaction (2026-05-13)
- SEC 10-K Annual Report — FY2026
- SEC 10-K Annual Report — FY2025
- SEC 10-K Annual Report — FY2024
- SEC 10-K Annual Report — FY2023
- SEC 10-K Annual Report — FY2022
Data sourced from Yahoo Finance and SEC EDGAR. Not investment advice.
Leave a Comment