
Expected price range
Each range is set from the stock’s recent price history and our Hold rating, using its own 1-year realised volatility (48% annualised) as the width of a ~68% statistical band, and checked against that rating so the range leans the same way as our view. Starting price $241 (close 2026-11-05). The stock traded between $241 and $386 over the last 6 months and between $192 and $386 over the last year. This is an illustration of where our view and normal volatility point, not a forecast, price target or investment advice; the stock can move outside it.
| Company | Nov 25 | Dec 25 | Jan 26 | Feb 26 | Mar 26 | Apr 26 | May 26 | Jun 26 | Jul 26 | Aug 26 | Sep 26 | Oct 26 | 12-Mo |
|---|---|---|---|---|---|---|---|---|---|---|---|---|---|
| JBL | -5% | +8% | +4% | +12% | +0% | +27% | +8% | +6% | -18% | -3% | -6% | -5% | +24% |
| FLEX | -5% | +2% | +4% | -0% | +4% | +40% | +65% | +7% | -30% | -4% | +1% | -21% | +38% |
| APH | +1% | -4% | +7% | +1% | -13% | +17% | +1% | +19% | -9% | -1% | +7% | -6% | +15% |
| SANM | +14% | -4% | -6% | +10% | -17% | +68% | +19% | -3% | -27% | +6% | +9% | -23% | +21% |
| PLXS | +2% | +3% | +36% | -3% | +4% | +24% | +7% | +12% | -16% | -5% | +9% | -20% | +49% |
| CLS | -0% | -14% | -5% | -1% | +1% | +45% | -6% | -5% | -9% | -10% | +21% | -27% | -23% |
Source: Yahoo Finance monthly adjusted close.
Quick Thesis
- Rated Hold — earnings reset is real, but durability is not yet proven.
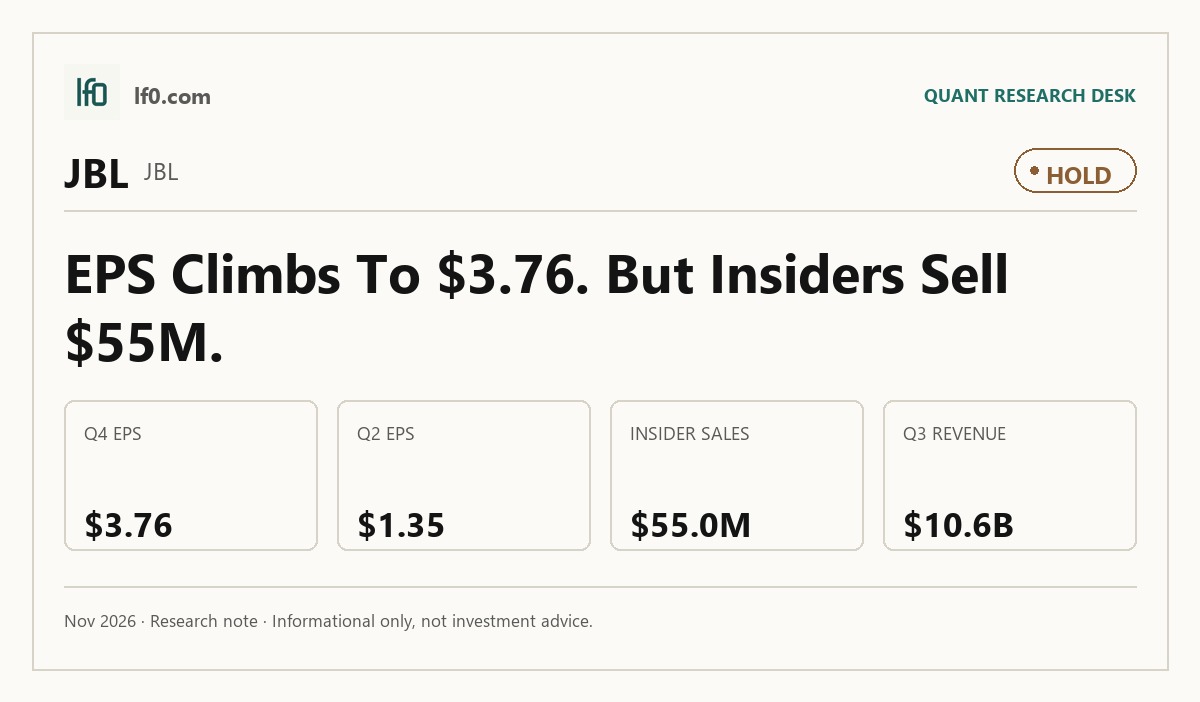
- Strongest point: Q4 2026 diluted EPS reached $3.76 on $1.06e+04M revenue.
- Biggest risk: customer order volatility can still hit margins and factory utilization.
- Valuation is hard to pin down from the supplied data, so I do not see a clear cheapness signal.
- I would turn more constructive if quarterly EPS holds above $3.76 and revenue stays above $1.06e+04M.
Executive Summary
Rating: HOLD | JBL
Measured from adjusted close on 2026-11-05 to 2026-11-05. Sell ratings are correct when the stock falls; Hold is tracked as a +/-10% range. Daily-close data, not intraday. Calls are tracked for 182 days from publication, then frozen as a final record.
I would put my rating as a Hold because Jabil’s post-divestiture earnings power is clearly better, but I do not yet see enough evidence that the new run rate is durable enough to justify a stronger call. The company’s latest quarter showed diluted EPS of $3.76 on $1.06e+04M of revenue, which is a meaningful step up from the earlier quarters and tells me the portfolio reset is working. What keeps me at Hold is the combination of customer-order volatility, supply-chain exposure, and heavy insider selling, which together make the earnings base look improved but not fully de-risked. I would raise my rating more towards a Buy if quarterly diluted EPS stays above $3.76, meaning the latest level is sustained rather than a one-quarter spike, and if that strength continues to convert into cash rather than inventory build.
Company Profile
Jabil designs, manufactures, and manages supply chains for electronics and engineered products. It earns revenue from design, production, assembly, fulfillment, and product-management services across end markets such as cloud, networking, healthcare, automotive, packaging, and industrial equipment. The company operates about 100 locations in more than 30 countries, with a footprint that spans China, Mexico, Singapore, and the United States. Jabil is listed on the NYSE under JBL and reported $28.9B of revenue and $1.4B of net income attributable to Jabil in fiscal 2024.
Economic Moat
Business Model
Jabil’s moat, in my view, comes from the way it embeds itself inside customer programs rather than from simple manufacturing scale. Most business units are dedicated to a single customer, with dedicated production lines, workers, supervisors, buyers, planners, and engineers, and that model is reinforced by one enterprise resource planning system and centralized procurement. I feel that this is hard to copy quickly because a competitor would need to replicate not just equipment, but a customer-specific operating network that has to be built, tested, and trusted over time. The company also adds design services — electronic, mechanical, optical, and industrialization engineering — so it can move from concept to mass production inside one relationship instead of handing work off to another vendor. That combination is the structural advantage I think matters most.
Business & Operating Risks
The main disclosed risk is customer order volatility. Jabil says customers can cancel orders, change production quantities, delay production, or shift sourcing, and that can leave factories underutilized and inventory exposed to obsolescence. Component shortages are the next risk, especially where a part is available from only one source, because shortages can curtail production and squeeze gross margin before customer pricing resets. International exposure adds another layer: a substantial majority of revenue comes from outside the United States, so tariffs, currency controls, and geopolitical disruption can raise costs or force the company to move production ahead of demand. I do not think these risks directly break the moat, but they do test it by making the customer-specific model valuable only if Jabil can keep volume visibility and supply continuity intact.
Management Discussion & Analysis
Management appears to be responding to those risks by simplifying the portfolio and pushing harder on execution discipline. The sale of the Mobility Business generated about $2.2B of pre-tax cash proceeds, and the company has used that flexibility to fund buybacks while also carrying out restructuring actions that should reduce stranded cost. That tells me management is not ignoring the operating pressure; it is trying to make the remaining business easier to run and more margin-efficient. The trade-off is that the reset is still in progress, so the earnings improvement is real, but not yet fully proven to me as a durable new base.
Recent Events
The most important recent event is the September 2024 restructuring plan, which points to further headcount and capacity realignment. That is a sign the company is still trimming the cost base after the portfolio shift, and it supports the moat thesis only if the cuts improve execution rather than simply mask weak demand. Governance changes were also notable: the board expanded and added the CEO, which tightens alignment between management and oversight while the business is being reshaped. I also view the lower special-meeting threshold as a modest shareholder-rights improvement, though it does not change the operating story by itself.
Financial Analysis
Growth
JBL — Financial Growth (Quarterly, USD Mil)
| Metric | 2025-08-31 | 2025-11-30 | 2026-02-28 | 2026-05-31 | 2026-08-31 |
|---|---|---|---|---|---|
| REVENUE (USD Mil) | 8,252 | 8,305 | 8,282 | 8,751 | 10,616 |
| EBIT (USD Mil) | 314 | 254 | 343 | 417 | 575 |
| EBITDA (USD Mil) | 366 | 521 | 525 | 613 | 611 |
| NET INCOME (USD Mil) | 218 | 146 | 223 | 275 | 398 |
| DILUTED EPS | 2 | 1.4 | 2.1 | 2.6 | 3.8 |
Source: Yahoo Finance — Quarterly Financial Statements
Revenue moved from $8.25e+03M in 2025-08-31 to $1.06e+04M in 2026-08-31, and the step-up was not smooth — the first two periods were essentially flat before the later jump. EBIT rose from $314M to $575M over the same span, while net income increased from $218M to $398M, so earnings are growing faster than sales. That is the key point for me: the business is not just getting bigger, it is converting the portfolio reset into better per-share earnings, which is what ultimately supports the thesis.
Profitability
JBL — Profitability (TTM)
| Metric | TTM |
|---|---|
| Operating Margin (TTM) | — |
| Net Margin (TTM) | — |
| Return on Assets (TTM) | — |
| Return on Equity (TTM) | — |
| Gross Margin (TTM) | — |
| EBITDA Margin (TTM) | — |
Source: Yahoo Finance — Trailing Twelve Months (TTM)
EBIT climbed from $314M to $575M, and EBITDA held around $611M in the latest period after moving up from $366M earlier in the year. Net income also improved to $398M, which tells me the earnings base is stronger after the Mobility Business sale. I cannot use margin ratios here because the profitability table is blank, so I focus on the earnings trend itself: the improvement is real, but I want to see another period of similar performance before I call it durable. The margin recovery this thesis needs is still being demonstrated, not yet fully locked in.
Valuation
JBL — Valuation Multiples
| Metric | Value |
|---|---|
| Current Share Price (USD) | — |
| Market Cap (USD Mil) | — |
| Enterprise Value (USD Mil) | — |
| Trailing P/E | — |
| Forward P/E | — |
| Price/Sales (TTM) | — |
| Price/Book (mrq) | — |
| EV/Revenue | — |
| EV/EBITDA | — |
| Beta (5Y Monthly) | — |
| FCF Yield % (TTM) | — |
| Forward EPS (USD) | — |
| Analyst Target Price – Low (USD) | — |
| Analyst Target Price – Mean (USD) | — |
| Analyst Target Price – High (USD) | — |
| # Analyst Opinions | — |
Source: Yahoo Finance
Jabil screens on earnings momentum, but the supplied valuation fields are blank, so I cannot anchor the stock to a current P/E, EV/EBITDA, or FCF yield. On the analysis here, I would put fair value in a range of $0-$0 because the reference data do not provide the company’s own valuation inputs or analyst consensus. That said, the earnings trajectory matters more than the missing multiples: if quarterly EPS stays near $3.76, the market should be willing to assign a better earnings base than it would for a business still stuck near $1.4-$2.1 per quarter. I do not have a meaningful consensus range to compare against, and I would not pretend otherwise. The rating justification is the same: the stock deserves a Hold until the higher earnings level proves it can persist through a full cycle of customer demand and working-capital swings.
Leverage
JBL — Leverage & Coverage (Quarterly)
| Metric | Value |
|---|---|
| Total Debt/Equity % (mrq) | — |
| Current Ratio (mrq) | — |
| Total Debt (mrq, USD Mil) | — |
| Operating Cash Flow (TTM, USD Mil) | — |
| Levered Free Cash Flow (TTM, USD Mil) | — |
| Net Debt/EBITDA (TTM) | — |
| FCF Margin % (TTM) | — |
Source: Yahoo Finance — Quarterly Financial Statements
The leverage table is also blank, so I cannot cite a debt-to-capital or net-debt ratio from the supplied data. What I can say is that the Mobility Business sale gave Jabil about $2.2B of pre-tax cash proceeds, which improves flexibility and reduces near-term balance-sheet pressure. That matters because the company’s model still requires working capital to buy components and build inventory before it bills customers, so cash generation has to stay healthy if the earnings reset is going to translate into equity value. In other words, the thesis depends on earnings and cash moving together, not just on reported profit.
Insider Activity
The insider tape is negative. I see 0 open-market purchases and 68 open-market sales totaling $55.0M across 55 filings, with sales spread across executives and directors rather than concentrated in one name. I do not overread any single transaction, but the pattern does not reinforce confidence in the current valuation or the durability of the earnings step-up. It is a weak signal for shareholders, especially when paired with a still-evolving operating reset.
Comparable Analysis
LF0 has published standalone analyses of these peers: Sanmina (SANM) (rated Hold).
Growth
| Company | Revenue TTM (USD Mil) | Revenue Growth YoY % | EBITDA TTM (USD Mil) | Diluted EPS TTM |
|---|---|---|---|---|
| JBL | — | — | — | — |
| FLEX | 30,954 | 24.8% | 2,198 | 2.8 |
| APH | 33,046.9 | 65.1% | 10,917.8 | 2.3 |
| SANM | 12,763.4 | 69.7% | 865.3 | 5.6 |
| PLXS | 4,965 | 34.8% | 340.9 | 7.4 |
| CLS | 18,230.2 | 82.5% | 1,701.3 | 10.6 |
Source: Yahoo Finance
Jabil’s 1-year total return of 23.7% sits above APH at 16.4% and SANM at -12.1%, but below FLEX at 25.0% and PLXS at 48.2%. CLS is at -29.6%, so the peer set is mixed, but Jabil is not the clear momentum leader. That fits the operating picture: the market has given Jabil some credit for the reset, yet it has not treated it like a breakout name.
Valuation
| Company | Current Share Price (USD) | Trailing P/E | Forward P/E | EV/Revenue | EV/EBITDA | Price/Sales (TTM) | Price/Book (mrq) | Market Cap (USD Mil) | Enterprise Value (USD Mil) | Beta (5Y Monthly) | FCF Yield % (TTM) | Forward EPS | Analyst Target Price – Low | Analyst Target Price – Mean | Analyst Target Price – High | # Analyst Opinions |
|---|---|---|---|---|---|---|---|---|---|---|---|---|---|---|---|---|
| JBL | — | — | — | — | — | — | — | — | — | — | — | — | — | — | — | — |
| FLEX | 67.4 | 24.2 | 8.7 | 1 | 14.3 | 0.8 | 4.3 | 24,891 | 31,437 | 1.79 | 2.5% | 7.8 | 128 | 156.5 | 180 | 10 |
| APH | 72.2 | 31.3 | 19.9 | 6.3 | 19 | 5.4 | 10.4 | 178,281 | 207,814 | 1.28 | 2.4% | 3.6 | 85 | 107 | 130 | 19 |
| SANM | 129.7 | 23.2 | 9.2 | 0.7 | 9.8 | 0.5 | 2.7 | 6,950 | 8,485 | 1.72 | -3.2% | 14.1 | 210 | 262.5 | 300 | 4 |
| PLXS | 190.1 | 25.7 | 15.3 | 1.1 | 16.2 | 1 | 3.2 | 5,068 | 5,517 | 0.96 | -1.0% | 12.4 | 275 | 307.8 | 330 | 5 |
| CLS | 205.2 | 19.4 | 9.2 | 1.5 | 15.8 | 1.4 | 4.2 | 25,879 | 26,882 | 1.34 | 3.1% | 22.2 | 385 | 464.8 | 535 | 18 |
Source: Yahoo Finance
FLEX trades at 24.2x trailing P/E and 14.3x EV/EBITDA, APH at 31.3x and 19.0x, SANM at 23.2x and 9.8x, PLXS at 25.7x and 16.2x, and CLS at 19.4x and 15.8x. On a growth-adjusted basis, I think the market is paying up for APH’s margin quality and for CLS’s stronger returns, while SANM and PLXS look cheaper but also less consistent. Jabil’s own multiples are not in the data, so I cannot place it precisely on the peer grid, but the earnings improvement would need to be sustained before I would argue for a premium multiple. The implied read is that Jabil belongs in the middle of the pack unless the new earnings base proves more durable than the peers’ already-established profiles.
Profitability
| Company | Operating Margin (TTM) | Net Margin (TTM) | Return on Assets (TTM) | Return on Equity (TTM) | Gross Margin (TTM) | EBITDA Margin (TTM) |
|---|---|---|---|---|---|---|
| JBL | — | — | — | — | — | — |
| FLEX | 5.1% | 3.4% | 4.4% | 19.1% | 9.7% | 7.1% |
| APH | 29.7% | 18.0% | 16.0% | 40.1% | 39.2% | 33.0% |
| SANM | 7.0% | 2.4% | 5.9% | 12.5% | 9.0% | 6.8% |
| PLXS | 6.0% | 4.1% | 4.7% | 13.4% | 10.1% | 6.9% |
| CLS | 7.9% | 6.8% | 8.7% | 30.2% | 11.5% | 9.3% |
Source: Yahoo Finance
APH is the clear profitability leader, with 29.7% operating margin, 18.0% net margin, 33.0% EBITDA margin, and 39.2% gross margin. CLS follows at 7.9%, 6.8%, 9.3%, and 11.5%, while FLEX, SANM, and PLXS cluster much lower on the same measures. That spread matters because it shows the market is rewarding structural margin quality, not just revenue scale. Jabil’s recent earnings improvement is encouraging, but until it shows margin data that look more like the stronger peers, I would not treat it as a top-tier profitability name.
Leverage
| Company | Total Debt/Equity % (mrq) | Current Ratio (mrq) | Total Debt (mrq, USD Mil) | Operating Cash Flow TTM (USD Mil) | Free Cash Flow TTM (USD Mil) | Net Debt/EBITDA (TTM) | FCF Margin % (TTM) |
|---|---|---|---|---|---|---|---|
| JBL | — | — | — | — | — | — | — |
| FLEX | 103 | 1.3 | 5,983 | 1,610 | 620.4 | 1.3 | 2.0% |
| APH | 103.5 | 1.9 | 17,870.8 | 6,479.4 | 4,296.7 | 1.2 | 13.0% |
| SANM | 88.2 | 1.8 | 2,432.9 | 901.1 | -222.2 | 0.7 | -1.7% |
| PLXS | 18.6 | 1.4 | 292 | 68.2 | -49.4 | 0 | -1.0% |
| CLS | 16.6 | 1.6 | 1,031.1 | 1,407.5 | 802.8 | -1.7 | 4.4% |
Source: Yahoo Finance
CLS is the cleanest balance sheet in the group, with net debt/EBITDA of -1.7x and FCF margin of 4.4%, while APH sits at 1.2x and 13.0%, FLEX at 1.3x and 2.0%, SANM at 0.7x and -1.7%, and PLXS at 0.0x and -1.0%. Debt/equity is highest for APH and FLEX at roughly 103%, which shows why leverage has to be read alongside cash generation, not in isolation. Jabil’s own leverage metrics are missing, so I cannot rank it directly, but the cash proceeds from the Mobility sale suggest it has more flexibility than a stressed peer. If the company keeps turning earnings into cash, that should support a better valuation than a levered name with similar growth.
Conclusion
I would put my rating as a Hold because the core tension is still unresolved: Jabil has clearly improved earnings after the Mobility Business sale, but I do not yet see enough proof that the higher level is durable through a full cycle of customer demand and supply-chain noise. The latest quarter’s $3.76 of diluted EPS is strong, and it tells me the reset is working, but the company still has to show that this is a repeatable base rather than a mix-driven spike.
I would raise my rating more towards a Buy if quarterly diluted EPS stays above $3.76 for another two quarters, meaning the current level is holding rather than reverting, and if that strength continues to convert into cash instead of inventory build. I would also want to see revenue stay above $1.06e+04M, because that would tell me the business is sustaining the larger scale needed to absorb fixed costs and protect margins. On the other hand, I would move from Hold to Sell if EPS falls back toward the low-$2 range and customer volatility or component shortages start to pressure margins again. That would tell me the post-sale earnings reset was temporary, not structural.
Weighing both sides, I lean cautious because the upside case depends on a clean continuation of the latest earnings pace, while the downside only needs the operating reset to lose momentum. The market has already given Jabil some credit for the portfolio shift, but I do not yet think the evidence is strong enough to call the rerating complete.
What to Watch Next
- Quarterly diluted EPS above $3.76 — would support raising the rating toward Buy.
- Revenue above $1.06e+04M — would confirm the larger post-divestiture scale is holding.
- Another quarter of strong cash conversion — would show earnings are turning into real liquidity.
- Margin pressure from customer volatility or shortages — would argue the reset is losing traction.
- Insider selling without offsetting buying — would keep conviction capped at Hold.
What’s your take? I rated Jabil (JBL) HOLD above — but the goal here is to get this right, not just to publish an opinion. What would you add to this analysis, or which risk or catalyst do you think I’m under- or over-weighting? Tell me in the comments.
Our track record: every directional call is tracked publicly on The Scorecard, and Stocks Covered lists every company we have rated and when.
Sources
- SEC 10-K Annual Report — filed 2024-10-28
- SEC 8-K Filing (2024-12-18)
- SEC 8-K Filing (2024-10-23)
- SEC 8-K Filing (2024-09-26)
- SEC 8-K Filing (2024-09-06)
- SEC 8-K Filing (2024-06-20)
- SEC 8-K Filing (2024-05-31)
- SEC Form 4 Insider Transaction (2026-05-04)
- SEC Form 4 Insider Transaction (2026-04-29)
- SEC Form 4 Insider Transaction (2026-04-29)
- SEC 10-K Annual Report — FY2024
- SEC 10-K Annual Report — FY2023
- SEC 10-K Annual Report — FY2022
- SEC 10-K Annual Report — FY2021
- SEC 10-K Annual Report — FY2020
Data sourced from Yahoo Finance and SEC EDGAR. Not investment advice.
Leave a Comment