
Expected price range
Each range is set from the stock’s recent price history and our Hold rating, using its own 1-year realised volatility (33% annualised) as the width of a ~68% statistical band, and checked against that rating so the range leans the same way as our view. Starting price $675 (close 2026-11-02). The stock traded between $529 and $709 over the last 6 months and between $462 and $709 over the last year. This is an illustration of where our view and normal volatility point, not a forecast, price target or investment advice; the stock can move outside it.
| Company | Nov 25 | Dec 25 | Jan 26 | Feb 26 | Mar 26 | Apr 26 | May 26 | Jun 26 | Jul 26 | Aug 26 | Sep 26 | Oct 26 | 12-Mo |
|---|---|---|---|---|---|---|---|---|---|---|---|---|---|
| DE | +1% | +1% | +13% | +19% | -10% | +5% | -8% | +17% | -7% | +11% | +3% | +1% | +48% |
| CAT | -0% | -1% | +15% | +13% | -5% | +26% | -2% | +22% | -23% | -2% | +2% | -23% | +9% |
| AGCO | +3% | -2% | +9% | +21% | -15% | +4% | -7% | +7% | -15% | +16% | -3% | -3% | +9% |
| CNH | -10% | -2% | +17% | +14% | -11% | -3% | -4% | +10% | -9% | +15% | +9% | -8% | +13% |
| OSK | +4% | -2% | +14% | +19% | -13% | +6% | -16% | +18% | -7% | +9% | -16% | +9% | +15% |
| TTC | -7% | +13% | +16% | +8% | -5% | +2% | -6% | +9% | -6% | +6% | -1% | +12% | +47% |
Source: Yahoo Finance monthly adjusted close.
Quick Thesis
- Rated hold — Deere’s premium valuation already discounts a recovery that is not yet fully visible.
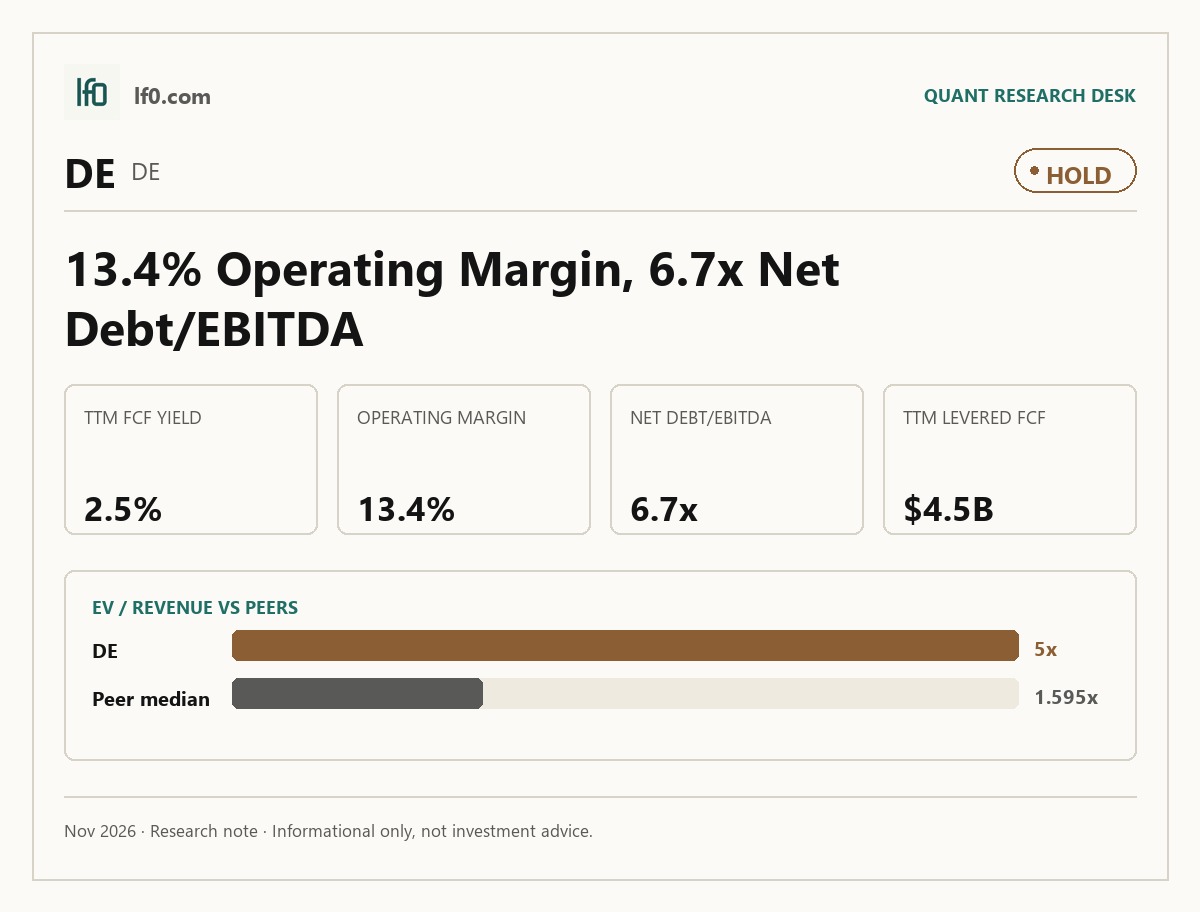
- Strongest support: $4.5B of levered free cash flow and a 2.5% FCF yield.
- Biggest risk: 6.7x net debt/EBITDA, with farm-cycle and credit pressure still present.
- Valuation is rich: 37.5x trailing P/E and 27.9x EV/EBITDA.
- I would turn more constructive if net debt/EBITDA moved below 5.5x, showing the cycle is stabilizing.
Executive Summary
Rating: HOLD | DE
We’ll begin tracking this call’s performance since publication once sufficient adjusted-close data is available.
I would put my rating as a Hold because Deere’s premium multiple already prices in a recovery that is not yet fully visible in the operating data. The company has a durable dealer and software franchise, but fiscal 2024 already showed lower sales volumes, higher discounts, and higher credit losses, so the market is paying for earnings that still need to prove themselves. In my view, the key question is whether Deere can convert its connected-equipment model into steadier margin expansion rather than just ride a cyclical rebound. I would raise my rating more towards a Buy if operating margin moves toward 15.0% while net debt/EBITDA falls below 5.5x, because that would show the business is compounding through the cycle rather than merely financing it.
Company Profile
Deere & Company, incorporated in Delaware in 1958, traces its manufacturing roots to 1837 and sells equipment through four segments: production and precision agriculture, small agriculture and turf, construction and forestry, and John Deere Financial. It earns revenue from equipment sales, parts, services, and financing income from retail notes, wholesale receivables, leases, revolving charge accounts, and extended warranties. In fiscal 2024, equipment operations generated $44.8B of net sales, with production and precision agriculture at $20.8B, small agriculture and turf at $11B, and construction and forestry at $13B.
Its footprint spans about 2,050 independent dealer locations in the U.S. and Canada, plus sales into more than 100 countries, with company-owned sales and service subsidiaries across Europe, Asia, Latin America, Africa, and Australia. John Deere Financial supports the equipment business in the U.S., Canada, and several overseas markets, and Deere indirectly owned 100% of John Deere Capital Corporation as of fiscal 2024.
Economic Moat
Business Model
The John Deere Operations Center, an online farm management system that records equipment use and agronomic work, is the hardest part of the model to replicate within 3 years, in my view, because it ties hardware, software, connectivity, and dealer support into a single workflow customers use across a season. Deere is pushing that stack through its Smart Industrial Operating Model, which links production systems, technology, and lifecycle solutions, and it is already measuring adoption through engaged acres, meaning unique acres with at least one recorded operation pass in the last 12 months. That gives Deere a recurring data relationship with customers, not just a one-time machine sale, so a rival would need to match both the equipment and the digital layer before it could dislodge Deere.
Secondary support comes from scale in distribution, with approximately 2,050 independent dealer locations in the U.S. and Canada and sales into over 100 countries, plus a broad patent and trademark portfolio that Deere says is important to its operations. I feel that this network is hard to copy quickly because the moat is not just product breadth; it is the installed base, the dealer touchpoints, and the software layer working together.
Business & Operating Risks
The biggest disclosed risk is the agricultural cycle itself, because Deere’s results largely depend on farm income, farmland values, debt levels, commodity prices, and government policy. That is already visible in the numbers: fiscal 2024 brought lower sales volumes, higher sales discounts, higher receivable write-offs, and a higher provision for credit losses, and the company expects some of those conditions to persist in fiscal 2025. This is not abstract boilerplate for Deere; weaker farm economics reduce equipment demand and also raise dealer and customer credit risk, so the risk has already started to hit revenue quality and credit costs.
A second company-specific risk is the financing arm, since the financial services segment provides financing for a significant portion of sales worldwide and is exposed to write-offs, credit losses, and funding access at cost-effective rates. The filing also says the segment can suffer residual value losses from lower used-equipment pricing and higher lease returns, which matters because Deere’s own sales engine depends on that credit channel staying open and profitable. Supply chain and tariff risk is the third material item: Deere says shortages, import tariffs, and trade agreements can significantly increase production and logistics costs, and it specifically notes single-supplier or proprietary components that cannot be sourced quickly. That risk is not hypothetical either, because the filing links prior logistics problems to delays, shortages of key manufacturing components, increased order backlogs, increased transportation costs, and production inefficiencies.
The disclosed risks do threaten the moat, but they do not break it. They pressure the financing and dealer network that support Deere’s advantage, yet the Operations Center and dealer scale still look structurally harder to copy than the cyclical earnings stream itself.
Management Discussion & Analysis
Management is responding to the cycle, but not yet to the point where I would call the risk fully defused. Deere’s workforce reduction announced on May 31, 2024 and disclosed on June 5, 2024 is a direct cost action, and it tells me management is trying to protect margins rather than waiting for the farm cycle to do the work. The company is also leaning harder into the technology stack and lifecycle services, which is the right response if the moat is going to be defended through recurring software and service revenue rather than only through machine shipments.
That said, the operating response is still early relative to the credit and discount pressure already showing up in fiscal 2024. Management is clearly trying to offset the disclosed risks, but the numbers have not yet shown a full repair in earnings quality.
Recent Events
The most significant development I see here is the workforce reduction announced on May 31, 2024 and disclosed on June 5, 2024. Deere is cutting production and salaried roles to reduce overlap and support strategic priorities, which strengthens the cost side of the thesis because it signals management is actively protecting margins rather than waiting for the cycle to do it for them.
The next material event was the November 1, 2024 board expansion from 11 to 12 directors and the appointment of R. Preston Feight, the chief executive officer of PACCAR Inc., to the board. In my view, that adds operating and commercial manufacturing experience at a time when Deere is managing a more disciplined footprint, so it modestly reinforces governance and execution credibility.
On November 21, 2024, Deere filed its fiscal fourth quarter 2024 results and investor presentation, and on December 3, 2024 it disclosed a quarterly dividend declaration. Those two disclosures together point in the same direction: the company is still generating enough cash to keep returning capital while it works through a softer operating backdrop, which leaves the investment case intact rather than weakened.
Financial Analysis
Growth
DE — Financial Growth (Quarterly, USD Mil)
| Metric | 2025-07-31 | 2025-10-31 | 2026-01-31 | 2026-04-30 | 2026-07-31 |
|---|---|---|---|---|---|
| REVENUE (USD Mil) | 11,783 | 12,094 | 9,344 | 13,092 | 12,352 |
| EBIT (USD Mil) | 2,394 | 2,187 | 1,555 | 3,005 | 2,592 |
| EBITDA (USD Mil) | 2,958 | 2,748 | 2,145 | 3,599 | 3,195 |
| NET INCOME (USD Mil) | 1,289 | 1,065 | 656 | 1,773 | 1,379 |
| DILUTED EPS | 4.8 | 3.9 | 2.4 | 6.5 | 5.1 |
Source: Yahoo Finance — Quarterly Financial Statements
Revenue fell from $12.1B in Q3 2025 to $9.3B in Q4 2025, then rebounded to $13.1B in Q1 2026 before easing to $12.4B in Q2 2026. On a year-over-year basis, revenue was up 11.3% in Q3 2025, down 2.2% in Q4 2025, up 40.1% in Q1 2026, and up 2.1% in Q2 2026. EBITDA moved faster than revenue in Q1 2026, rising 67.8% year over year to $3.6B, but slower in Q2 2026, up 8.9% to $3.2B. I read that pattern as seasonal rather than structural, so the growth signal is mixed rather than a clean bull case.
Profitability
DE — Profitability (TTM)
| Metric | TTM |
|---|---|
| Operating Margin (TTM) | 13.4% |
| Net Margin (TTM) | 10.2% |
| Return on Assets (TTM) | 3.8% |
| Return on Equity (TTM) | 18.2% |
| Gross Margin (TTM) | 25.2% |
| EBITDA Margin (TTM) | 17.9% |
Source: Yahoo Finance — Trailing Twelve Months (TTM)
TTM gross margin was 25.2%, EBITDA margin was 17.9%, operating margin was 13.4%, and net margin was 10.2%, so the business is already profitable at the operating line and still converting a solid share of sales into bottom-line earnings. The 11.8-point gap between gross and operating margin shows that overhead and selling costs still absorb a large slice of gross profit, which means investors should watch operating leverage rather than pricing power for the next leg of improvement. Net margin sits 3.2 points below operating margin, so financing and tax costs are present but not overwhelming. TTM return on assets was 3.8% and TTM return on equity was 18.2%, and that spread suggests returns are being amplified by leverage rather than pure asset productivity. The key signal to watch is further narrowing between gross and operating margin, because that would show the company is scaling into its cost base instead of relying on financial leverage.
Valuation
DE — Valuation Multiples
| Metric | Value |
|---|---|
| Current Share Price (USD) | 674 |
| Market Cap (USD Mil) | 181,736 |
| Enterprise Value (USD Mil) | 239,816 |
| Trailing P/E | 37.5 |
| Forward P/E | 29.6 |
| Price/Sales (TTM) | 3.8 |
| Price/Book (mrq) | 6.5 |
| EV/Revenue | 5 |
| EV/EBITDA | 27.9 |
| Beta (5Y Monthly) | 0.90 |
| FCF Yield % (TTM) | 2.5% |
| Forward EPS (USD) | 22.8 |
| Analyst Target Price – Low (USD) | 500 |
| Analyst Target Price – Mean (USD) | 694 |
| Analyst Target Price – High (USD) | 813.2 |
| # Analyst Opinions | 23 |
Source: Yahoo Finance
DE screens as expensive on every major valuation lens. The primary anchor is EV/Revenue at 5x, which implies the market is paying for a business that can keep converting a large industrial revenue base into mid-teens operating cash flow rather than a cyclical equipment maker. At the current share price of $674, that is not a cheap entry point.
Trailing P/E is 37.5x and forward P/E is 29.6x, so the market is already discounting a meaningful earnings step-up. Price/Sales is 3.8x and EV/EBITDA is 27.9x, both rich for a capital-intensive name, while Price/Book is 6.5x, which means investors are paying well above accounting equity for the franchise and the multiple is only justified if returns stay elevated. FCF yield is 2.5%, which is thin relative to the share price and tells me cash generation is not yet cheap enough to offset the premium. PEG ratio is 1.6x, so even on expected growth the stock is not obviously mispriced. Beta is 0.9, which lowers volatility but does not make the valuation easier to defend.
On the analysis here, I would put fair value in a range of $500–$813, which is the span implied by the analyst target low and high. That range brackets the current price, but the $694 mean target sits only modestly above the stock, so consensus is not calling for a major rerating. I would place my own fair value closer to the lower half of that band because I weight leverage and cash conversion more heavily than the market appears to. Forward EPS of 22.8 is above AGCO’s 7.2, CNH’s 0.7, OSK’s 13.2, and TTC’s 5.1, but Deere still trades at a much richer multiple than those peers, so the earnings base is solid without fully justifying the premium.
Leverage
DE — Leverage & Coverage (Quarterly)
| Metric | Value |
|---|---|
| Total Debt/Equity % (mrq) | 230.3 |
| Current Ratio (mrq) | 2.1 |
| Total Debt (mrq, USD Mil) | 64,578 |
| Operating Cash Flow (TTM, USD Mil) | 7,245 |
| Levered Free Cash Flow (TTM, USD Mil) | 4,516.2 |
| Net Debt/EBITDA (TTM) | 6.7 |
| FCF Margin % (TTM) | 9.4% |
Source: Yahoo Finance — Quarterly Financial Statements
DE’s leverage is elevated but not strained today. Total Debt/Equity is 230.3%, Current Ratio is 2.1, and Total Debt is $64.6B, so the balance sheet carries meaningful debt but still has near-term liquidity cushion. Total Cash is $6.9B, which helps absorb a downturn, while Net Debt/EBITDA is 6.7x, a level that leaves less room if earnings soften. Operating Cash Flow is $7.2B and Levered Free Cash Flow is $4.5B, so cash generation is solid, but FCF margin is 9.4%, which means a fair share of earnings is still consumed before reaching free cash flow.
That leverage profile matters because it limits how much of the operating upside can flow straight to equity holders. Deere can fund the business, but it does not have the balance-sheet flexibility of the cleaner peers in the group, so the premium multiple needs margin improvement and not just stable cash flow.
Insider Activity
The insider transaction record I see here is one-sided: 7 open-market sales and 0 open-market purchases over the 2025-02-18 to 2026-05-01 window, so insiders are net sellers. The pattern is concentrated, with Chairman & CEO May John C. II accounting for four sales on 2026-01-08 and Reed Cory J adding one sale on 2026-01-14, which suggests limited alignment support from open-market buying. Combined with insider ownership of only 0.2%, that is not a strong signal for conviction at the margin.
Comparable Analysis
LF0 has published standalone analyses of these peers: OSK (OSK) (rated Hold).
Growth
| Company | Revenue TTM (USD Mil) | Revenue Growth YoY % | EBITDA TTM (USD Mil) | Diluted EPS TTM |
|---|---|---|---|---|
| DE | 47,927 | 4.9% | 8,600 | 18 |
| CAT | 77,773 | 17.3% | 17,235 | 25.5 |
| AGCO | 10,135.3 | -8.6% | 972.2 | 3.9 |
| CNH | 18,185 | 2.0% | 1,054 | 0.2 |
| OSK | 10,763.3 | 5.7% | 985.5 | 7.9 |
| TTC | 4,753 | 8.4% | 673.6 | 3.7 |
Source: Yahoo Finance
DE’s 4.9% TTM revenue growth and 18.0 TTM diluted EPS trail CAT’s 17.3% revenue growth and 25.5 EPS, but they still beat AGCO’s -8.6% revenue decline and CNH’s 2.0% growth. That gap says Deere is not the fastest grower in the group, yet it is also not a cyclical laggard, so the market should not pay CAT’s growth premium.
Valuation
| Company | Current Share Price (USD) | Trailing P/E | Forward P/E | EV/Revenue | EV/EBITDA | Price/Sales (TTM) | Price/Book (mrq) | Market Cap (USD Mil) | Enterprise Value (USD Mil) | Beta (5Y Monthly) | FCF Yield % (TTM) | Forward EPS | Analyst Target Price – Low | Analyst Target Price – Mean | Analyst Target Price – High | # Analyst Opinions |
|---|---|---|---|---|---|---|---|---|---|---|---|---|---|---|---|---|
| DE | 674 | 37.5 | 29.6 | 5 | 27.9 | 3.8 | 6.5 | 181,736 | 239,816 | 0.90 | 2.5% | 22.8 | 500 | 694 | 813.2 | 23 |
| CAT | 626.8 | 24.6 | 19.5 | 4.2 | 18.8 | 3.7 | 13.4 | 288,147 | 324,003 | 1.64 | 1.4% | 32.1 | 575 | 859.5 | 1,150 | 26 |
| AGCO | 113.1 | 29.1 | 15.6 | 1 | 10.7 | 0.8 | 1.9 | 7,797 | 10,375 | 1.10 | 5.1% | 7.2 | 97 | 124 | 151 | 15 |
| CNH | 11.9 | 47.7 | 17.3 | 2.2 | 37.5 | 1.1 | 1.9 | 19,161 | 39,551 | 1.29 | 2.9% | 0.7 | 9 | 14.3 | 21 | 19 |
| OSK | 145 | 18.3 | 11 | 0.8 | 9.2 | 0.8 | 2 | 8,839 | 9,076 | 1.27 | 6.7% | 13.2 | 138 | 161 | 182.2 | 17 |
| TTC | 109.6 | 29.3 | 21.5 | 2.3 | 16.5 | 2.2 | 7.8 | 10,378 | 11,123 | 0.69 | 5.9% | 5.1 | 100 | 111 | 120 | 5 |
Source: Yahoo Finance
DE trades at 5.0x EV/Revenue, 37.5x trailing P/E, 29.6x forward P/E, and 3.8x Price/Sales, versus CAT at 4.2x EV/Revenue and 19.5x forward P/E, OSK at 0.8x and 11.0x, AGCO at 1.0x and 15.6x, CNH at 2.2x and 17.3x, and TTC at 2.3x and 21.5x. DE’s 2.5% FCF yield is better than CAT’s 1.4% and CNH’s 2.9%, but it still trails AGCO’s 5.1%, OSK’s 6.7%, and TTC’s 5.9%, so the stock is not cheap enough to justify its premium on cash generation alone. A $1 investment a year ago would be worth $1.48 in DE, versus $1.10 in CAT, $1.06 in AGCO, $1.14 in CNH, $1.17 in OSK, and $1.48 in TTC, so Deere has matched the best performer in the group over the last year. That tells me the market has already rerated the name, and the valuation now needs earnings follow-through rather than just sentiment.
Profitability
| Company | Operating Margin (TTM) | Net Margin (TTM) | Return on Assets (TTM) | Return on Equity (TTM) | Gross Margin (TTM) | EBITDA Margin (TTM) |
|---|---|---|---|---|---|---|
| DE | 13.4% | 10.2% | 3.8% | 18.2% | 25.2% | 17.9% |
| CAT | 20.5% | 15.2% | 9.3% | 56.1% | 30.2% | 22.2% |
| AGCO | 5.3% | 2.8% | 3.3% | 5.9% | 25.0% | 9.6% |
| CNH | 5.5% | 1.7% | 0.9% | 3.9% | 17.8% | 5.8% |
| OSK | 7.0% | 4.6% | 4.6% | 11.0% | 15.4% | 9.2% |
| TTC | 14.0% | 7.6% | 9.4% | 26.4% | 33.5% | 14.2% |
Source: Yahoo Finance
DE’s 13.4% operating margin, 10.2% net margin, 17.9% EBITDA margin, and 25.2% gross margin are all above AGCO’s 5.3%, 2.8%, 9.6%, and 25.0%, and above CNH’s 5.5%, 1.7%, 5.8%, and 17.8%, yet they trail CAT’s 20.5%, 15.2%, 22.2%, and 30.2% and TTC’s 14.0%, 7.6%, 14.2%, and 33.5%. The pattern looks more like a scale and mix gap than a pure cost-of-revenue problem, because Deere’s gross margin is solid but not best in class, while its operating margin is held back more than CAT’s by lower operating efficiency. ROE of 18.2% and ROA of 3.8% are respectable, but they are not enough to offset the valuation gap on their own.
Leverage
| Company | Total Debt/Equity % (mrq) | Current Ratio (mrq) | Total Debt (mrq, USD Mil) | Operating Cash Flow TTM (USD Mil) | Free Cash Flow TTM (USD Mil) | Net Debt/EBITDA (TTM) | FCF Margin % (TTM) |
|---|---|---|---|---|---|---|---|
| DE | 230.3 | 2.1 | 64,578 | 7,245 | 4,516.2 | 6.7 | 9.4% |
| CAT | 210.4 | 1.4 | 45,201 | 14,184 | 4,126.4 | 2.2 | 5.3% |
| AGCO | 65.5 | 1.3 | 2,852.6 | 545.2 | 400.5 | 2.5 | 4.0% |
| CNH | 335 | 4.9 | 26,311 | 1,784 | 563.1 | 23.6 | 3.1% |
| OSK | 24.2 | 1.7 | 1,101.1 | 1,133.3 | 594.9 | 0.6 | 5.5% |
| TTC | 80.7 | 1.6 | 1,078 | 789.3 | 608.1 | 1.3 | 12.8% |
Source: Yahoo Finance
DE’s 230.3% debt to equity and 6.7x net debt to EBITDA are far heavier than CAT’s 210.4% and 2.2x, AGCO’s 65.5% and 2.5x, OSK’s 24.2% and 0.6x, and TTC’s 80.7% and 1.3x, even though DE’s current ratio of 2.1 is healthier than CAT’s 1.4, AGCO’s 1.3, OSK’s 1.7, and TTC’s 1.6. The 9.4% FCF margin is stronger than CAT’s 5.3%, AGCO’s 4.0%, and CNH’s 3.1%, which means Deere is converting earnings to cash well, but the balance sheet still carries more financial risk than most peers. That leverage also explains part of the valuation premium: investors are paying for a stronger cash engine, but not for the cleanest balance sheet in the group.
Conclusion
I would put my rating as a Hold because Deere’s premium valuation already reflects a recovery that is not yet fully visible in the operating data, while the balance sheet and farm-cycle exposure still leave room for disappointment. The stock trades at 37.5x trailing P/E and 29.6x forward P/E, with a 2.5% FCF yield and 6.7x net debt/EBITDA, so investors are paying up for quality even though fiscal 2024 already showed lower sales volumes, higher receivable write-offs, and a higher provision for credit losses.
I would raise my rating more towards a Buy if the agricultural cycle stabilizes enough for revenue growth to hold above the low single digits while operating margin moves toward 15.0%, because that would show Deere is converting its connected-equipment model into durable earnings power rather than just riding a cyclical rebound. On the current $12.4B revenue base, a move from the current 13.4% operating margin to 15.0% would add roughly 200M of operating profit, which would help justify the premium multiple and shorten the payback period on the stock’s current price.
I would move from Hold to Sell if fiscal 2025 follows the same pattern as fiscal 2024, with lower equipment volumes, weaker dealer orders, and another step-up in credit costs, because that would tell me the market is paying for earnings that are already rolling over. A further rise in net debt to EBITDA above 7.0x, meaning leverage is moving farther from comfort rather than closer to it, would also make the equity harder to own because it would leave less room for a second leg of farm-income weakness or a funding shock in John Deere Financial.
Weighing both sides, I lean to Hold because the bull case depends on a cleaner farm cycle and better margin conversion that have not yet shown up in the reported numbers, while the bear case already has evidence in fiscal 2024 credit and discount pressure. The stock can work if the cycle turns, but I think the market is paying for that turn before it is proven.
What to Watch Next
- Operating margin at 15.0% — would support a move toward Buy.
- Net debt/EBITDA below 5.5x — would show balance-sheet repair is taking hold.
- Revenue growth holding above the low single digits — would confirm the cycle is stabilizing.
- Credit losses and sales discounts easing — would reduce the bear case.
- Dealer orders improving — would signal the farm cycle is turning before earnings do.
What’s your take? I rated Deere (DE) HOLD above — but the goal here is to get this right, not just to publish an opinion. What would you add to this analysis, or which risk or catalyst do you think I’m under- or over-weighting? Tell me in the comments.
Our track record: every directional call is tracked publicly on The Scorecard, and Stocks Covered lists every company we have rated and when.
Sources
- SEC 10-K Annual Report — filed 2024-12-12
- SEC 8-K Filing (2024-12-03)
- SEC 8-K Filing (2024-11-21)
- SEC 8-K Filing (2024-11-01)
- SEC 8-K Filing (2024-08-15)
- SEC 8-K Filing (2024-06-05)
- SEC 8-K Filing (2024-05-16)
- SEC Form 4 Insider Transaction (2026-05-04)
- SEC Form 4 Insider Transaction (2026-03-05)
- SEC Form 4 Insider Transaction (2026-03-05)
- SEC 10-K Annual Report — FY2024
- SEC 10-K Annual Report — FY2023
- SEC 10-K Annual Report — FY2022
- SEC 10-K Annual Report — FY2021
- SEC 10-K Annual Report — FY2020
Data sourced from Yahoo Finance and SEC EDGAR. Not investment advice.
Leave a Comment