
Expected price range
Each range is set from the stock’s recent price history and our Strong Sell rating, using its own 1-year realised volatility (80% annualised) as the width of a ~68% statistical band, and checked against that rating so the range leans the same way as our view. Starting price $25.65 (close 2026-10-30). The stock traded between $24.99 and $72.33 over the last 6 months and between $24.99 and $72.33 over the last year. This is an illustration of where our view and normal volatility point, not a forecast, price target or investment advice; the stock can move outside it.
| Company | Oct 25 | Nov 25 | Dec 25 | Jan 26 | Feb 26 | Mar 26 | Apr 26 | May 26 | Jun 26 | Jul 26 | Aug 26 | Sep 26 | 12-Mo |
|---|---|---|---|---|---|---|---|---|---|---|---|---|---|
| ENPH | -14% | -5% | +11% | +15% | +14% | -11% | -13% | +107% | -28% | -24% | -3% | -9% | -7% |
| FSLR | +21% | +2% | -4% | -14% | -13% | +0% | +2% | +52% | -23% | -11% | -4% | -13% | -21% |
| SEDG | -5% | +4% | -21% | +7% | +14% | +44% | -16% | +78% | -23% | -30% | -22% | -1% | -14% |
| ARRY | +6% | -13% | +23% | +23% | -33% | -5% | +7% | +17% | -18% | -30% | -15% | -9% | -51% |
| NXT | +37% | -9% | -5% | +34% | -10% | +15% | -1% | +31% | -24% | -25% | -9% | -5% | +5% |
| SHLS | +42% | -20% | +1% | +11% | -37% | +11% | +21% | +57% | -20% | -12% | -21% | +17% | +9% |
Source: Yahoo Finance monthly adjusted close.
Quick Thesis
- Rated Hold — the stock needs revenue stabilization before the multiple is easier to defend.
- Strongest support: $931.9M of cash and a 4.1x current ratio.
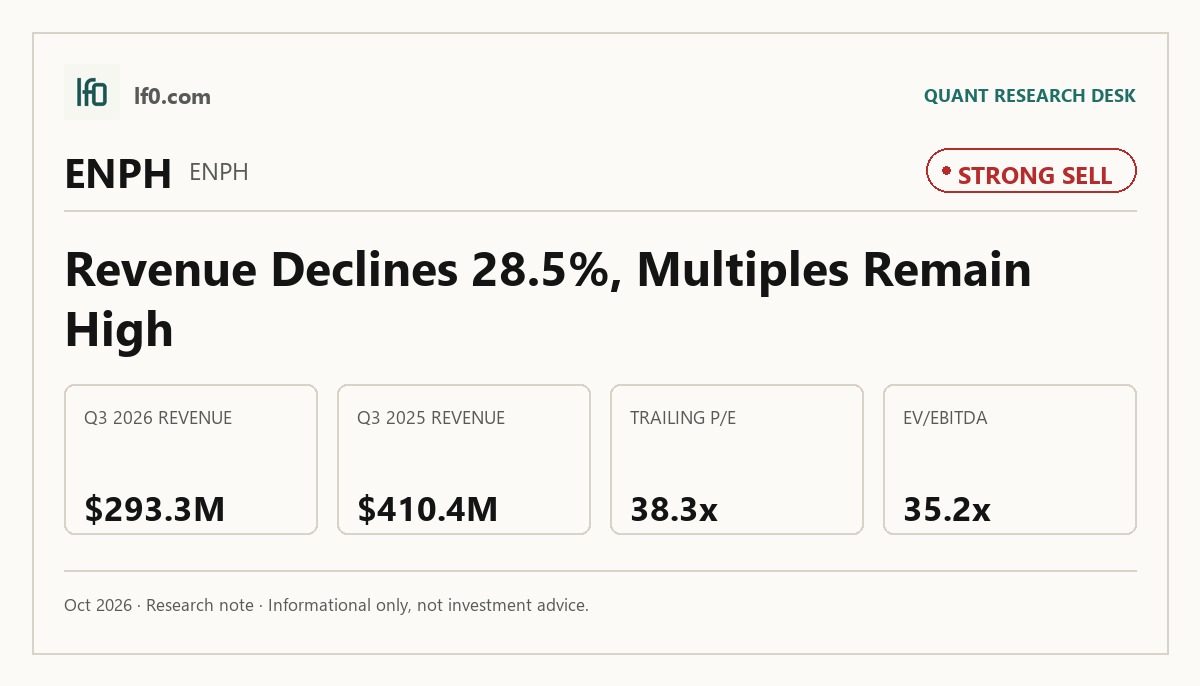
- Main risk: revenue fell 28.5% TTM to $1.2B.
- Valuation is rich at 2.5x EV/Revenue and 38.3x trailing P/E.
- I would raise my rating if quarterly revenue gets back above $343.3M and holds there.
Executive Summary
Rating: STRONG SELL | ENPH
We’ll begin tracking this call’s performance since publication once sufficient adjusted-close data is available.
I would put my rating as a Hold because Enphase has a defensible platform and a strong balance sheet, but the latest numbers still show a business that is shrinking faster than the market is rewarding it. Revenue fell from $410.4M in Q3 2025 to $293.3M in Q3 2026, and TTM revenue declined 28.5% to $1.2B, so the stock is still asking investors to pay for a recovery that has not yet shown up in the top line. I would become more constructive if quarterly revenue moves back above $343.3M, because that would show the post-policy reset is stabilizing rather than sliding further, and if operating margin turns positive on the same cost base.
Company Profile
Enphase Energy designs, manufactures, and sells home energy systems built around microinverters, batteries, load controllers, EV chargers, and cloud software. Revenue comes mainly through distributors, installers, original equipment manufacturers, and selected direct partners. As of December 31, 2025, the company had shipped about 86.4 million microinverters and deployed more than 5.1 million systems in over 160 countries, with the United States contributing 81% of net revenue in FY2025. It began shipping its IQ9N-3P commercial microinverter in December 2025 and started in-house manufacturing at its Arlington, Texas facility in November 2025, adding U.S. production alongside sites in South Carolina and Texas. The company had 2,872 full-time employees as of December 31, 2025, and still relies on contract manufacturing with Flex Ltd. and other suppliers.
Economic Moat
Business Model
The clearest moat element is the microinverter-plus-software architecture, which converts power at the individual solar module level and then manages solar, storage, and load control on one cloud-based platform. In my view, that system is hard to copy quickly because it is not just hardware; it depends on proprietary networking, firmware, installer software, and a large installed base that already spans approximately 86.4 million microinverters and more than 5.1 million deployed systems. The platform also has built-in redundancy in photovoltaic generation and energy storage, remote firmware updates, and 24/7 support, which makes it harder to displace than a standalone inverter. Secondary moat elements are narrower but still real: approximately 400 global patents and 200 pending patent applications, plus the Enphase App, Solargraf, and Enphase Care service layer, which deepen installer and homeowner switching costs.
The business has broadened meaningfully over time. In 2022, it was still centered on a fully integrated solar-plus-storage solution, and by 2025 the product set had expanded into EV charging, grid services, Solargraf, and Enphase Care. That matters for the moat because the company is now more like an energy management platform than a single-product inverter supplier, so the installed base can support cross-sell rather than just replacement demand.
Business & Operating Risks
The most material disclosed risk is the policy shock to solar demand. According to the risk factors in their SEC 10-K, the Section 25D credit for residential solar and storage systems expired on December 31, 2025, and solar-only projects that do not commence construction within 12 months of the OBBBA’s enactment must be placed in service by December 31, 2027 to keep the Section 48E credit. That is not generic boilerplate for a solar company; it directly raises the bar for installers and customers, so the risk is already affecting the business model rather than sitting in the background. The same filing says the average hourly export rate under California NEM 3.0 is about $0.05/kWh to $0.08/kWh versus $0.25/kWh to $0.35/kWh under NEM 2.0, which helps explain why California demand has become less attractive and why the company’s revenue mix is more exposed to policy than to pure product execution.
The second risk is domestic content and FEOC compliance. The filing says projects commencing construction after June 16, 2025 must meet a 45% domestic cost threshold and that escalating non-FEOC requirements begin in 2026. Enphase also discloses that its microinverters and residential battery systems use globally sourced components and that certain critical parts may come from jurisdictions that could be designated as FEOCs, so a compliance miss could strip tax-credit eligibility from products that installers are trying to sell. The third risk is trade and supply concentration, especially the disclosure that LFP battery cells for storage products are supplied solely via two suppliers in China. Tariffs or retaliation can hit both cost and availability at the same time, and the company does not have long-term supply contracts with contract manufacturers, so a disruption would be a shipment issue as well as a cost issue.
Taken together, these risks do threaten the moat, but they do not break the platform advantage itself; they mainly pressure the economics around it by making demand, sourcing, and tax-credit qualification less predictable.
Management Discussion & Analysis
Management is responding to the policy and sourcing risks, but the response is defensive rather than growth-oriented. The U.S. manufacturing footprint and partnership with Flex support domestic content qualification, while safe harbor agreements with TPO providers are helping offset weaker cash-and-loan demand after the Section 25D credit expired. That said, the same MD&A says those transactions created higher quarterly revenue variability, so investors should expect lumpier reported sales rather than a clean growth line. The domestic manufacturing push is now a requirement for preserving tax-credit economics, not just a strategic preference, and that is the clearest sign management is adapting to the tighter policy regime.
The numbers show why I am cautious. 2025 net revenues were $1.5B, and operating cash flow fell to $136.5M from $513.7M in 2024 because of $243M of prepaid income tax outflows, a $123M inventory build, and a $60.8M drop in deferred revenues. Management has executed on U.S. manufacturing and debt paydown, but repeated softness in demand and cash flow versus earlier optimism keeps the track record in the adequate, not high-confidence, range.
Recent Events
The most significant recent development is the January 20, 2026 restructuring plan, which cuts less than 6% of the workforce, or about 160 employees, and shifts some functions to lower-cost regions. I view that as a cost-control move that only strengthens the thesis if Enphase can actually hold the promised non-GAAP operating expense range of $70M to $75M per quarter from Q3 2026, because the plan is a direct test of whether the company can defend margins while demand remains uneven.
The March 31, 2026 tax credit transfer is the other material event. Enphase sold $235M of advanced manufacturing production tax credits for $218.6M, and the filing says the transaction will reduce Q1 2026 GAAP gross margin by about 6.7% percentage points versus prior guidance. I read that as a near-term accounting headwind, not an operating one, but it also shows the company is still leaning on tax assets to support reported results.
The May 13, 2026 annual meeting adds a governance wrinkle rather than a strategic one. Shareholders approved a 2M-share increase to the 2021 Equity Incentive Plan, which supports retention and hiring flexibility, but director Benjamin Kortlang won only a plurality and the board will review his election. Recent 8-Ks leave the investment case slightly weaker on reported margins but better controlled on costs, so the overall signal is mixed to modestly negative.
Financial Analysis
Growth
ENPH — Financial Growth (Quarterly, USD Mil)
| Metric | 2025-09-30 | 2025-12-31 | 2026-03-31 | 2026-06-30 | 2026-09-30 |
|---|---|---|---|---|---|
| REVENUE (USD Mil) | 410.4 | 343.3 | 282.9 | 291.9 | 293.3 |
| EBIT (USD Mil) | 77.8 | 39.5 | -13.2 | 62.2 | -3.2 |
| EBITDA (USD Mil) | 98.1 | 60 | 7.6 | 82.4 | 16.9 |
| NET INCOME (USD Mil) | 66.6 | 38.7 | -7.4 | 36.1 | 23.4 |
| DILUTED EPS | 0.5 | 0.3 | -0.1 | 0.3 | 0.2 |
Source: Yahoo Finance — Quarterly Financial Statements
Revenue fell from $410.4M in Q3 2025 to $293.3M in Q3 2026, and the latest three quarters show only a modest rebound from the Q1 trough rather than a real recovery. That is a sharp step-down from the Q3 2025 base, so I do not read the recent stabilization as proof of demand repair. EBITDA moved faster and more erratically than revenue, swinging from $98.1M in Q3 2025 to $7.6M in Q1 2026, then back to $82.4M in Q2 2026 and $16.9M in Q3 2026, which points to volatile operating leverage.
Profitability
ENPH — Profitability (TTM)
| Metric | TTM |
|---|---|
| Operating Margin (TTM) | 1.6% |
| Net Margin (TTM) | 7.5% |
| Return on Assets (TTM) | 0.2% |
| Return on Equity (TTM) | 8.1% |
| Gross Margin (TTM) | 24.4% |
| EBITDA Margin (TTM) | 7.2% |
Source: Yahoo Finance — Trailing Twelve Months (TTM)
TTM gross margin was 24.4%, EBITDA margin was 7.2%, operating margin was 1.6%, and net margin was 7.5%. The spread from gross margin to operating margin is wide, which tells me product economics are still intact but overhead and operating costs are absorbing most of the gross profit. TTM return on assets was 0.2% and return on equity was 8.1%, so the equity return is being amplified by leverage rather than by strong asset productivity. That is consistent with the moat described above: the platform has value, but the company is still not converting that advantage into strong operating profit.
Valuation
ENPH — Valuation Multiples
| Metric | Value |
|---|---|
| Current Share Price (USD) | 25.6 |
| Market Cap (USD Mil) | 3,394 |
| Enterprise Value (USD Mil) | 3,077 |
| Trailing P/E | 38.3 |
| Forward P/E | 17.9 |
| Price/Sales (TTM) | 2.8 |
| Price/Book (mrq) | 2.7 |
| EV/Revenue | 2.5 |
| EV/EBITDA | 35.2 |
| Beta (5Y Monthly) | 1.63 |
| FCF Yield % (TTM) | 3.1% |
| Forward EPS (USD) | 1.4 |
| Analyst Target Price – Low (USD) | 16 |
| Analyst Target Price – Mean (USD) | 40.6 |
| Analyst Target Price – High (USD) | 212 |
| # Analyst Opinions | 25 |
Source: Yahoo Finance
Enphase trades at 2.5x EV/Revenue, 2.8x price to sales, 38.3x trailing P/E, and 17.9x forward P/E, while the 3.1% FCF yield and 35.2x EV/EBITDA show the market is still paying for a recovery in earnings rather than for today’s cash generation. At the current share price of 25.6, the market is valuing the business as if margins will normalize, but the current 1.6% operating margin does not yet support that confidence.
On the analysis here, I would put fair value in a range of about $18-$30 per share. That range sits below the 40.6 analyst mean target and well below the 212 high, but it is still inside the broader consensus band, which tells me the Street is not uniformly bearish even though I am more cautious than the average target. I weight the weak growth and thin operating margin more heavily than the consensus appears to, so my range is lower than the mean target.
Forward EPS is 1.43, which is below FSLR’s $23.1 and NXT’s $5.8 in the peer set, so Enphase is not being priced for peer-leading earnings power. That makes the current multiple look rich relative to the earnings trajectory implied by the business, even though the balance sheet is stronger than many peers.
Leverage
ENPH — Leverage & Coverage (Quarterly)
| Metric | Value |
|---|---|
| Total Debt/Equity % (mrq) | 49.5 |
| Current Ratio (mrq) | 4.1 |
| Total Debt (mrq, USD Mil) | 614.6 |
| Operating Cash Flow (TTM, USD Mil) | 190.9 |
| Levered Free Cash Flow (TTM, USD Mil) | 105.2 |
| Net Debt/EBITDA (TTM) | -3.6 |
| FCF Margin % (TTM) | 8.7% |
Source: Yahoo Finance — Quarterly Financial Statements
Total debt was $614.6M in mrq, against a current ratio of 4.1x and total debt/equity of 49.5%, so the balance sheet is not stretched. Operating cash flow was $190.9M TTM and levered free cash flow was $105.2M TTM, which shows the business is still converting earnings into cash despite a weak operating backdrop. Net debt/EBITDA was -3.6x TTM, helped by $931.9M of total cash in mrq, so liquidity is ample and refinancing risk is low unless cash falls sharply or debt rises before the next maturity window. FCF margin was 8.7% TTM, which is a decent cash conversion rate and supports financial flexibility.
Insider Activity
The insider transaction record I see here is net selling, with 40 filings, $12.3M of open-market sales versus $782,755 of open-market purchases across 40 filings in a limited sample window from 2025-01-14 to 2026-06-01. The activity is not broad across many insiders, but it is concentrated in a large March sale by one director and repeated smaller sales by another director, while the CEO bought stock in late May. In my view, that makes the pattern a bear signal because the open-market selling is materially larger than the buying even though it is not fully uniform across the insider group.
Comparable Analysis
Growth
| Company | Revenue TTM (USD Mil) | Revenue Growth YoY % | EBITDA TTM (USD Mil) | Diluted EPS TTM |
|---|---|---|---|---|
| ENPH | 1,211.4 | -28.5% | 87.3 | 0.7 |
| FSLR | 5,014.1 | -22.8% | 2,481.7 | 17.3 |
| SEDG | 1,332.3 | 19.6% | -121.1 | -4.5 |
| ARRY | 1,185 | -5.6% | 119.4 | -1 |
| NXT | 3,834.3 | 22.5% | 779.6 | 4 |
| SHLS | 588.1 | 47.4% | 100.6 | 0.2 |
Source: Yahoo Finance
ENPH’s revenue fell 28.5% TTM to $1.2B, while FSLR declined 22.8%, ARRY fell 5.6%, and NXT still grew 22.5% and SHLS grew 47.4%. That puts ENPH in the weakest growth bucket in the set, and the premium growth multiple is hard to defend when the only clear growth leaders are NXT and SHLS, both of which are still expanding top line while ENPH is contracting.
Valuation
| Company | Current Share Price (USD) | Trailing P/E | Forward P/E | EV/Revenue | EV/EBITDA | Price/Sales (TTM) | Price/Book (mrq) | Market Cap (USD Mil) | Enterprise Value (USD Mil) | Beta (5Y Monthly) | FCF Yield % (TTM) | Forward EPS | Analyst Target Price – Low | Analyst Target Price – Mean | Analyst Target Price – High | # Analyst Opinions |
|---|---|---|---|---|---|---|---|---|---|---|---|---|---|---|---|---|
| ENPH | 25.6 | 38.3 | 17.9 | 2.5 | 35.2 | 2.8 | 2.7 | 3,394 | 3,077 | 1.63 | 3.1% | 1.4 | 16 | 40.6 | 212 | 25 |
| FSLR | 174.4 | 10.1 | 7.5 | 3.5 | 7 | 3.7 | 1.7 | 18,743 | 17,446 | 1.79 | 3.7% | 23.1 | 191 | 274.2 | 402 | 30 |
| SEDG | 30 | — | 37.4 | 1.3 | -14.1 | 1.4 | 4.5 | 1,849 | 1,709 | 1.44 | 6.2% | 0.8 | 26 | 37.1 | 100 | 19 |
| ARRY | 3.4 | — | 3.6 | 1.2 | 12.3 | 0.4 | -2.6 | 522 | 1,466 | 1.81 | 25.3% | 0.9 | 4 | 6.9 | 12 | 22 |
| NXT | 79.3 | 20 | 13.7 | 2.9 | 14.1 | 3.2 | 4.5 | 12,188 | 10,988 | 1.94 | 3.2% | 5.8 | 70 | 129.4 | 170 | 28 |
| SHLS | 7.2 | 37.9 | 13 | 2.4 | 14.2 | 2.1 | 2 | 1,212 | 1,430 | 1.85 | -3.5% | 0.6 | 6.5 | 11.1 | 15 | 18 |
Source: Yahoo Finance
ENPH trades at 2.5x EV/Revenue, 38.3x trailing P/E, 17.9x forward P/E, and 3.1% FCF yield, versus FSLR at 3.5x, 10.1x, 7.5x, and 3.7%; NXT at 2.9x, 20.0x, 13.7x, and 3.2%; SHLS at 2.4x, 37.9x, 13.0x, and -3.5%; and ARRY at 1.2x, no trailing P/E, 3.6x, and 25.3%. ENPH’s valuation is richer than FSLR and NXT on earnings, but not backed by better growth, so I do not think the multiple is justified. Using peer EV/Revenue of 1.2x to 3.5x on ENPH’s $1.2B revenue implies an enterprise value of about $1.5B to $4.2B, or roughly $9.0 to $29.2 per share after netting $317M of net cash and dividing by 132.3M shares, which brackets the current price but leaves little room for disappointment.
Profitability
| Company | Operating Margin (TTM) | Net Margin (TTM) | Return on Assets (TTM) | Return on Equity (TTM) | Gross Margin (TTM) | EBITDA Margin (TTM) |
|---|---|---|---|---|---|---|
| ENPH | 1.6% | 7.5% | 0.2% | 8.1% | 24.4% | 7.2% |
| FSLR | 44.4% | 37.1% | 8.6% | 18.7% | 49.2% | 49.5% |
| SEDG | -6.5% | -20.3% | -3.8% | -58.4% | 21.2% | -9.1% |
| ARRY | 10.9% | -7.2% | 3.3% | -26.0% | 26.8% | 10.1% |
| NXT | 18.7% | 16.0% | 11.1% | 26.5% | 23.1% | 20.3% |
| SHLS | 13.8% | 5.4% | 5.8% | 5.3% | 32.1% | 17.1% |
Source: Yahoo Finance
ENPH’s gross margin of 24.4%, EBITDA margin of 7.2%, operating margin of 1.6%, and net margin of 7.5% all trail FSLR’s 49.2%, 49.5%, 44.4%, and 37.1%, and NXT’s 23.1%, 20.3%, 18.7%, and 16.0%; it is closer to SHLS on gross margin at 32.1% but still lags on operating margin at 13.8%. The pattern points more to scale and opex pressure than to a pure cost-of-revenue problem, because ENPH’s gross margin is not the worst in the group but its operating margin is far weaker.
Leverage
| Company | Total Debt/Equity % (mrq) | Current Ratio (mrq) | Total Debt (mrq, USD Mil) | Operating Cash Flow TTM (USD Mil) | Free Cash Flow TTM (USD Mil) | Net Debt/EBITDA (TTM) | FCF Margin % (TTM) |
|---|---|---|---|---|---|---|---|
| ENPH | 49.5 | 4.1 | 614.6 | 190.9 | 105.2 | -3.6 | 8.7% |
| FSLR | 3 | 2.6 | 325 | 839.2 | 687.8 | -0.5 | 13.7% |
| SEDG | 98.9 | 2 | 407.4 | 114.1 | 113.8 | 1.2 | 8.5% |
| ARRY | 254.3 | 2.2 | 752.9 | 162.9 | 132.2 | 3.7 | 11.2% |
| NXT | — | 2.2 | 0 | 573.9 | 385.6 | -1.3 | 10.1% |
| SHLS | 37.9 | 2.2 | 233.8 | -19.3 | -43 | 2.2 | -7.3% |
Source: Yahoo Finance
ENPH’s total debt to equity is 49.5%, current ratio is 4.1x, net debt to EBITDA is -3.6x, and FCF margin is 8.7%, versus FSLR at 3.0%, 2.6x, -0.5x, and 13.7%; NXT at no disclosed debt/equity, 2.2x, -1.3x, and 10.1%; SHLS at 37.9%, 2.2x, 2.2x, and -7.3%; and ARRY at 254.3%, 2.2x, 3.7x, and 11.2%. ENPH’s negative net debt position is a real balance-sheet advantage, and it helps explain why the stock can trade at a premium to weaker peers even though the operating profile is not best in class.
Conclusion
I would put my rating as a Hold because the balance sheet gives Enphase time, but the business still has to prove that revenue can stabilize before the multiple looks justified. The key tension is that the company has a strong liquidity cushion and a defensible platform, yet revenue is still down 28.5% TTM and the latest quarter only got back to $293.3M, which is not enough for me to call the recovery durable.
I would raise my rating more towards a Buy if quarterly revenue gets back above $343.3M and holds there for two quarters, because that would show the post-policy reset is stabilizing rather than sliding further. I would also want to see operating margin move back into positive territory, meaning the business is actually earning money from operations again, and non-GAAP operating expense stay inside the $70M to $75M quarterly range from Q3 2026, because that would show management can protect margins while demand remains uneven. If those conditions are met, the current 2.5x EV/Revenue multiple would be easier to defend because earnings and cash conversion would be improving at the same time.
The bear case is that revenue stays stuck near the recent $290M level while gross margin remains pressured by policy, sourcing, and tariff friction. If that happens, the 1.6% operating margin and 7.2% EBITDA margin would keep the stock priced on hope rather than earnings power, and the 38.3x trailing P/E would look even harder to justify if quarterly EPS slips back toward the Q1 2026 loss. I would move from Hold to Sell if the next two quarters show both sub-$300M revenue and no margin recovery, because that would confirm the business is not just volatile but still losing operating leverage.
Weighing both sides, I lean to the bear case arriving first because the revenue trend has already broken and the policy backdrop is still tightening. The balance sheet gives Enphase time, but it does not by itself create earnings, and I do not think the current share price fully discounts how much proof is still needed before this deserves a higher rating.
What to Watch Next
- Quarterly revenue above $343.3M — would support a move toward Buy.
- Revenue staying below $300M — would keep the Hold case under pressure.
- Operating margin turning positive — would show operating leverage is returning.
- Non-GAAP operating expense inside $70M–$75M per quarter — would support margin defense.
- Gross margin staying under pressure — would keep the valuation multiple hard to justify.
What’s your take? I rated Enphase Energy (ENPH) STRONG SELL above — but the goal here is to get this right, not just to publish an opinion. What would you add to this analysis, or which risk or catalyst do you think I’m under- or over-weighting? Tell me in the comments.
Our track record: every directional call is tracked publicly on The Scorecard, and Stocks Covered lists every company we have rated and when.
Sources
- SEC 10-K Annual Report — filed 2026-02-17
- SEC 8-K Filing (2026-05-15)
- SEC 8-K Filing (2026-04-28)
- SEC 8-K Filing (2026-04-06)
- SEC 8-K Filing (2026-02-03)
- SEC 8-K Filing (2026-01-23)
- SEC Form 4 Insider Transaction (2026-06-04)
- SEC Form 4 Insider Transaction (2026-05-26)
- SEC Form 4 Insider Transaction (2026-05-21)
- SEC 10-K Annual Report — FY2026
- SEC 10-K Annual Report — FY2025
- SEC 10-K Annual Report — FY2024
- SEC 10-K Annual Report — FY2023
- SEC 10-K Annual Report — FY2022
Data sourced from Yahoo Finance and SEC EDGAR. Not investment advice.
Leave a Comment