
Expected price range
Each range is a ~68% statistical band built from the stock’s own 1-year realised volatility (28% annualised), centred on a path that closes a quarter of the gap to our fair-value midpoint by 3 months and half by 6 months. Starting price $80.52 (close 2026-10-20). This is an illustration of where our view and normal volatility point, not a forecast, price target or investment advice; the stock can move outside it.
| Company | Oct 25 | Nov 25 | Dec 25 | Jan 26 | Feb 26 | Mar 26 | Apr 26 | May 26 | Jun 26 | Jul 26 | Aug 26 | Sep 26 | 12-Mo |
|---|---|---|---|---|---|---|---|---|---|---|---|---|---|
| ADM | +1% | +1% | -5% | +17% | +3% | +5% | +3% | +8% | -4% | +4% | +3% | -2% | +37% |
| ALTO | -6% | +152% | +13% | -13% | -9% | +112% | +14% | -1% | +5% | -16% | -17% | -7% | +242% |
| GPRE | +17% | +0% | -5% | +17% | +20% | +20% | +6% | -10% | -2% | +10% | -14% | +4% | +71% |
| GEVO | +19% | -9% | -7% | -2% | -7% | +50% | -30% | -3% | -19% | -1% | +12% | -20% | -33% |
| MEOH | -1% | -9% | +12% | +20% | +6% | +18% | +10% | -10% | -22% | +20% | +6% | -0% | +50% |
Source: Yahoo Finance monthly adjusted close.
Quick Thesis
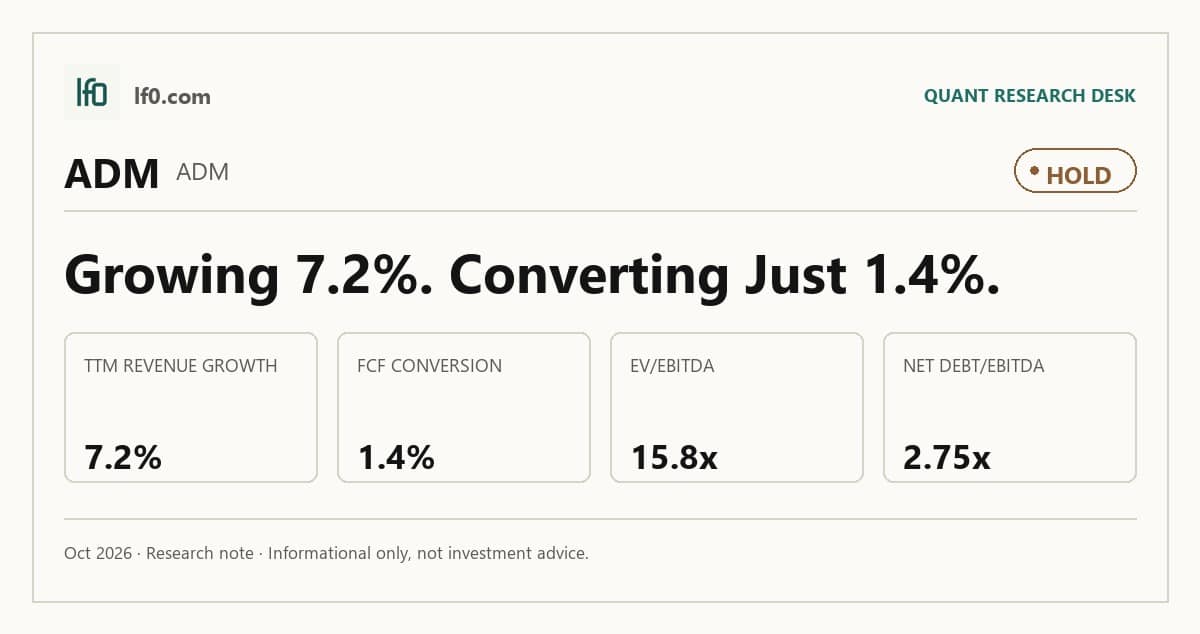
- Rated Hold — ADM’s cash generation is real, but margins are still too thin.
- Strongest strength: $1.2B of levered free cash flow TTM.
- Main risk: 2.8x net debt/EBITDA, which leaves limited room if spreads weaken.
- Valuation is fair to slightly rich at 15.8x EV/EBITDA and 3.0% FCF yield.
- I would turn more constructive if operating margin moves above 4.0%.
Executive Summary
Rating: HOLD | ADM
Measured from adjusted close on 2026-10-20 to 2026-10-20. Sell ratings are correct when the stock falls; Hold is tracked as a +/-10% range. Daily-close data, not intraday. Calls are tracked for 182 days from publication, then frozen as a final record.
I would put my rating as a Hold because ADM’s logistics network and Nutrition franchise are durable, but the current valuation already discounts that durability while the earnings profile still looks thin. The company’s integrated origination, transport, and processing footprint is hard to replicate quickly, yet TTM operating margin is only 4.0% and net margin is 2.2%, so the market is paying for resilience more than for clear margin expansion.
I would raise my rating more towards a Buy if ADM can hold EBITDA above $1.5B in the next two quarters and convert the announced $500M-plus cost program into visible margin lift. That would show the simplification plan is working rather than just sounding good, and it would make the current multiple easier to justify. I would move from Hold to Sell if EBITDA slips back below $1.2B or if FCF margin stays near 1.4% while working capital and energy costs remain elevated.
Company Profile
Archer-Daniels-Midland Company buys, stores, transports, crushes, mills, and processes agricultural commodities into food, feed, fuel, and industrial ingredients. It earns revenue through three segments: Ag Services and Oilseeds, which handles origination, merchandising, transportation, storage, and oilseed crushing; Carbohydrate Solutions, which turns corn and wheat into sweeteners, starches, ethanol, and feed ingredients; and Nutrition, which sells plant proteins, flavors, colors, probiotics, enzymes, and specialty feed products.
Founded in 1902, ADM has built a global platform across North America, Latin America, Europe, the Middle East and Africa, and Asia-Pacific. It also owns a 22.5% stake in Wilmar International Limited, a Singapore-listed agribusiness partner, and had 41,496 employees as of December 31, 2025. The business is financed through operating cash flow, working capital facilities, and long-term debt.
Economic Moat
Business Model
The hardest part of ADM to replicate within 3 years, in my view, is the integrated origination, logistics, and manufacturing network. According to its SEC filings, the company owns or leases trucks, trailers, railroad tank and hopper cars, river barges, towboats, and ocean-going vessels that move commodities and processed products across a global footprint, and a new entrant would need to rebuild both sourcing relationships and transport capacity before matching that reach.
Nutrition adds a second layer to the moat. More than $579M of trademarks, brands, recipes, and other intellectual property sits in that segment, and the portfolio of probiotics, enzymes, plant-based proteins, flavors, and colors gives ADM more ways to serve customers than a single-commodity processor. That mix is consistent with the 4.0% operating margin in the TTM financials: the moat is real, but it is still translating into only modest economics.
Business & Operating Risks
The most material disclosed risk is commodity and logistics volatility, because ADM’s own filing ties it directly to working capital, margins, and the ability to move product. The company says working capital requirements are directly affected by the price of global commodities, and that higher electricity, natural gas, coal, rail, diesel, ocean freight, and port costs can hurt production costs and operating results.
That risk is not abstract. ADM’s model depends on uninterrupted transport, energy, and raw material access across more than 180 countries, so a disruption in rivers, rail, or ports would hit earnings before management can offset it elsewhere. The filing also says a major lack of available water in certain processing operations could have a material adverse impact, which matters because the processing footprint is large and geographically dispersed.
Execution risk is the next layer. ADM is trying to reduce third-party spend and SG&A, simplify the portfolio, and pursue organic and inorganic growth, but those plans may be more difficult, costly, or time-consuming than expected. Integration risk, goodwill impairment risk, and system conversion risk are all real, especially when the company is also trying to reshape the asset base.
The disclosed risks do not break the moat, but they do pressure it: the logistics network that supports ADM’s advantage is also the channel through which commodity, freight, and water shocks can erode returns.
Management Discussion & Analysis
Management is actively responding to the risks above through simplification and cost control, but the financial results show the response is still early. On February 4, 2025, ADM announced actions expected to deliver more than $500M of cumulative cost savings over the next 3 to 5 years, which is the right answer to margin pressure if it actually flows through to operating income.
The portfolio moves point in the same direction. ADM acquired Vandamme Hugaria Kft, a 700 metric ton/day non-genetically modified crush and extraction facility in Hungary, while closing the Tres Corações facility in Brazil and launching or agreeing to joint ventures in cottonseed and animal feed. I read that as disciplined capital allocation in intent, but the 2025 numbers still show the cost of transition: total segment operating profit fell 23% to $3.2B, earnings before income taxes fell 44%, and ADM booked $473M of asset impairment, exit, and restructuring costs.
The digital reset is similar. Management shifted away from large global implementations toward regional projects, yet still recognized a $179M impairment charge on previously capitalized internal-use software in 2025. That tells me the prior technology spend did not earn its keep, and it is a reminder that simplification only helps if it lowers capital intensity and improves returns.
Recent Events
The January 27, 2026 SEC settlement removed the biggest governance overhang. ADM closed the intersegment sales investigation for a $40M civil penalty, and the related DOJ probe ended as well, which strengthens the investment case because it clears a major credibility issue rather than just a legal nuisance.
A second positive step came on March 9, 2026, when the board expanded from 12 to 13 directors and elected Michael C. McMurray as an independent director, with seats on the Audit Committee and the Sustainability and Technology Committee. That looks like a modest governance reset, and it supports the view that ADM is trying to rebuild oversight after the investigation.
The May 7, 2026 annual meeting added a capital-allocation angle: shareholders approved a 9.0 million-share increase to the 2020 Incentive Compensation Plan. That gives management more equity currency for retention and incentives, but it also raises dilution risk if awards are not tightly tied to performance.
Financial Analysis
Growth
ADM — Financial Growth (Quarterly, USD Mil)
| Metric | 2025-03-31 | 2025-06-30 | 2025-09-30 | 2025-12-31 | 2026-03-31 | 2026-06-30 |
|---|---|---|---|---|---|---|
| REVENUE (USD Mil) | — | 21,166 | 20,372 | 18,556 | 20,490 | 22,681 |
| EBIT (USD Mil) | — | 508 | 300 | 618 | 533 | 1,236 |
| EBITDA (USD Mil) | — | 799 | 596 | 925 | 826 | 1,529 |
| NET INCOME (USD Mil) | — | 219 | 108 | 456 | 298 | 908 |
| DILUTED EPS | 0.6 | 0.5 | 0.2 | 0.9 | 0.6 | — |
Source: Yahoo Finance — Quarterly Financial Statements
ADM’s revenue rose from $20.4B in Q3 2025 to $18.6B in Q4 2025, then recovered to $20.5B in Q1 2026 and $22.7B in Q2 2026. The latest two quarters show a 10.8% sequential rebound from the Q4 trough, and revenue was up 7.2% year over year in Q2 2026, which points to a firmer top line after the dip.
EBITDA moved faster than revenue, from $799M in Q2 2025 to $1.5B in Q2 2026. That is the more important signal for me: ADM is not just growing volume, it is getting some operating leverage back, which matters because the moat only becomes investable if the network starts to earn better returns.
Profitability
ADM — Profitability (TTM)
| Metric | TTM |
|---|---|
| Operating Margin (TTM) | 4.0% |
| Net Margin (TTM) | 2.2% |
| Return on Assets (TTM) | 2.3% |
| Return on Equity (TTM) | 7.6% |
| Gross Margin (TTM) | 6.9% |
| EBITDA Margin (TTM) | 3.6% |
Source: Yahoo Finance — Trailing Twelve Months (TTM)
TTM operating margin of 4.0%, gross margin of 6.9%, and EBITDA margin of 3.6% show a business that still earns only a thin spread after cost of goods sold and overhead. The 2.9 percentage point gap between gross and operating margin means selling, administrative, and other operating costs absorb most of the gross profit, so cost discipline matters more than simple volume growth.
TTM net margin of 2.2% leaves little cushion, while return on assets of 2.3% and return on equity of 7.6% indicate only modest capital efficiency. The ROE premium over ROA suggests leverage is helping returns more than underlying asset productivity is, which is not the profile I want to pay a premium multiple for.
Valuation
ADM — Valuation Multiples
| Metric | Value |
|---|---|
| Current Share Price (USD) | 80.5 |
| Market Cap (USD Mil) | 38,795 |
| Enterprise Value (USD Mil) | 47,351 |
| Trailing P/E | 22.1 |
| Forward P/E | 14.2 |
| Price/Sales (TTM) | 0.5 |
| Price/Book (mrq) | 1.6 |
| EV/Revenue | 0.6 |
| EV/EBITDA | 15.8 |
| Beta (5Y Monthly) | 0.63 |
| FCF Yield % (TTM) | 3.0% |
| Forward EPS (USD) | 5.7 |
| Analyst Target Price – Low (USD) | 60 |
| Analyst Target Price – Mean (USD) | 80.3 |
| Analyst Target Price – High (USD) | 95 |
| # Analyst Opinions | 10 |
Source: Yahoo Finance
ADM trades at 0.6x enterprise value to revenue, 0.5x price to sales, and 15.8x enterprise value to EBITDA. At a current share price of $80.5, the market is paying less than 0.5x annual sales for a business that still generated $2.8B of operating cash flow over the last twelve months, so the message is that investors are pricing in thin margins and limited earnings durability rather than a rerating.
The 22.1x trailing P/E and 14.2x forward P/E are less useful than the sales and cash-flow anchors here because ADM’s TTM operating margin is only 4.0% and EBITDA margin is 3.6%. FCF yield is 3.0%, which is modest for a cyclical agribusiness, and price to book is 1.6x, with book value per share of $48.9 and total cash per share of $2.3.
On the analysis here, I would put fair value in a range of roughly $75–$85 per share. That sits close to the $80.3 analyst mean target across 10 opinions, so my range is not a sharp disagreement with consensus; it is a narrower view that reflects ADM’s low cash conversion and only modest margin improvement. Forward EPS of $5.7 is solid in absolute terms, but on a like-for-like basis the earnings power still looks less efficient than the cleaner peers because the company is converting revenue into cash at a much lower rate.
Leverage
ADM — Leverage & Coverage (Quarterly)
| Metric | Value |
|---|---|
| Total Debt/Equity % (mrq) | 39.1 |
| Current Ratio (mrq) | 1.4 |
| Total Debt (mrq, USD Mil) | 9,342 |
| Operating Cash Flow (TTM, USD Mil) | 2,795 |
| Levered Free Cash Flow (TTM, USD Mil) | 1,164.6 |
| Net Debt/EBITDA (TTM) | 2.8 |
| FCF Margin % (TTM) | 1.4% |
Source: Yahoo Finance — Quarterly Financial Statements
ADM’s leverage is manageable, not stretched. Total debt to equity was 39.1%, current ratio was 1.4, and total debt was $9.3B, which gives the company some balance-sheet cushion but not a large one.
Operating cash flow was $2.8B and levered free cash flow was $1.2B, so cash generation is enough to service debt and fund operations, but the gap between EBITDA and free cash flow shows that a meaningful share of earnings is absorbed by capex, working capital, or other cash uses. Net debt to EBITDA was 2.8x, which is a moderate leverage load for a cyclical processor and leaves room to absorb a downturn, though refinancing risk would rise if EBITDA weakened or rates stayed elevated into a maturity window.
I would frame the EPS range as roughly $5.5–$6.0 over the next year if margins keep improving at the current pace. That is not a heroic forecast, but it is enough to keep ADM from looking expensive on earnings alone; the problem is that the cash yield still lags the earnings multiple, so the balance sheet supports resilience rather than a premium valuation.
Insider Activity
The insider transaction record I see here is net selling, with 4 open-market sales totaling $10.1M against just 1 open-market purchase totaling $486,720. The selling is fairly broad because four insiders transacted, not just one person, and the sample window is limited to 2025-01-02 through 2026-03-20.
I do not read that as a thesis-breaker, but it does not help the case either. When insiders are selling into a period of improving earnings, I want to see the margin and free-cash-flow trend improve first before treating the stock as a clear buy.
Comparable Analysis
LF0 has published standalone analyses of these peers: Green Plains (GPRE) (rated Hold).
Growth
| Company | Revenue TTM (USD Mil) | Revenue Growth YoY % | Diluted EPS TTM |
|---|---|---|---|
| ADM | 82,099 | 7.2% | 3.6 |
| ALTO | 943.3 | 12.5% | 0.7 |
| GPRE | 1,829.4 | -19.3% | 1.6 |
| GEVO | 177.5 | 7.1% | -0.9 |
| MEOH | 4,265.2 | 75.2% | 1 |
Source: Yahoo Finance
ADM’s revenue growth of 7.2% TTM is ahead of GEVO’s 7.1% and well above GPRE’s -19.3%, but it trails ALTO’s 12.5% and MEOH’s 75.2%. That makes ADM a steadier operator than the weaker ethanol names, yet not a growth leader, so I would not pay a growth premium for it.
Valuation
| Company | Current Share Price (USD) | Trailing P/E | Forward P/E | EV/Revenue | EV/EBITDA | Price/Sales (TTM) | Price/Book (mrq) | Beta (5Y Monthly) | FCF Yield % (TTM) | Forward EPS | Analyst Target Price – Low | Analyst Target Price – Mean | Analyst Target Price – High | # Analyst Opinions |
|---|---|---|---|---|---|---|---|---|---|---|---|---|---|---|
| ADM | 80.5 | 22.1 | 14.2 | 0.6 | 15.8 | 0.5 | 1.6 | 0.63 | 3.0% | 5.7 | 60 | 80.3 | 95 | 10 |
| ALTO | 3.5 | 5.2 | 10.6 | 0.3 | 5.3 | 0.3 | 1 | 0.15 | 8.3% | 0.3 | 7 | 8.3 | 10 | 3 |
| GPRE | 14.2 | 8.8 | 8.8 | 0.7 | 6.6 | 0.5 | 1.1 | 1.15 | 3.3% | 1.6 | 15 | 18.5 | 20 | 6 |
| GEVO | 1.1 | — | 19 | 2.2 | -16.7 | 1.6 | 1 | 1.14 | 6.6% | 0.1 | 1.7 | 5.2 | 14 | 4 |
| MEOH | 62.7 | 62.1 | 9.7 | 1.9 | 7.2 | 1.1 | 1.9 | 0.98 | 14.6% | 6.5 | 55 | 71.8 | 80 | 10 |
Source: Yahoo Finance
ADM’s FCF yield of 3.0% is below ALTO’s 8.3%, GEVO’s 6.6%, and MEOH’s 14.6%, while its EV/EBITDA of 15.8x is above ALTO’s 5.3x, GPRE’s 6.6x, and MEOH’s 7.2x. Using the peer EV/revenue range against ADM’s $82.1B of TTM revenue gives an implied enterprise value of roughly $28.7B to $180.6B, or about $40.3 to $356.0 per share after netting debt and cash; that wide band is only illustrative, but it shows ADM sits below the peer median on revenue multiple while still trading at a premium to the cash-generating peers on FCF yield.
ADM’s 1-year total return of 31.1% means $1 invested a year ago is now worth $1.31, ahead of GPRE’s $1.22 and far behind ALTO’s $3.09 but well above GEVO’s $0.43. The market has already given ADM some credit for a recovery, so the valuation case now depends on whether margins and cash conversion catch up.
Profitability
| Company | Operating Margin (TTM) | Net Margin (TTM) | Return on Assets (TTM) | Return on Equity (TTM) | Gross Margin (TTM) | EBITDA Margin (TTM) |
|---|---|---|---|---|---|---|
| ADM | 4.0% | 2.2% | 2.3% | 7.6% | 6.9% | 3.6% |
| ALTO | 3.5% | 5.5% | 5.8% | 22.2% | 6.8% | 6.6% |
| GPRE | 15.2% | 6.8% | 4.1% | 15.5% | 16.0% | 11.2% |
| GEVO | -76.8% | -119.9% | -5.2% | -55.5% | 44.7% | -13.2% |
| MEOH | 37.1% | 2.1% | 6.5% | 6.1% | 31.2% | 26.2% |
Source: Yahoo Finance
ADM’s operating margin of 4.0%, net margin of 2.2%, gross margin of 6.9%, and EBITDA margin of 3.6% all trail GPRE’s 15.2%, 6.8%, 16.0%, and 11.2%, and sit far below MEOH’s 37.1%, 2.1%, 31.2%, and 26.2%. Because ADM’s gross margin is low and its operating margin is only slightly higher, the gap looks like a cost-of-revenue problem more than an opex problem, which limits how much margin expansion I would underwrite without a better commodity spread.
ADM’s return on equity of 7.6% and return on assets of 2.3% are also ordinary rather than elite. The gap between those two figures is modest, which tells me leverage is not doing the heavy lifting here; the business itself needs to earn more.
Leverage
| Company | Total Debt/Equity % (mrq) | Current Ratio (mrq) | Free Cash Flow TTM (USD Mil) | Net Debt/EBITDA (TTM) | FCF Margin % (TTM) |
|---|---|---|---|---|---|
| ADM | 39.1 | 1.4 | 1,164.6 | 2.8 | 1.4% |
| ALTO | 31.9 | 3.2 | 22.6 | 0.9 | 2.4% |
| GPRE | 63.1 | 2 | 32.9 | 1.8 | 1.8% |
| GEVO | 60.8 | 2.7 | 18.5 | -4.8 | 10.4% |
| MEOH | 108.9 | 2.1 | 709.4 | 2.5 | 16.6% |
Source: Yahoo Finance
ADM’s debt to equity is 39.1% and net debt to EBITDA is 2.8x, above ALTO’s 31.9% and 0.9x and above GPRE’s 63.1% and 1.8x on the leverage side, while its FCF margin of 1.4% is thinner than ALTO’s 2.4%, GPRE’s 1.8%, and MEOH’s 16.6%. That mix says ADM is not stretched, but it also is not converting revenue into free cash flow as efficiently as the cleaner balance-sheet peers, so leverage supports resilience rather than a valuation premium.
Conclusion
I would put my rating as a Hold because ADM’s legal overhang has been removed and the cost program is real, but the latest profitability and cash-flow figures still do not prove that the business has moved to a higher-return level. The tension in the case is simple: the moat is intact, yet the numbers still show only 4.0% operating margin and 1.4% free-cash-flow margin, so the stock already reflects more stability than the business has fully earned.
I would raise my rating more towards a Buy if ADM can keep EBITDA above $1.5B for the next two quarters and push operating margin above 5.5%, which would mean the simplification plan is finally showing up in the income statement. A sustained move in free-cash-flow margin above 3.0% would matter even more, because that would show the network is turning scale into cash rather than just volume. If that happens, the current multiple would look easier to justify.
I would move from Hold to Sell if EBITDA falls back below $1.2B or if free-cash-flow margin stays near 1.4% while working capital and energy costs remain elevated. In that case, the market would be paying for resilience that is not translating into better cash conversion, and the current valuation would start to look too demanding for a cyclical processor.
I lean to Hold rather than Buy because the bull case and bear case are both credible, but I think the bear case is more likely to show up first. ADM has already cleared the legal cloud and the cost program is in motion, yet the latest figures still do not show enough margin repair for me to get more constructive.
What to Watch Next
- EBITDA above $1.5B for the next two quarters — would support a move toward Buy.
- Operating margin above 5.5% — would show the simplification plan is reaching the income statement.
- Free-cash-flow margin above 3.0% — would confirm better cash conversion.
- EBITDA below $1.2B — would strengthen the case for a lower rating.
- Free-cash-flow margin stuck near 1.4% — would keep valuation pressure in place.
What’s your take? I rated Archer-Daniels-Midland (ADM) HOLD above — but the goal here is to get this right, not just to publish an opinion. What would you add to this analysis, or which risk or catalyst do you think I’m under- or over-weighting? Tell me in the comments.
Sources
- SEC 10-K Annual Report — filed 2026-02-17
- SEC 8-K Filing (2026-05-12)
- SEC 8-K Filing (2026-05-05)
- SEC 8-K Filing (2026-03-10)
- SEC 8-K Filing (2026-02-03)
- SEC 8-K Filing (2026-01-28)
- SEC Form 4 Insider Transaction (2026-04-02)
- SEC Form 4 Insider Transaction (2026-04-02)
- SEC Form 4 Insider Transaction (2026-04-02)
- SEC 10-K Annual Report — FY2026
- SEC 10-K Annual Report — FY2025
- SEC 10-K Annual Report — FY2024
- SEC 10-K Annual Report — FY2023
- SEC 10-K Annual Report — FY2022
Data sourced from Yahoo Finance and SEC EDGAR. Not investment advice.
Leave a Comment