Executive Summary
Financials are more cyclical than staples, so the same mean-reversion rule should face a harder regime test. This run covers 2016-01-01 to 2025-01-01 using quantstrat in R, with initial equity of $100,000. I compare it with buy-and-hold, apply base friction, and run a first sequence <span class="lf0-tooltip" tabindex="0" style="border-bottom: 1px dotted currentColor; cursor: help;" title="A deliberate check that makes assumptions harsher to see whether the result survives outside ideal conditions." data-tooltip="A deliberate check that makes assumptions harsher to see whether the result survives outside ideal conditions." aria-label="stress test: A deliberate check that makes assumptions harsher to see whether the result survives outside ideal conditions.">stress test</span>.
Research Card
| Field | Detail |
|---|---|
| Instrument | XLF |
| Strategy type | <span class="lf0-tooltip" tabindex="0" style="border-bottom: 1px dotted currentColor; cursor: help;" title="A tendency for prices that moved unusually far in one direction to snap back toward a more normal level." data-tooltip="A tendency for prices that moved unusually far in one direction to snap back toward a more normal level." aria-label="Mean reversion: A tendency for prices that moved unusually far in one direction to snap back toward a more normal level.">Mean reversion</span> / band break |
| Publication archetype | empirical myth-busting research note |
| Test period | 2016-01-01 to 2025-01-01 |
| Engine | quantstrat in R |
| Starting equity | $100,000 |
| Strategy net P&L | $1,372 |
| Strategy <span class="lf0-tooltip" tabindex="0" style="border-bottom: 1px dotted currentColor; cursor: help;" title="Compound annual growth rate. It converts the full-period return into an annualized growth pace." data-tooltip="Compound annual growth rate. It converts the full-period return into an annualized growth pace." aria-label="CAGR: Compound annual growth rate. It converts the full-period return into an annualized growth pace.">CAGR</span> | 0.15% |
| Strategy max <span class="lf0-tooltip" tabindex="0" style="border-bottom: 1px dotted currentColor; cursor: help;" title="The fall from a prior equity high to a later low. It measures the pain a trader had to sit through." data-tooltip="The fall from a prior equity high to a later low. It measures the pain a trader had to sit through." aria-label="drawdown: The fall from a prior equity high to a later low. It measures the pain a trader had to sit through.">drawdown</span> | -0.49% |
| Trades | 47 |
| <span class="lf0-tooltip" tabindex="0" style="border-bottom: 1px dotted currentColor; cursor: help;" title="The comparison hurdle. For a single ETF strategy, buy-and-hold of the same ETF is the first test to beat." data-tooltip="The comparison hurdle. For a single ETF strategy, buy-and-hold of the same ETF is the first test to beat." aria-label="Benchmark: The comparison hurdle. For a single ETF strategy, buy-and-hold of the same ETF is the first test to beat.">Benchmark</span> | Buy and hold XLF |
| Benchmark CAGR | 15.78% |
| CAGR spread | -15.63% |
| Costs/stress | Base friction and <span class="lf0-tooltip" tabindex="0" style="border-bottom: 1px dotted currentColor; cursor: help;" title="A simulation method that repeatedly reshuffles the same historical trades to see how much the sequence alone changes the path." data-tooltip="A simulation method that repeatedly reshuffles the same historical trades to see how much the sequence alone changes the path." aria-label="Monte Carlo: A simulation method that repeatedly reshuffles the same historical trades to see how much the sequence alone changes the path.">Monte Carlo</span> sequence stress included |
| Verdict | Trailed buy-and-hold on CAGR before costs |
The Setup
I’m testing a simple mean reversion story in financials: when XLF gets pushed below its lower volatility envelope, does it tend to snap back toward the middle rather than keep trending lower? The logic is that sector ETFs like XLF often overshoot on short-term news, macro surprises, or forced de-risking, and then stabilize once the selling pressure fades.
Results
| Metric | Strategy | Benchmark | Why it matters |
|---|---|---|---|
| Final Equity | $101,372 | $373,606 | Ending account value before full friction modeling. |
| CAGR | 0.15% | 15.78% | Annualized growth; the first hurdle is buy-and-hold. |
| Max Drawdown | -0.49% | -42.86% | Worst peak-to-trough decline. |
| <span class="lf0-tooltip" tabindex="0" style="border-bottom: 1px dotted currentColor; cursor: help;" title="Return per unit of volatility. It asks whether the strategy was paid enough for the ride it took." data-tooltip="Return per unit of volatility. It asks whether the strategy was paid enough for the ride it took." aria-label="Sharpe Ratio: Return per unit of volatility. It asks whether the strategy was paid enough for the ride it took.">Sharpe Ratio</span> | 3.58 | 0.73 | Return earned per unit of volatility. |
| <span class="lf0-tooltip" tabindex="0" style="border-bottom: 1px dotted currentColor; cursor: help;" title="Like Sharpe, but it only penalizes downside volatility, which is often what traders actually care about." data-tooltip="Like Sharpe, but it only penalizes downside volatility, which is often what traders actually care about." aria-label="Sortino Ratio: Like Sharpe, but it only penalizes downside volatility, which is often what traders actually care about.">Sortino Ratio</span> | 0.29 | 0.99 | Like Sharpe, but focused on downside volatility. |
| <span class="lf0-tooltip" tabindex="0" style="border-bottom: 1px dotted currentColor; cursor: help;" title="Annualized return divided by maximum drawdown. It asks how much growth the strategy earned for the pain it caused." data-tooltip="Annualized return divided by maximum drawdown. It asks how much growth the strategy earned for the pain it caused." aria-label="Calmar Ratio: Annualized return divided by maximum drawdown. It asks how much growth the strategy earned for the pain it caused.">Calmar Ratio</span> | 0.31 | N/A | CAGR divided by max drawdown. |
| <span class="lf0-tooltip" tabindex="0" style="border-bottom: 1px dotted currentColor; cursor: help;" title="Gross profits divided by gross losses. Above 1 means winners outweighed losers before considering other constraints." data-tooltip="Gross profits divided by gross losses. Above 1 means winners outweighed losers before considering other constraints." aria-label="Profit Factor: Gross profits divided by gross losses. Above 1 means winners outweighed losers before considering other constraints.">Profit Factor</span> | 1.75 | N/A | Gross profits divided by gross losses. |
| <span class="lf0-tooltip" tabindex="0" style="border-bottom: 1px dotted currentColor; cursor: help;" title="Average winning trade divided by average losing trade. It shows whether wins are large enough to pay for losses." data-tooltip="Average winning trade divided by average losing trade. It shows whether wins are large enough to pay for losses." aria-label="Payoff Ratio: Average winning trade divided by average losing trade. It shows whether wins are large enough to pay for losses.">Payoff Ratio</span> | 0.82 | N/A | Average winner divided by average loser. |
| Median Trade | $43 | N/A | A reality check against a few outsized trades. |
| <span class="lf0-tooltip" tabindex="0" style="border-bottom: 1px dotted currentColor; cursor: help;" title="The share of the test period where capital was actually in the market. Lower exposure can change how returns should be judged." data-tooltip="The share of the test period where capital was actually in the market. Lower exposure can change how returns should be judged." aria-label="Exposure: The share of the test period where capital was actually in the market. Lower exposure can change how returns should be judged.">Exposure</span> | 14.00% | 100.00% | Percentage of days with capital at risk. |
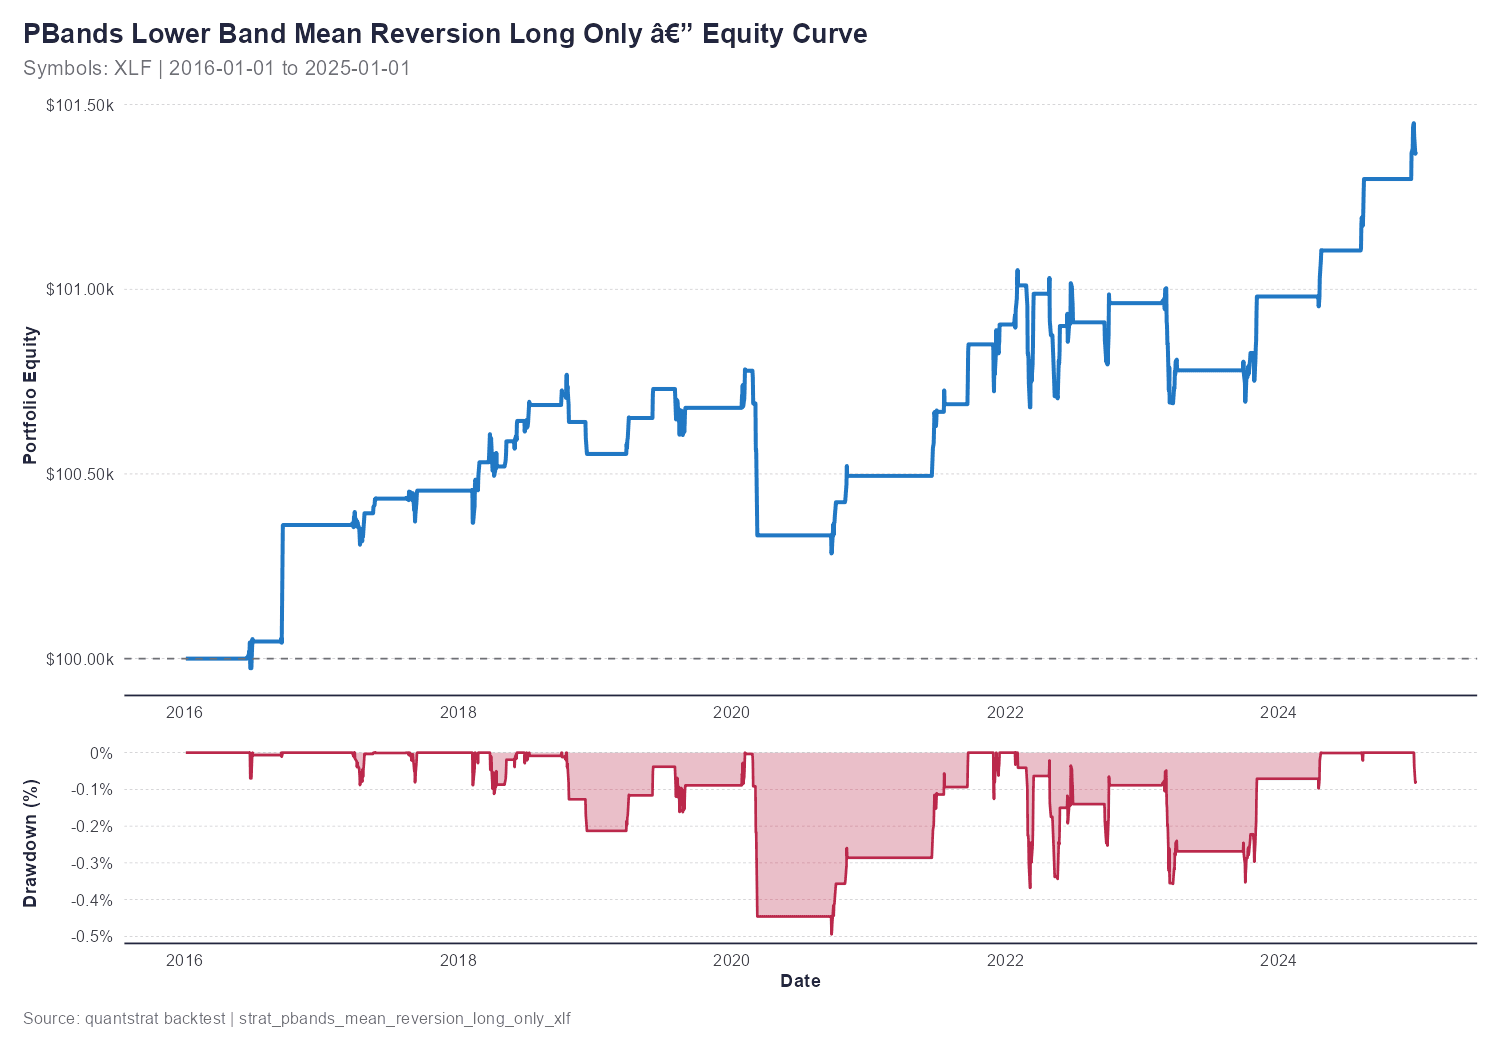
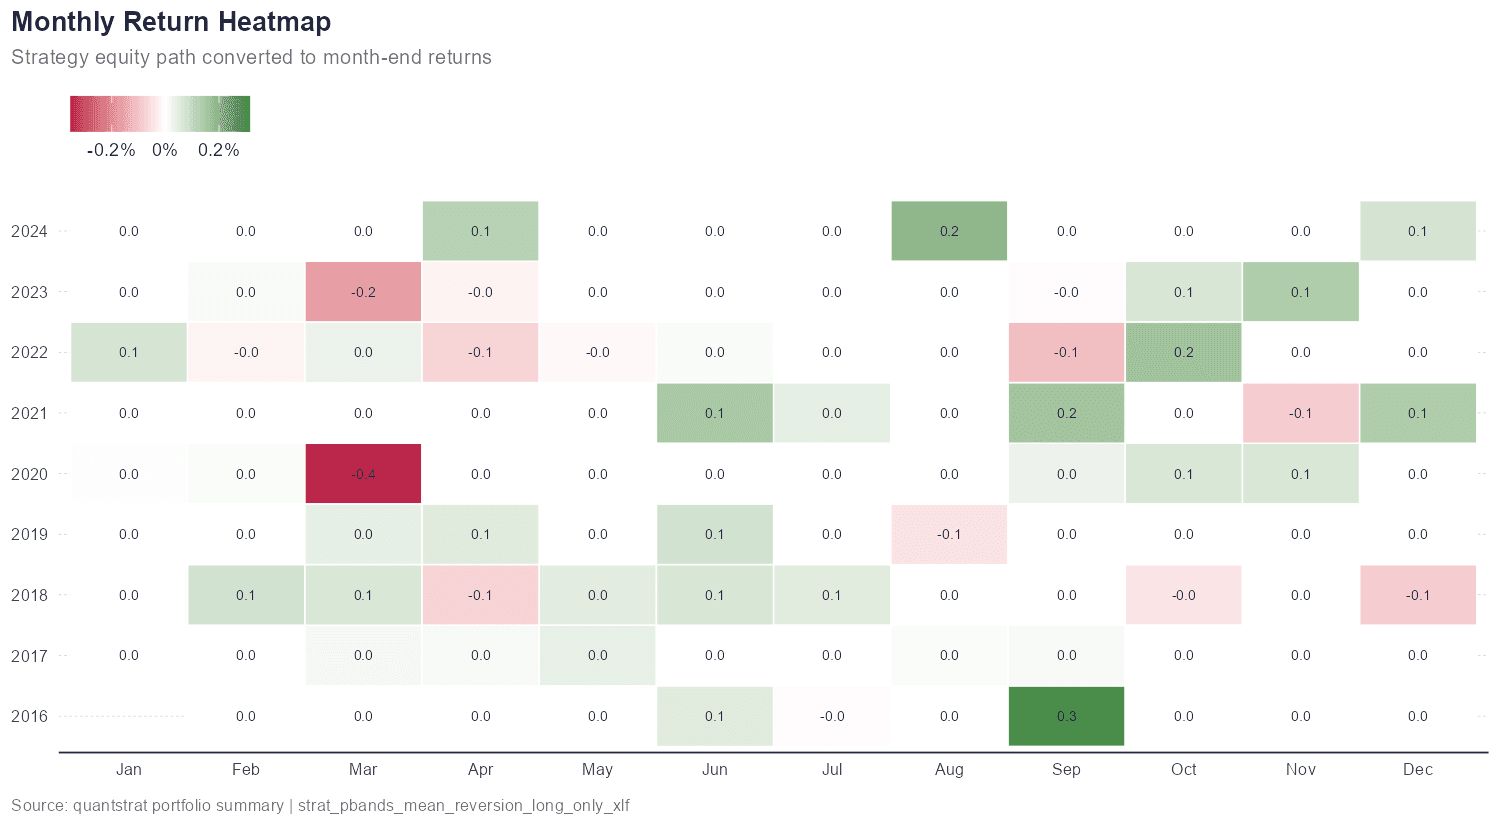
The backtest did support the mean-reversion hypothesis, but only weakly in economic terms. Final equity was 101,371.63 on a 100,000 start, for net P&L of 1,371.63 and CAGR of 0.15% over 2016-01-01 to 2025-01-01. That is positive, but small.
Statistical Limits And Regime Dependence
The key question is whether the evidence survives sampling uncertainty, clustered trades, and regime shifts. P-values are diagnostics, not trading signals.
| Statistical Check | Evidence | Why it matters |
|---|---|---|
| Bootstrap mean trade P&L | $-4.43 to $62.49 95% interval | Tests whether the <span class="lf0-tooltip" tabindex="0" style="border-bottom: 1px dotted currentColor; cursor: help;" title="The typical profit or loss per closed trade. Small values are fragile because costs can erase them quickly." data-tooltip="The typical profit or loss per closed trade. Small values are fragile because costs can erase them quickly." aria-label="average trade: The typical profit or loss per closed trade. Small values are fragile because costs can erase them quickly.">average trade</span> edge survives resampling. |
| Bootstrap mean positive rate | 95.2% | Useful for direction, but not a substitute for <span class="lf0-tooltip" tabindex="0" style="border-bottom: 1px dotted currentColor; cursor: help;" title="The later portion of the historical test, used here to check whether the result held up after the initial sample." data-tooltip="The later portion of the historical test, used here to check whether the result held up after the initial sample." aria-label="out-of-sample: The later portion of the historical test, used here to check whether the result held up after the initial sample.">out-of-sample</span> proof. |
| Binomial win-rate diagnostic | p=0.0133 | Checks whether the hit rate is unusual versus a neutral 50% baseline. |
| Wilcoxon trade-P&L diagnostic | p=0.1329 | Non-parametric check of whether trade P&L is centered above zero. |
| Equity-return serial dependence | p=0.0211 | Flags whether daily strategy returns are path-dependent. |
| Closed-trade serial dependence | p=0.4952 | Checks whether trade outcomes cluster. |
| Analysis Area | Status | Artifact |
|---|---|---|
| trade_edge | ready | statistical_diagnostics.rds/per_trade_stats.rds |
| win_rate | ready | statistical_diagnostics.rds/per_trade_stats.rds |
| path_risk | ready | stress_summary.rds |
| cost_sensitivity | ready | friction_summary.rds |
| parameter_robustness | ready | parameter_sensitivity.rds |
| sample_split | ready | stress_summary.rds |
| walk_forward | limited | walk_forward_summary.rds |
| serial_dependence | ready | statistical_diagnostics.rds |
Regime dependency: this setup can degrade when volatility expands, gaps dominate, or the sector enters a persistent trend. The forward-degradation rows test stability, not parameter-optimization skill.
Costs And Stress Test
I now run a simple friction pass before drafting the article. For this strategy test, the base case assumes 2.00 bps of <span class="lf0-tooltip" tabindex="0" style="border-bottom: 1px dotted currentColor; cursor: help;" title="The difference between the expected execution price and the actual fill. It usually gets worse in fast or illiquid markets." data-tooltip="The difference between the expected execution price and the actual fill. It usually gets worse in fast or illiquid markets." aria-label="slippage: The difference between the expected execution price and the actual fill. It usually gets worse in fast or illiquid markets.">slippage</span> per side and 1.00 bps of spread cost per side, or 6.00 bps per round trip. That is still a model, but it is a better starting point than pretending fills are free.
| Friction Check | Value |
|---|---|
| Gross net P&L | $1,372 |
| Base <span class="lf0-tooltip" tabindex="0" style="border-bottom: 1px dotted currentColor; cursor: help;" title="The full entry-plus-exit trading cost for one completed trade, expressed here in basis points." data-tooltip="The full entry-plus-exit trading cost for one completed trade, expressed here in basis points." aria-label="round-trip cost: The full entry-plus-exit trading cost for one completed trade, expressed here in basis points.">round-trip cost</span> | $80 |
| <span class="lf0-tooltip" tabindex="0" style="border-bottom: 1px dotted currentColor; cursor: help;" title="Strategy profit after the friction model subtracts estimated spread, slippage, and commission costs." data-tooltip="Strategy profit after the friction model subtracts estimated spread, slippage, and commission costs." aria-label="Cost-adjusted net P&L: Strategy profit after the friction model subtracts estimated spread, slippage, and commission costs.">Cost-adjusted net P&L</span> | $1,292 |
| Gross profit factor | 1.75 |
| Cost-adjusted profit factor | 1.73 |
| <span class="lf0-tooltip" tabindex="0" style="border-bottom: 1px dotted currentColor; cursor: help;" title="The estimated round-trip cost level where the historical net profit would be fully consumed by trading costs." data-tooltip="The estimated round-trip cost level where the historical net profit would be fully consumed by trading costs." aria-label="Break-even round-trip cost: The estimated round-trip cost level where the historical net profit would be fully consumed by trading costs.">Break-even round-trip cost</span> | 103.46 bps |
| Stress Check | Value |
|---|---|
| Monte Carlo simulations | 2000 |
| Observed trade-order max drawdown | -0.44% |
| <span class="lf0-tooltip" tabindex="0" style="border-bottom: 1px dotted currentColor; cursor: help;" title="A conservative drawdown estimate: only about 5% of reshuffled paths were worse than this level." data-tooltip="A conservative drawdown estimate: only about 5% of reshuffled paths were worse than this level." aria-label="95th percentile drawdown: A conservative drawdown estimate: only about 5% of reshuffled paths were worse than this level.">95th percentile drawdown</span> | -0.59% |
| Median simulated ending P&L | $1,368 |
| <span class="lf0-tooltip" tabindex="0" style="border-bottom: 1px dotted currentColor; cursor: help;" title="The low-end bootstrapped outcome. It asks what the strategy looked like when the sampled trades were less favorable than history." data-tooltip="The low-end bootstrapped outcome. It asks what the strategy looked like when the sampled trades were less favorable than history." aria-label="Weak-path ending P&L: The low-end bootstrapped outcome. It asks what the strategy looked like when the sampled trades were less favorable than history.">Weak-path ending P&L</span> | $35 |
| High-cost net P&L | $1,213 |
| <span class="lf0-tooltip" tabindex="0" style="border-bottom: 1px dotted currentColor; cursor: help;" title="The earlier portion of the historical test, used here as a rough development-period diagnostic." data-tooltip="The earlier portion of the historical test, used here as a rough development-period diagnostic." aria-label="In-sample: The earlier portion of the historical test, used here as a rough development-period diagnostic.">In-sample</span> net P&L | $825 over 33 trades |
| Out-of-sample net P&L | $546 over 15 trades |
| Out-of-sample profit factor | 1.79 |
| Forward average-trade degradation | 45.58% |
| Forward profit-factor degradation | 0.20% |
| Walk-forward windows | 2 anchored test windows |
| Walk-forward positive test windows | 100.00% |
| Worst walk-forward test P&L | $112 |
| Median walk-forward avg-trade degradation | -39.99% |
| Parameter sensitivity | 27 <span class="lf0-tooltip" tabindex="0" style="border-bottom: 1px dotted currentColor; cursor: help;" title="Percentage Bands, a band-style indicator that marks stretched prices relative to recent behavior." data-tooltip="Percentage Bands, a band-style indicator that marks stretched prices relative to recent behavior." aria-label="PBands: Percentage Bands, a band-style indicator that marks stretched prices relative to recent behavior.">PBands</span> variants tested; best net P&L $2,895 at n=20, sd=1.5, stop=5.00% |
| Baseline grid result | $1,622 net P&L; profit factor 2.15 |
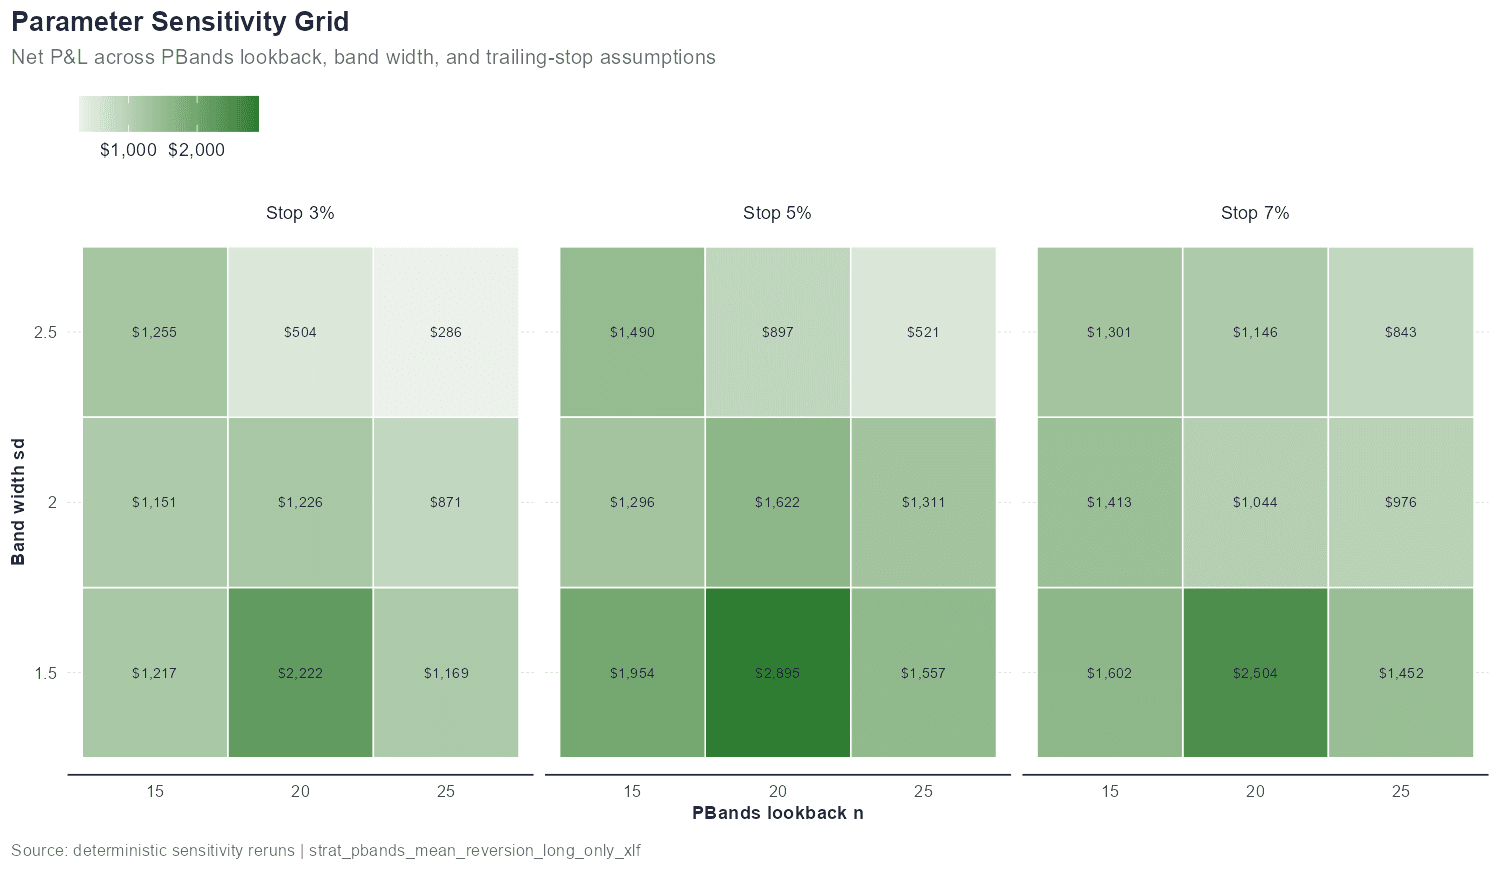
Watch the break-even round-trip cost: above that level, the historical edge is gone. Monte Carlo separates edge from path luck; the in/out row is a closed-trade split, not walk-forward optimization.
What Breaks It
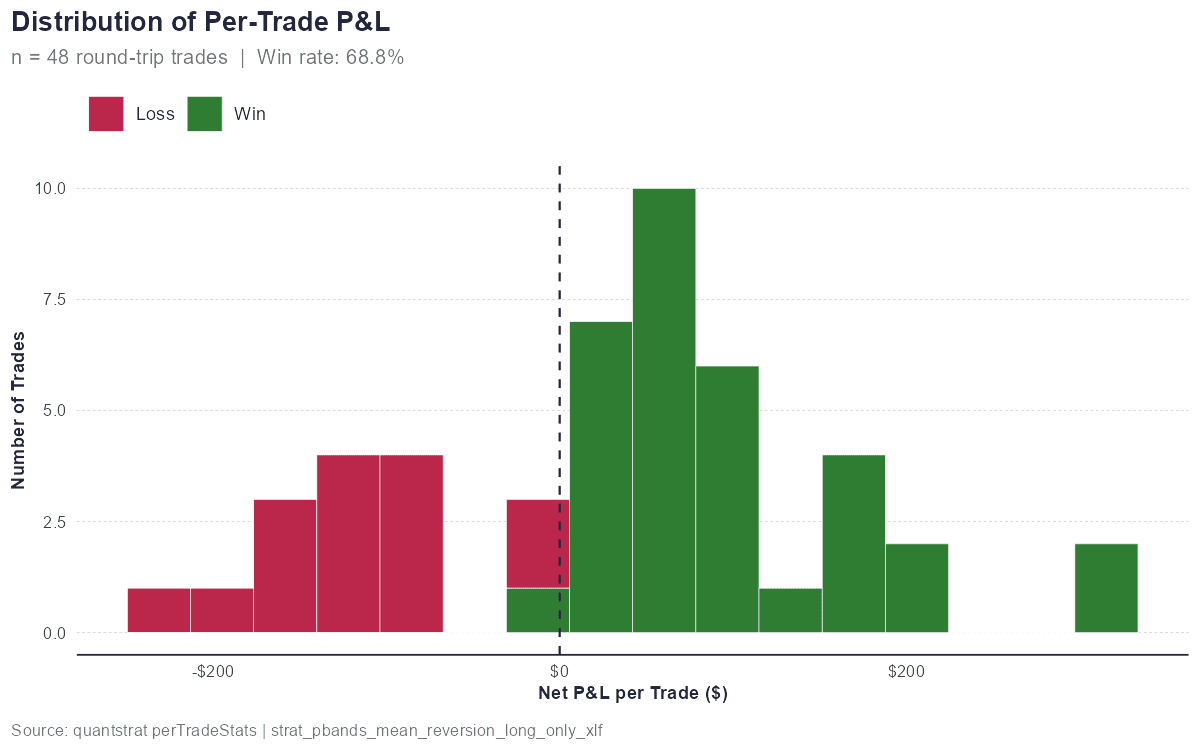
The trade P&L distribution is decent but not clean: most trades are small winners, with a cluster around modest positive outcomes, while losses are fewer but noticeably larger in size. That means the edge comes from hit rate more than payoff symmetry, and the average loser still matters. Drawdown, in plain English, is the peak-to-trough loss during a rough stretch before the equity recovers.
Verdict
I set out to test whether a simple lower-band mean-reversion rule on XLF captures short-lived overshoots better than it gets trapped in falling momentum, and the evidence says the idea is plausible but not cleanly robust.
What would change my mind: the same rule needs to survive costs while closing the gap versus buy-and-hold, or prove useful as a timing overlay rather than a standalone strategy.
R Notes
The reproducibility contract is the saved artifact set plus the R scripts that created it. The key JSON/RDS files are recorded in the frontmatter.
# Rebuild the evidence layer for one saved strategy output
source('backtesting_blog_posts/statistical_diagnostics.R')
source('backtesting_blog_posts/walk_forward_diagnostics.R')
source('backtesting_blog_posts/analysis_test_selector.R')

out_dir <- file.path('backtesting_blog_posts', 'outputs', 'strat_pbands_mean_reversion_long_only_xlf')
per_trade <- readRDS(file.path(out_dir, 'per_trade_stats.rds'))
portfolio <- readRDS(file.path(out_dir, 'portfolio_summary.rds'))

diagnostics <- build_statistical_diagnostics(per_trade, portfolio)
walk_forward <- build_walk_forward_summary(per_trade)
test_plan <- build_analysis_test_plan(out_dir)
For the current PBands series, parameter_sensitivity uses a deterministic next-bar rerun helper because native quantstrat parameter clones can fail to propagate osMaxPos limits safely. Future strategy families should call register_parameter_sensitivity_builder() with their own sensitivity builder.
Important: Backtests are simulations. Past performance of a simulated strategy does not guarantee future results. Results do not yet fully account for real-world factors including <span class="lf0-tooltip" tabindex="0" style="border-bottom: 1px dotted currentColor; cursor: help;" title="The gap between the price buyers bid and sellers ask. Crossing that gap is a real trading cost." data-tooltip="The gap between the price buyers bid and sellers ask. Crossing that gap is a real trading cost." aria-label="bid-ask spread: The gap between the price buyers bid and sellers ask. Crossing that gap is a real trading cost.">bid-ask spread</span>, market impact, borrow costs, or taxes. This is for educational purposes only and is not investment advice.
Leave a Comment