Executive Summary
Can a simple lower-band mean-reversion rule find useful dip-buying opportunities in defensive sector ETFs? This run covers 2016-01-01 to 2025-01-01 using quantstrat in R, with initial equity of $100,000. I compare it with buy-and-hold, apply base friction, and run a first sequence <span class="lf0-tooltip" tabindex="0" style="border-bottom: 1px dotted currentColor; cursor: help;" title="A deliberate check that makes assumptions harsher to see whether the result survives outside ideal conditions." data-tooltip="A deliberate check that makes assumptions harsher to see whether the result survives outside ideal conditions." aria-label="stress test: A deliberate check that makes assumptions harsher to see whether the result survives outside ideal conditions.">stress test</span>.
Research Card
| Field | Detail |
|---|---|
| Instrument | XLP |
| Strategy type | <span class="lf0-tooltip" tabindex="0" style="border-bottom: 1px dotted currentColor; cursor: help;" title="A tendency for prices that moved unusually far in one direction to snap back toward a more normal level." data-tooltip="A tendency for prices that moved unusually far in one direction to snap back toward a more normal level." aria-label="Mean reversion: A tendency for prices that moved unusually far in one direction to snap back toward a more normal level.">Mean reversion</span> / band break |
| Publication archetype | empirical myth-busting research note |
| Test period | 2016-01-01 to 2025-01-01 |
| Engine | quantstrat in R |
| Starting equity | $100,000 |
| Strategy net P&L | $1,131 |
| Strategy <span class="lf0-tooltip" tabindex="0" style="border-bottom: 1px dotted currentColor; cursor: help;" title="Compound annual growth rate. It converts the full-period return into an annualized growth pace." data-tooltip="Compound annual growth rate. It converts the full-period return into an annualized growth pace." aria-label="CAGR: Compound annual growth rate. It converts the full-period return into an annualized growth pace.">CAGR</span> | 0.13% |
| Strategy max <span class="lf0-tooltip" tabindex="0" style="border-bottom: 1px dotted currentColor; cursor: help;" title="The fall from a prior equity high to a later low. It measures the pain a trader had to sit through." data-tooltip="The fall from a prior equity high to a later low. It measures the pain a trader had to sit through." aria-label="drawdown: The fall from a prior equity high to a later low. It measures the pain a trader had to sit through.">drawdown</span> | -0.95% |
| Trades | 44 |
| <span class="lf0-tooltip" tabindex="0" style="border-bottom: 1px dotted currentColor; cursor: help;" title="The comparison hurdle. For a single ETF strategy, buy-and-hold of the same ETF is the first test to beat." data-tooltip="The comparison hurdle. For a single ETF strategy, buy-and-hold of the same ETF is the first test to beat." aria-label="Benchmark: The comparison hurdle. For a single ETF strategy, buy-and-hold of the same ETF is the first test to beat.">Benchmark</span> | Buy and hold XLP |
| Benchmark CAGR | 8.04% |
| CAGR spread | -7.91% |
| Costs/stress | Base friction and <span class="lf0-tooltip" tabindex="0" style="border-bottom: 1px dotted currentColor; cursor: help;" title="A simulation method that repeatedly reshuffles the same historical trades to see how much the sequence alone changes the path." data-tooltip="A simulation method that repeatedly reshuffles the same historical trades to see how much the sequence alone changes the path." aria-label="Monte Carlo: A simulation method that repeatedly reshuffles the same historical trades to see how much the sequence alone changes the path.">Monte Carlo</span> sequence stress included |
| Verdict | Trailed buy-and-hold on CAGR before costs |
The Setup
The anomaly I’m testing is simple but not obvious: when XLP gets pushed far enough below its recent trading range, does it tend to snap back before the selloff becomes something more durable? In plain English, this is a mean reversion bet on a defensive sector that often attracts capital when investors are nervous and then overshoots on the downside when the panic eases.
Results
| Metric | Strategy | Benchmark | Why it matters |
|---|---|---|---|
| Final Equity | $101,131 | $200,483 | Ending account value before full friction modeling. |
| CAGR | 0.13% | 8.04% | Annualized growth; the first hurdle is buy-and-hold. |
| Max Drawdown | -0.95% | -24.51% | Worst peak-to-trough decline. |
| <span class="lf0-tooltip" tabindex="0" style="border-bottom: 1px dotted currentColor; cursor: help;" title="Return per unit of volatility. It asks whether the strategy was paid enough for the ride it took." data-tooltip="Return per unit of volatility. It asks whether the strategy was paid enough for the ride it took." aria-label="Sharpe Ratio: Return per unit of volatility. It asks whether the strategy was paid enough for the ride it took.">Sharpe Ratio</span> | 2.64 | 0.60 | Return earned per unit of volatility. |
| <span class="lf0-tooltip" tabindex="0" style="border-bottom: 1px dotted currentColor; cursor: help;" title="Like Sharpe, but it only penalizes downside volatility, which is often what traders actually care about." data-tooltip="Like Sharpe, but it only penalizes downside volatility, which is often what traders actually care about." aria-label="Sortino Ratio: Like Sharpe, but it only penalizes downside volatility, which is often what traders actually care about.">Sortino Ratio</span> | 0.14 | 0.75 | Like Sharpe, but focused on downside volatility. |
| <span class="lf0-tooltip" tabindex="0" style="border-bottom: 1px dotted currentColor; cursor: help;" title="Annualized return divided by maximum drawdown. It asks how much growth the strategy earned for the pain it caused." data-tooltip="Annualized return divided by maximum drawdown. It asks how much growth the strategy earned for the pain it caused." aria-label="Calmar Ratio: Annualized return divided by maximum drawdown. It asks how much growth the strategy earned for the pain it caused.">Calmar Ratio</span> | 0.13 | N/A | CAGR divided by max drawdown. |
| <span class="lf0-tooltip" tabindex="0" style="border-bottom: 1px dotted currentColor; cursor: help;" title="Gross profits divided by gross losses. Above 1 means winners outweighed losers before considering other constraints." data-tooltip="Gross profits divided by gross losses. Above 1 means winners outweighed losers before considering other constraints." aria-label="Profit Factor: Gross profits divided by gross losses. Above 1 means winners outweighed losers before considering other constraints.">Profit Factor</span> | 1.51 | N/A | Gross profits divided by gross losses. |
| <span class="lf0-tooltip" tabindex="0" style="border-bottom: 1px dotted currentColor; cursor: help;" title="Average winning trade divided by average losing trade. It shows whether wins are large enough to pay for losses." data-tooltip="Average winning trade divided by average losing trade. It shows whether wins are large enough to pay for losses." aria-label="Payoff Ratio: Average winning trade divided by average losing trade. It shows whether wins are large enough to pay for losses.">Payoff Ratio</span> | 0.70 | N/A | Average winner divided by average loser. |
| Median Trade | $62 | N/A | A reality check against a few outsized trades. |
| <span class="lf0-tooltip" tabindex="0" style="border-bottom: 1px dotted currentColor; cursor: help;" title="The share of the test period where capital was actually in the market. Lower exposure can change how returns should be judged." data-tooltip="The share of the test period where capital was actually in the market. Lower exposure can change how returns should be judged." aria-label="Exposure: The share of the test period where capital was actually in the market. Lower exposure can change how returns should be judged.">Exposure</span> | 15.42% | 100.00% | Percentage of days with capital at risk. |
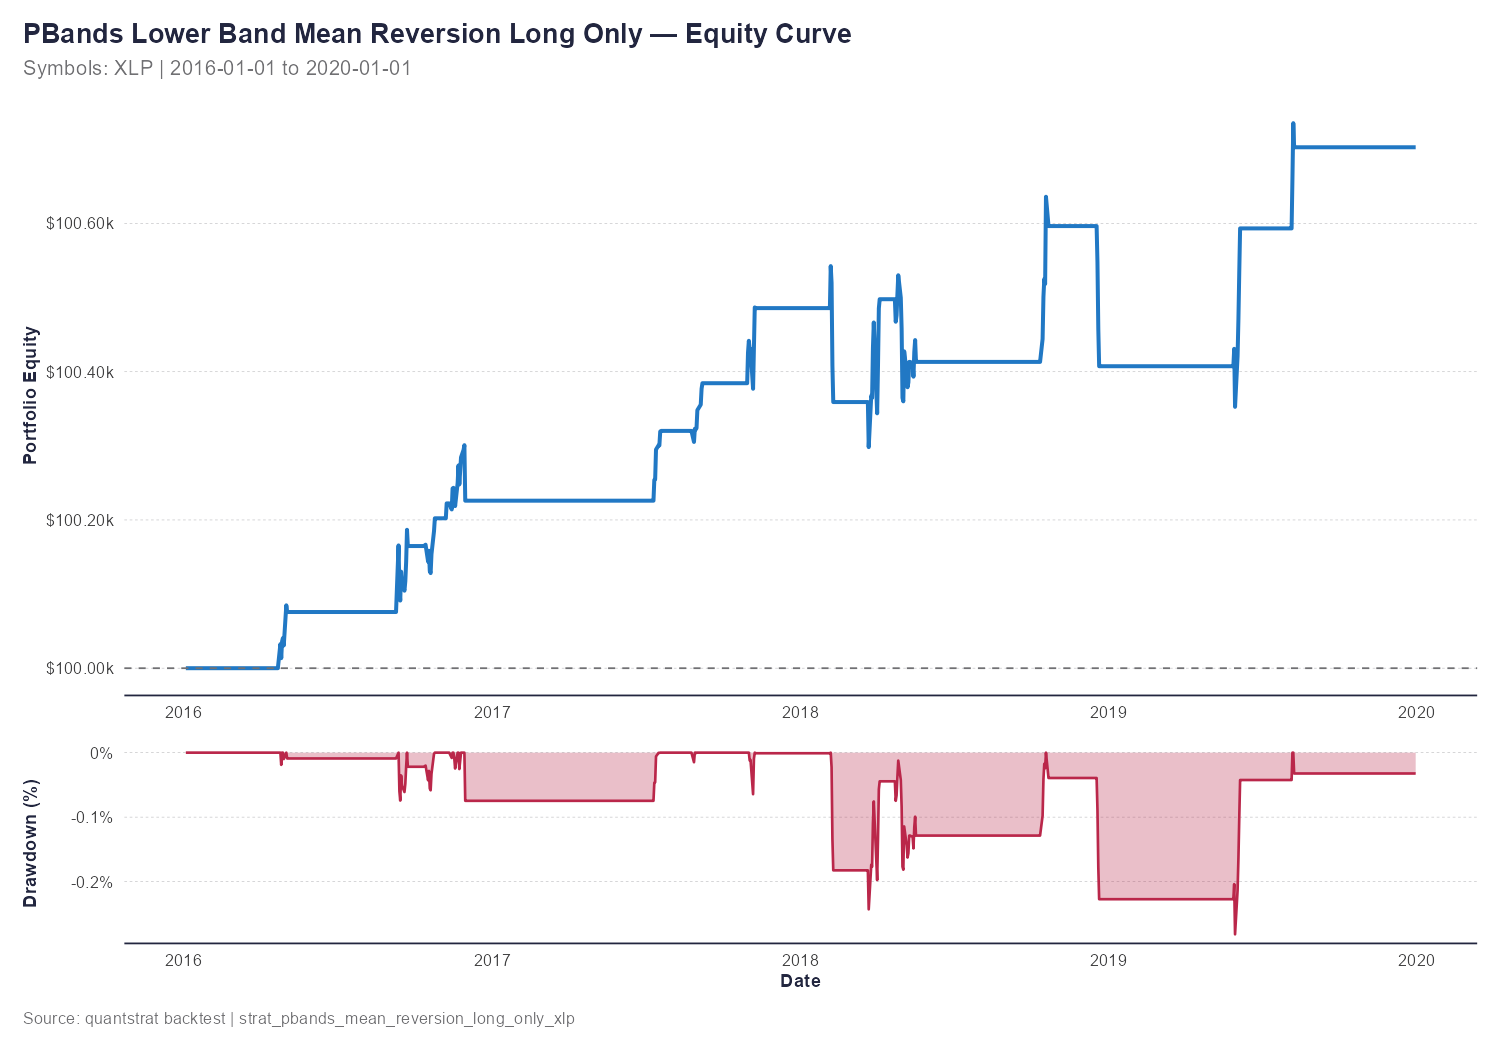
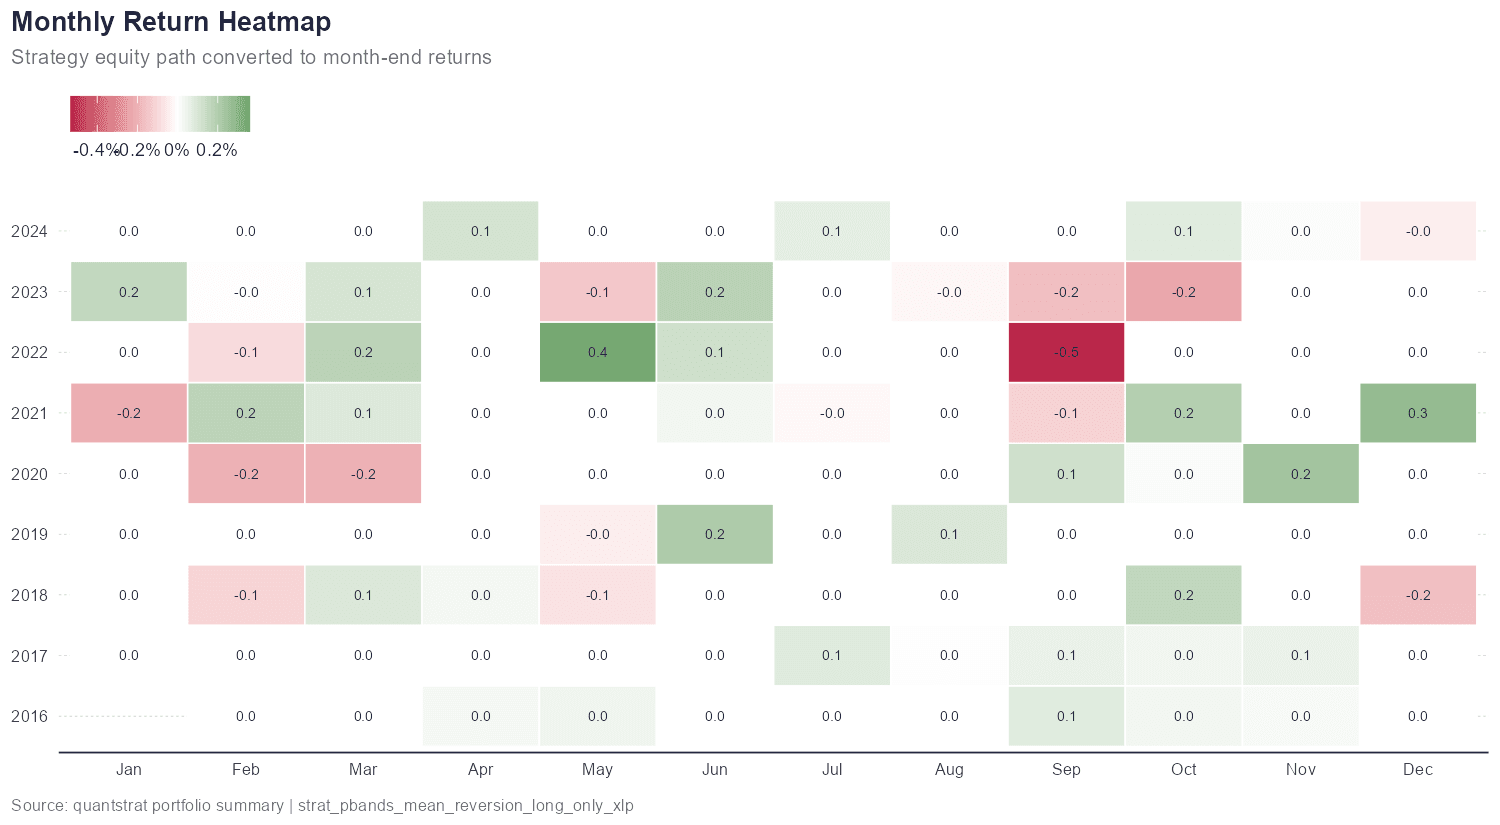
I do not think the backtest supports the original mean-reversion hypothesis in a strong way. The strategy ended at $101,130.72 on $100,000 start capital, for net P&L of $1,130.72 and CAGR of 0.125%, which is economically tiny over nine years.
Statistical Limits And Regime Dependence
The key question is whether the evidence survives sampling uncertainty, clustered trades, and regime shifts. P-values are diagnostics, not trading signals.
| Statistical Check | Evidence | Why it matters |
|---|---|---|
| Bootstrap mean trade P&L | $-21.02 to $71.11 95% interval | Tests whether the <span class="lf0-tooltip" tabindex="0" style="border-bottom: 1px dotted currentColor; cursor: help;" title="The typical profit or loss per closed trade. Small values are fragile because costs can erase them quickly." data-tooltip="The typical profit or loss per closed trade. Small values are fragile because costs can erase them quickly." aria-label="average trade: The typical profit or loss per closed trade. Small values are fragile because costs can erase them quickly.">average trade</span> edge survives resampling. |
| Bootstrap mean positive rate | 85.9% | Useful for direction, but not a substitute for <span class="lf0-tooltip" tabindex="0" style="border-bottom: 1px dotted currentColor; cursor: help;" title="The later portion of the historical test, used here to check whether the result held up after the initial sample." data-tooltip="The later portion of the historical test, used here to check whether the result held up after the initial sample." aria-label="out-of-sample: The later portion of the historical test, used here to check whether the result held up after the initial sample.">out-of-sample</span> proof. |
| Binomial win-rate diagnostic | p=0.0357 | Checks whether the hit rate is unusual versus a neutral 50% baseline. |
| Wilcoxon trade-P&L diagnostic | p=0.1756 | Non-parametric check of whether trade P&L is centered above zero. |
| Equity-return serial dependence | p=0.0000 | Flags whether daily strategy returns are path-dependent. |
| Closed-trade serial dependence | p=0.0896 | Checks whether trade outcomes cluster. |
| Analysis Area | Status | Artifact |
|---|---|---|
| trade_edge | ready | statistical_diagnostics.rds/per_trade_stats.rds |
| win_rate | ready | statistical_diagnostics.rds/per_trade_stats.rds |
| path_risk | ready | stress_summary.rds |
| cost_sensitivity | ready | friction_summary.rds |
| parameter_robustness | ready | parameter_sensitivity.rds |
| sample_split | ready | stress_summary.rds |
| walk_forward | limited | walk_forward_summary.rds |
| serial_dependence | ready | statistical_diagnostics.rds |
Regime dependency: this setup can degrade when volatility expands, gaps dominate, or the sector enters a persistent trend. The forward-degradation rows test stability, not parameter-optimization skill.
Costs And Stress Test
I now run a simple friction pass before drafting the article. For this strategy test, the base case assumes 2.00 bps of <span class="lf0-tooltip" tabindex="0" style="border-bottom: 1px dotted currentColor; cursor: help;" title="The difference between the expected execution price and the actual fill. It usually gets worse in fast or illiquid markets." data-tooltip="The difference between the expected execution price and the actual fill. It usually gets worse in fast or illiquid markets." aria-label="slippage: The difference between the expected execution price and the actual fill. It usually gets worse in fast or illiquid markets.">slippage</span> per side and 1.00 bps of spread cost per side, or 6.00 bps per round trip. That is still a model, but it is a better starting point than pretending fills are free.
| Friction Check | Value |
|---|---|
| Gross net P&L | $1,131 |
| Base <span class="lf0-tooltip" tabindex="0" style="border-bottom: 1px dotted currentColor; cursor: help;" title="The full entry-plus-exit trading cost for one completed trade, expressed here in basis points." data-tooltip="The full entry-plus-exit trading cost for one completed trade, expressed here in basis points." aria-label="round-trip cost: The full entry-plus-exit trading cost for one completed trade, expressed here in basis points.">round-trip cost</span> | $155 |
| <span class="lf0-tooltip" tabindex="0" style="border-bottom: 1px dotted currentColor; cursor: help;" title="Strategy profit after the friction model subtracts estimated spread, slippage, and commission costs." data-tooltip="Strategy profit after the friction model subtracts estimated spread, slippage, and commission costs." aria-label="Cost-adjusted net P&L: Strategy profit after the friction model subtracts estimated spread, slippage, and commission costs.">Cost-adjusted net P&L</span> | $975 |
| Gross profit factor | 1.51 |
| Cost-adjusted profit factor | 1.41 |
| <span class="lf0-tooltip" tabindex="0" style="border-bottom: 1px dotted currentColor; cursor: help;" title="The estimated round-trip cost level where the historical net profit would be fully consumed by trading costs." data-tooltip="The estimated round-trip cost level where the historical net profit would be fully consumed by trading costs." aria-label="Break-even round-trip cost: The estimated round-trip cost level where the historical net profit would be fully consumed by trading costs.">Break-even round-trip cost</span> | 43.68 bps |
| Stress Check | Value |
|---|---|
| Monte Carlo simulations | 2000 |
| Observed trade-order max drawdown | -0.79% |
| <span class="lf0-tooltip" tabindex="0" style="border-bottom: 1px dotted currentColor; cursor: help;" title="A conservative drawdown estimate: only about 5% of reshuffled paths were worse than this level." data-tooltip="A conservative drawdown estimate: only about 5% of reshuffled paths were worse than this level." aria-label="95th percentile drawdown: A conservative drawdown estimate: only about 5% of reshuffled paths were worse than this level.">95th percentile drawdown</span> | -0.98% |
| Median simulated ending P&L | $1,164 |
| <span class="lf0-tooltip" tabindex="0" style="border-bottom: 1px dotted currentColor; cursor: help;" title="The low-end bootstrapped outcome. It asks what the strategy looked like when the sampled trades were less favorable than history." data-tooltip="The low-end bootstrapped outcome. It asks what the strategy looked like when the sampled trades were less favorable than history." aria-label="Weak-path ending P&L: The low-end bootstrapped outcome. It asks what the strategy looked like when the sampled trades were less favorable than history.">Weak-path ending P&L</span> | $-541 |
| High-cost net P&L | $820 |
| <span class="lf0-tooltip" tabindex="0" style="border-bottom: 1px dotted currentColor; cursor: help;" title="The earlier portion of the historical test, used here as a rough development-period diagnostic." data-tooltip="The earlier portion of the historical test, used here as a rough development-period diagnostic." aria-label="In-sample: The earlier portion of the historical test, used here as a rough development-period diagnostic.">In-sample</span> net P&L | $1,089 over 31 trades |
| Out-of-sample net P&L | $42 over 14 trades |
| Out-of-sample profit factor | 1.04 |
| Forward average-trade degradation | -91.43% |
| Forward profit-factor degradation | -42.77% |
| Walk-forward windows | 2 anchored test windows |
| Walk-forward positive test windows | 50.00% |
| Worst walk-forward test P&L | $-61 |
| Median walk-forward avg-trade degradation | 258.17% |
| Parameter sensitivity | 27 <span class="lf0-tooltip" tabindex="0" style="border-bottom: 1px dotted currentColor; cursor: help;" title="Percentage Bands, a band-style indicator that marks stretched prices relative to recent behavior." data-tooltip="Percentage Bands, a band-style indicator that marks stretched prices relative to recent behavior." aria-label="PBands: Percentage Bands, a band-style indicator that marks stretched prices relative to recent behavior.">PBands</span> variants tested; best net P&L $2,839 at n=15, sd=2.0, stop=5.00% |
| Baseline grid result | $957 net P&L; profit factor 1.44 |
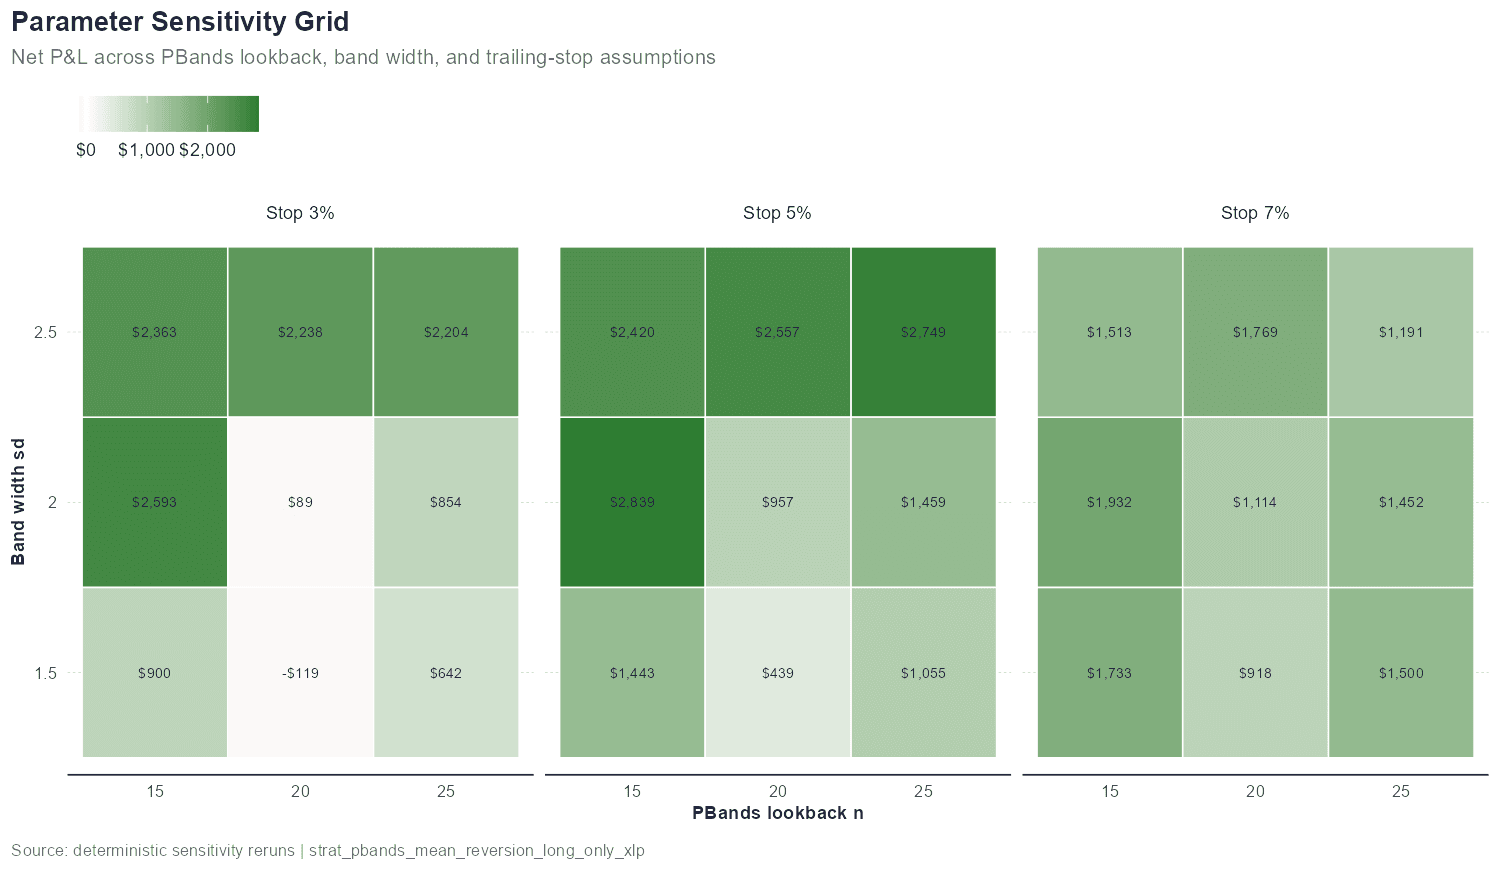
Watch the break-even round-trip cost: above that level, the historical edge is gone. Monte Carlo separates edge from path luck; the in/out row is a closed-trade split, not walk-forward optimization.
What Breaks It
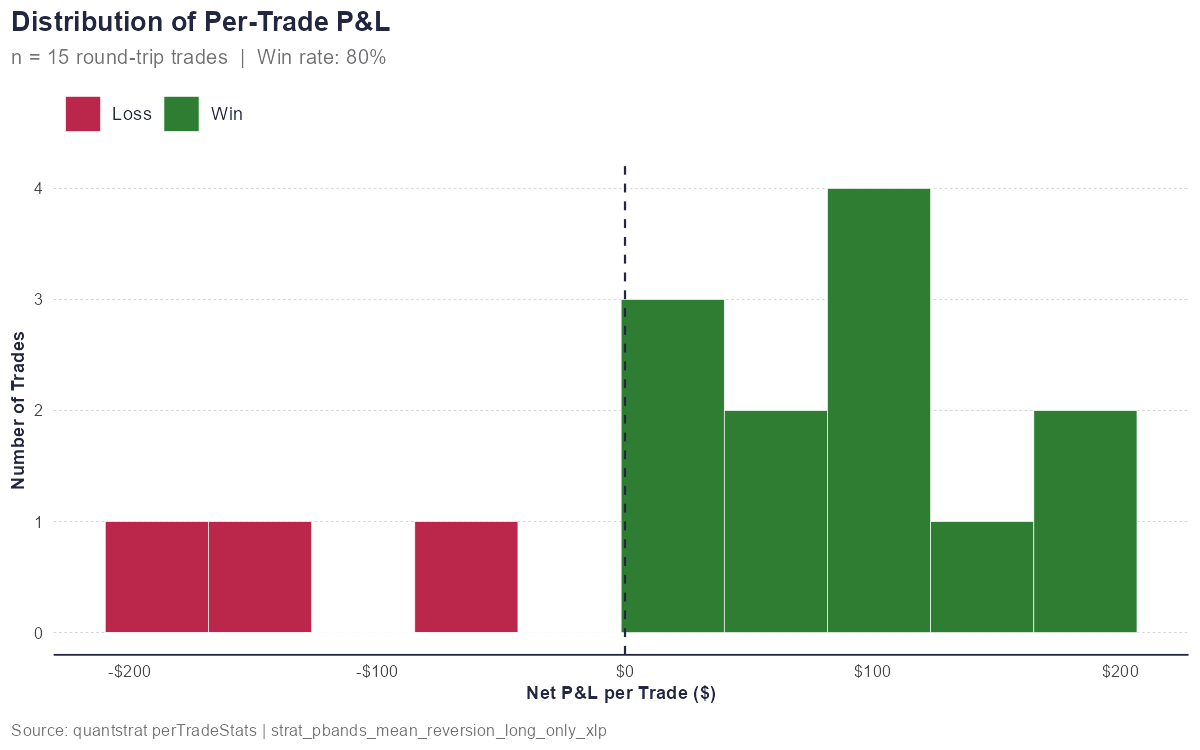
The per-trade P&L distribution is tilted in the right direction, with 30 winners and 15 losers, but it is not a clean, symmetric edge. Most trades are small-to-moderate gains, while the losses are fewer but meaningfully larger: average win was $116.09 versus average loss of -$164.79, and the worst trade lost -$337.34.
Verdict
I set out to test whether an oversold XLP break below a PBands lower envelope reliably captures a short-lived mean-reversion bounce before the move turns into something more durable.
What would change my mind: the same rule needs to survive costs while closing the gap versus buy-and-hold, or prove useful as a timing overlay rather than a standalone strategy.
R Notes
The reproducibility contract is the saved artifact set plus the R scripts that created it. The key JSON/RDS files are recorded in the frontmatter.
# Rebuild the evidence layer for one saved strategy output
source('backtesting_blog_posts/statistical_diagnostics.R')
source('backtesting_blog_posts/walk_forward_diagnostics.R')
source('backtesting_blog_posts/analysis_test_selector.R')

out_dir <- file.path('backtesting_blog_posts', 'outputs', 'strat_pbands_mean_reversion_long_only_xlp')
per_trade <- readRDS(file.path(out_dir, 'per_trade_stats.rds'))
portfolio <- readRDS(file.path(out_dir, 'portfolio_summary.rds'))

diagnostics <- build_statistical_diagnostics(per_trade, portfolio)
walk_forward <- build_walk_forward_summary(per_trade)
test_plan <- build_analysis_test_plan(out_dir)
For the current PBands series, parameter_sensitivity uses a deterministic next-bar rerun helper because native quantstrat parameter clones can fail to propagate osMaxPos limits safely. Future strategy families should call register_parameter_sensitivity_builder() with their own sensitivity builder.
Important: Backtests are simulations. Past performance of a simulated strategy does not guarantee future results. Results do not yet fully account for real-world factors including <span class="lf0-tooltip" tabindex="0" style="border-bottom: 1px dotted currentColor; cursor: help;" title="The gap between the price buyers bid and sellers ask. Crossing that gap is a real trading cost." data-tooltip="The gap between the price buyers bid and sellers ask. Crossing that gap is a real trading cost." aria-label="bid-ask spread: The gap between the price buyers bid and sellers ask. Crossing that gap is a real trading cost.">bid-ask spread</span>, market impact, borrow costs, or taxes. This is for educational purposes only and is not investment advice.
Leave a Comment