
Expected price range
Each range is a ~68% statistical band built from the stock’s own 1-year realised volatility (44% annualised), centred on a path that closes a quarter of the gap to our fair-value midpoint by 3 months and half by 6 months. Starting price $25.47 (close 2026-10-16). This is an illustration of where our view and normal volatility point, not a forecast, price target or investment advice; the stock can move outside it.
| Company | Oct 25 | Nov 25 | Dec 25 | Jan 26 | Feb 26 | Mar 26 | Apr 26 | May 26 | Jun 26 | Jul 26 | Aug 26 | Sep 26 | 12-Mo |
|---|---|---|---|---|---|---|---|---|---|---|---|---|---|
| CSTM | +6% | +7% | +12% | +19% | +11% | -1% | +27% | +10% | -7% | -13% | -5% | -8% | +63% |
| AA | +12% | +14% | +27% | +7% | +9% | +7% | -4% | +22% | -33% | -13% | +11% | -16% | +29% |
| KALU | +18% | +6% | +20% | +7% | +6% | -7% | +42% | +7% | +7% | -18% | -1% | -9% | +92% |
| CENX | +1% | +1% | +31% | +16% | +14% | +14% | +1% | +11% | -30% | -3% | +2% | -21% | +23% |
| MTRN | -5% | +7% | +2% | +11% | +18% | -11% | +27% | +20% | +35% | -29% | +12% | +14% | +124% |
| AMBP | -11% | +5% | +9% | +7% | +10% | -15% | -5% | +5% | +21% | -0% | +7% | -13% | +17% |
Source: Yahoo Finance monthly adjusted close.
Quick Thesis
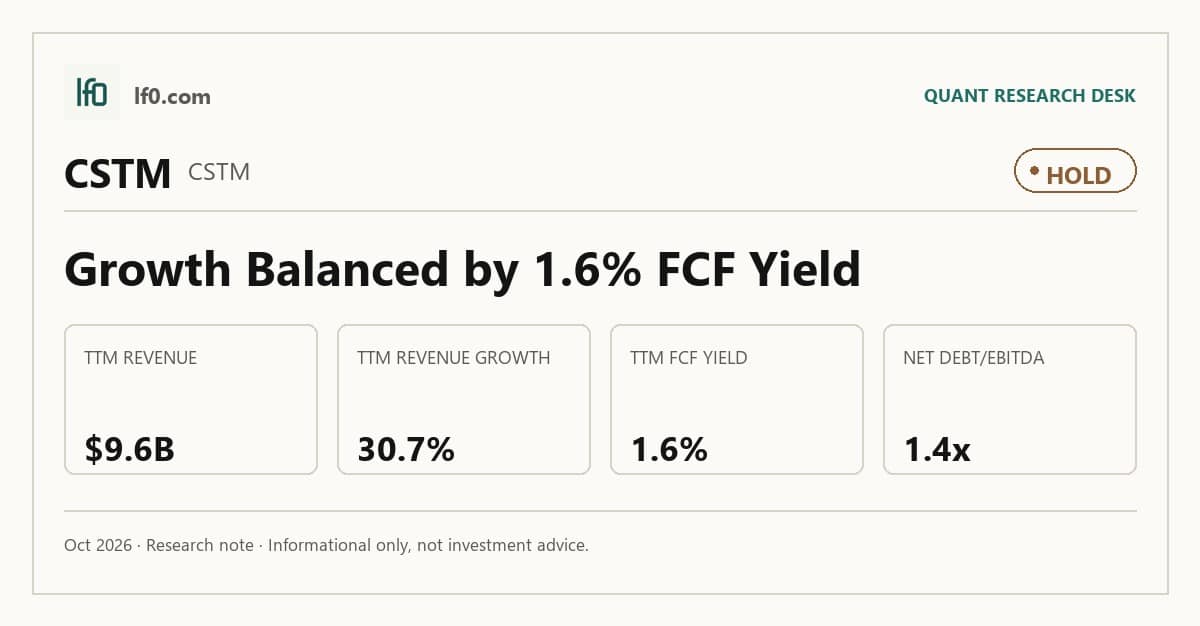
- Rated Hold — growth is real, but cash conversion is still too thin.
- Strongest point: 30.7% TTM revenue growth on $9.6B of sales.
- Main risk: only $53.6M of levered free cash flow TTM, or 0.6% FCF margin.
- Valuation looks fair: 4.2x EV/EBITDA and 1.6% FCF yield.
- I would turn more constructive if FCF yield moved above 4.0%.
Executive Summary
Rating: HOLD | CSTM
Measured from adjusted close on 2026-10-19 to 2026-10-19. Sell ratings are correct when the stock falls; Hold is tracked as a +/-10% range. Daily-close data, not intraday. Calls are tracked for 182 days from publication, then frozen as a final record.
I would put my rating as a Hold because Constellium is growing fast enough to support the current multiple, but not yet converting that growth into enough free cash flow to justify a Buy. Revenue rose 30.7% TTM to $9.6B, yet levered free cash flow was only $53.6M TTM and FCF margin was 0.6%, which tells me the recovery is still more visible in the income statement than in equity cash returns. The stock has already rerated, with a 59.7% 52-week gain and a share price above both the $26.44 and the $27.75, so the market has already paid for part of the rebound. I would raise my rating more towards a Buy if EBITDA stayed above $325M for another quarter and free cash flow moved materially higher, because that would show the Q2 2026 step-down was temporary rather than the start of a weaker cash cycle.
Company Profile
Constellium SE is a France-based Societas Europaea that develops, manufactures, and sells specialty rolled and extruded aluminum products for aerospace, space, defense, packaging, automotive, commercial transportation, and general industrial customers. It earns revenue by converting aluminum into semi-fabricated and, in some cases, fully fabricated alloyed products, with pricing designed to pass through London Metal Exchange aluminum costs and preserve conversion margin. The company was formed from the 2011 separation of Alcan Engineered Products and later became a public company through a 2013 initial public offering. It operates 24 manufacturing facilities, 3 research and development centers, and 3 administrative centers across North America, Europe, and Asia, and it is listed on the New York Stock Exchange under CSTM.
Economic Moat
Business Model
The hardest part of Constellium’s model to copy within 3 years is the qualification process and customer-specific engineering around technically advanced aluminum products. Many aerospace, defense, packaging, and automotive products require long qualification cycles, close customer collaboration, and joint product development, while the company also holds more than 270 active patent families. That combination matters because a new entrant can buy equipment, but it cannot quickly recreate the approvals, process know-how, and embedded technical relationships that support Constellium’s higher-value product mix. I also see a secondary advantage in its metal price neutrality model, since the company prices products to include the cost of purchased metal and uses hedges or back-to-back arrangements to limit exposure, which makes earnings less dependent on aluminum price swings than a pure commodity processor.
Business & Operating Risks
Customer concentration and pricing pressure are the most material disclosed risks, because a limited number of customers account for a substantial portion of sales and contracts can be renewed, renegotiated, or repriced at periodic intervals. That mechanism can hit revenue and margin at the same time, and the current financial data already shows how sensitive the model is to that squeeze through thin free cash flow and modest operating margin. Trade policy is the next major risk: the company says the U.S. initiated new import tariffs and quotas in 2025, and it warns that future developments could have a substantial adverse effect on supply chains and the aluminum industry. Energy and raw-material pass-through risk is also real, since natural gas and electricity are a large component of cost of sales and the company may not be able to fully pass through higher input costs quickly enough. The debt and covenant stack is the clearest balance-sheet risk, because a covenant breach could trigger default or refinancing pressure if cash flow weakens. Taken together, these risks do not break the moat, but they do threaten the pricing discipline and cash conversion that the moat is supposed to support.
Management Discussion & Analysis
Management is responding to those risks with a mix of pricing discipline, capital spending, and shareholder returns, but the cash conversion remains the key test. In 2025, Constellium repurchased 8.9 million ordinary shares for $115M while funding $311M of capital expenditures, which tells me management is willing to return cash even before free cash flow becomes abundant. The company also kept growth spend focused on recycling and casting capacities, which is constructive because those projects can support conversion margins rather than just add volume. Operating results improved, with revenue up 15.0% to $8.4B and adjusted EBITDA up to $1.8B, but the recovery was uneven: aerospace demand was still lower because of destocking, automotive remained weak in Europe, and AS&I adjusted EBITDA fell 3.0% to $72M. That is why I read management’s tone as credible but not fully de-risked. The 2025 filing’s caution on 2024 headwinds was justified, yet the cash-flow improvement was not strong enough to make the balance sheet feel self-funding.
Recent Events
The most important recent event is the March 12, 2026 authorization of a new $300M share repurchase program, effective after the May 21, 2026 annual meeting and running through December 31, 2028. I read that as a confidence signal, but not as proof that the balance sheet has excess cash to spare. The annual meeting also approved Ingrid Joerg’s appointment and John Ormerod’s re-appointment to the board, which looks like governance continuity rather than a strategic reset. The February 18, 2026 and April 29, 2026 8-Ks were routine earnings releases, so they do not add a new catalyst by themselves. The buyback authorization supports the moat thesis only indirectly: it shows management believes the business can keep generating cash, but it does not change the underlying customer concentration or pricing risks.
Financial Analysis
Growth
CSTM — Financial Growth (Quarterly, USD Mil)
| Metric | 2025-03-31 | 2025-06-30 | 2025-09-30 | 2025-12-31 | 2026-03-31 | 2026-06-30 |
|---|---|---|---|---|---|---|
| REVENUE (USD Mil) | — | 2,103 | 2,166 | 2,201 | 2,461 | 2,748 |
| EBIT (USD Mil) | — | 83 | 153 | 190 | 273 | 241 |
| EBITDA (USD Mil) | — | 165 | 237 | 276 | 356 | 325 |
| NET INCOME (USD Mil) | — | 36 | 88 | 112 | 199 | 146 |
| DILUTED EPS | 0.3 | 0.2 | 0.6 | — | 1.5 | 1 |
Source: Yahoo Finance — Quarterly Financial Statements
Revenue rose from $2.1B in Q2 2025 to $2.7B in Q2 2026, and EBITDA increased from $165M to $325M over the same span. That is a strong top-line and earnings recovery, but the Q2 2026 EBITDA pullback from $356M in Q1 2026 tells me the trend is not yet linear. Net income also moved higher, from $36M in Q2 2025 to $146M in Q2 2026, which is consistent with the operating leverage the business can produce when pricing and mix cooperate. The key question is whether that growth can hold without another step down in margin.
Profitability
CSTM — Profitability (TTM)
| Metric | TTM |
|---|---|
| Operating Margin (TTM) | 8.9% |
| Net Margin (TTM) | 5.7% |
| Return on Assets (TTM) | 9.9% |
| Return on Equity (TTM) | 53.1% |
| Gross Margin (TTM) | 16.6% |
| EBITDA Margin (TTM) | 13.0% |
Source: Yahoo Finance — Trailing Twelve Months (TTM)
TTM operating margin was 8.9%, EBITDA margin was 13.0%, gross margin was 16.6%, and net margin was 5.7%. The spread between gross margin and operating margin is 7.6 points, which tells me the business is converting a reasonable share of gross profit into operating profit, but not at a level that would support a premium industrial multiple. Return on assets was 9.9% TTM, while return on equity was 53.1%; that wide gap shows equity returns are being amplified by leverage rather than by exceptionally high asset productivity. The gap between EBITDA margin and net margin is 7.3 points, so depreciation, amortisation, and interest still matter, but they are not overwhelming the earnings base. Profitability is improving, yet it is still more cyclical than durable.
Valuation
CSTM — Valuation Multiples
| Metric | Value |
|---|---|
| Current Share Price (USD) | 25.5 |
| Market Cap (USD Mil) | 3,452 |
| Enterprise Value (USD Mil) | 5,220 |
| Trailing P/E | 6.6 |
| Forward P/E | 9.4 |
| Price/Sales (TTM) | 0.4 |
| Price/Book (mrq) | 2.8 |
| EV/Revenue | 0.5 |
| EV/EBITDA | 4.2 |
| Beta (5Y Monthly) | 1.57 |
| FCF Yield % (TTM) | 1.6% |
| Forward EPS (USD) | 2.7 |
| Analyst Target Price – Low (USD) | 28.1 |
| Analyst Target Price – Mean (USD) | 33.7 |
| Analyst Target Price – High (USD) | 37.2 |
| # Analyst Opinions | 6 |
Source: Yahoo Finance
Constellium trades at 0.55x EV/Revenue and 4.2x EV/EBITDA on a current share price of $25.5, which is a modest multiple for a business with $9.6B of TTM revenue and $1.6B of gross profit. Trailing P/E is 6.6x and forward P/E is 9.4x, with forward EPS of $2.7, so the market is paying for earnings that are not expensive if they hold, but not cheap if the cycle softens. FCF yield is only 1.6% TTM, which keeps this from looking like a clear cash-return story even though the stock is not demanding a premium multiple. On the analysis here, I would put fair value in a range of about $24–$31 per share, which sits below the $33.7 analyst mean target but inside the $28.1–$37.2 analyst range; I weight the weak cash yield and only moderate free cash flow more heavily than the consensus appears to. On an EPS basis, I would frame fair value around $2.5–$3.0 of annual EPS, which is close to the company’s $2.7 forward EPS and broadly in line with peers that are trading on stronger cash conversion rather than just headline growth. The stock looks fairly valued rather than cheap, because the growth is real but the cash yield is still too thin to justify a stronger premium.
Leverage
CSTM — Leverage & Coverage (Quarterly)
| Metric | Value |
|---|---|
| Total Debt/Equity % (mrq) | 153.3 |
| Current Ratio (mrq) | 1.4 |
| Total Debt (mrq, USD Mil) | 1,923 |
| Operating Cash Flow (TTM, USD Mil) | 551 |
| Levered Free Cash Flow (TTM, USD Mil) | 53.6 |
| Net Debt/EBITDA (TTM) | 1.4 |
| FCF Margin % (TTM) | 0.6% |
Source: Yahoo Finance — Quarterly Financial Statements
Total debt was $1.9B at mrq, with debt to equity at 153.4% and a current ratio of 1.43x. Operating cash flow was $551M TTM, while levered free cash flow was only $53.6M TTM, so most of the earnings base is being absorbed by capex, working capital, or interest rather than dropping through to equity cash flow. Net debt to EBITDA was 1.4x and FCF margin was 0.6% TTM, which leaves room to absorb a downturn but not much cushion if aluminum markets weaken or refinancing needs arrive before cash conversion improves. In my view, this is manageable leverage, but it is not a balance sheet that can absorb much execution slippage.
Insider Activity
The insider transaction record is clearly net selling, with 26 open-market sales totaling $12.2M versus 6 purchases totaling $167,089 over 2026-02-20 to 2026-06-04. The selling is broad rather than concentrated, because multiple executives and directors transacted on the sell side while only two insiders bought. I do not treat that as a thesis breaker, but it does weaken the signal from the buyback authorization because management is not uniformly adding exposure alongside the company’s repurchases.
Comparable Analysis
Growth
| Company | Revenue TTM (USD Mil) | Revenue Growth YoY % | Diluted EPS TTM |
|---|---|---|---|
| CSTM | 9,576 | 30.7% | 3.9 |
| AA | 14,312 | 23.7% | 5.8 |
| KALU | 4,135.9 | 52.7% | 13.5 |
| CENX | 2,667.2 | 19.7% | 5.8 |
| MTRN | 2,098.3 | 42.2% | 4.3 |
| AMBP | 5,991 | 17.7% | 0.1 |
Source: Yahoo Finance
CSTM’s revenue growth was 30.7% TTM on $9.6B of revenue, ahead of AA at 23.7% and AMBP at 17.7%, though behind KALU at 52.7% and MTRN at 42.2%. That mix says the market is paying for a solid mid-cycle growth profile, but KALU and MTRN are growing faster, so CSTM’s growth case only works if its earnings quality proves more durable than theirs.
Valuation
| Company | Current Share Price (USD) | Trailing P/E | Forward P/E | EV/Revenue | EV/EBITDA | Price/Sales (TTM) | Price/Book (mrq) | Beta (5Y Monthly) | FCF Yield % (TTM) | Forward EPS | Analyst Target Price – Low | Analyst Target Price – Mean | Analyst Target Price – High | # Analyst Opinions |
|---|---|---|---|---|---|---|---|---|---|---|---|---|---|---|
| CSTM | 25.5 | 6.6 | 9.4 | 0.5 | 4.2 | 0.4 | 2.8 | 1.57 | 1.6% | 2.7 | 28.1 | 33.7 | 37.2 | 6 |
| AA | 41.5 | 7.2 | 7.5 | 0.8 | 4 | 0.8 | 1.3 | 1.74 | 8.4% | 5.5 | 48 | 59.8 | 80 | 13 |
| KALU | 147.2 | 10.9 | 12.7 | 0.8 | 7.4 | 0.6 | 2.5 | 1.58 | 1.4% | 11.6 | 146 | 170.2 | 184 | 5 |
| CENX | 35 | 6.1 | 3.1 | 1.4 | 7.8 | 1.3 | 2.5 | 2.08 | -1.3% | 11.4 | 40 | 60.2 | 79 | 5 |
| MTRN | 245.4 | 57.2 | 29.1 | 2.7 | 27.3 | 2.4 | 5.1 | 1.05 | 0.3% | 8.4 | 278.7 | 303.7 | 330 | 5 |
| AMBP | 4.7 | 93.6 | 15.4 | 1.2 | 9 | 0.5 | -3.7 | 0.53 | 9.5% | 0.3 | 4.5 | 5 | 6 | 7 |
Source: Yahoo Finance
CSTM’s 0.55x EV/Revenue is below AA at 0.79x, KALU at 0.82x, CENX at 1.4x, MTRN at 2.7x, and AMBP at 1.2x, so the stock is not asking for a premium multiple despite stronger growth than AA and AMBP. On FCF yield, CSTM at 1.6% trails AA at 8.4% and AMBP at 9.5%, while KALU is at 1.4%, CENX at -1.3%, and MTRN at 0.3%; that makes CSTM look cheaper than the low-yield growth names but clearly not as cash-generative as AA or AMBP. The peer spread is wide, which is why I would not anchor too hard on a single multiple: CSTM is cheaper than the richer names, but its weak cash conversion keeps it from looking like the best value in the group.
Profitability
| Company | Operating Margin (TTM) | Net Margin (TTM) | Return on Assets (TTM) | Return on Equity (TTM) | Gross Margin (TTM) | EBITDA Margin (TTM) |
|---|---|---|---|---|---|---|
| CSTM | 8.9% | 5.7% | 9.9% | 53.1% | 16.6% | 13.0% |
| AA | 16.2% | 10.7% | 7.5% | 20.6% | 22.8% | 20.0% |
| KALU | 10.6% | 5.5% | 7.8% | 26.4% | 14.5% | 11.1% |
| CENX | 28.1% | 22.6% | 10.2% | 51.7% | 18.9% | 18.0% |
| MTRN | 8.6% | 4.3% | 4.6% | 9.5% | 16.0% | 9.8% |
| AMBP | 6.8% | 0.7% | 3.5% | — | 12.8% | 12.9% |
Source: Yahoo Finance
CSTM’s operating margin of 8.9%, net margin of 5.7%, gross margin of 16.6%, and EBITDA margin of 13.0% all sit below AA’s 16.2%, 10.7%, 22.8%, and 20.0%, and below CENX’s 28.1%, 22.6%, 18.9%, and 18.0% on the same measures. The gap looks structural rather than purely cyclical because CSTM’s gross margin is already lower than AA’s and CENX’s, which points to a cost-of-revenue disadvantage, not just a heavier opex load. CSTM’s ROE of 53.1% and ROA of 9.9% are strong, but the leverage-adjusted return profile is not clearly superior to CENX’s 51.7% ROE and 10.2% ROA.
Leverage
| Company | Total Debt/Equity % (mrq) | Current Ratio (mrq) | Operating Cash Flow TTM (USD Mil) | Free Cash Flow TTM (USD Mil) | Net Debt/EBITDA (TTM) | FCF Margin % (TTM) |
|---|---|---|---|---|---|---|
| CSTM | 153.3 | 1.4 | 551 | 53.6 | 1.4 | 0.6% |
| AA | 58.5 | 2.3 | 1,609 | 921.8 | 0.1 | 6.4% |
| KALU | 113.3 | 2.5 | 185.9 | 33 | 2.2 | 0.8% |
| CENX | 31.3 | 2.8 | 340.8 | -46.3 | 0.3 | -1.7% |
| MTRN | 51.4 | 2.9 | 108.3 | 13.4 | 2.4 | 0.6% |
| AMBP | — | 1.1 | 495 | 264.6 | 5.4 | 4.4% |
Source: Yahoo Finance
CSTM’s debt/equity of 153.4% is higher than AA’s 58.5%, KALU’s 113.3%, and CENX’s 31.3%, but CSTM’s net debt/EBITDA of 1.4x is better than KALU’s 2.2x, MTRN’s 2.4x, and AMBP’s 5.4x because CSTM carries $163M of cash. That tells me the balance sheet is levered on a book basis but not stretched on a cash-flow basis, so the leverage is a financing choice rather than an immediate stress point. The stronger growth profile would normally justify more valuation support, but the thin free cash flow means the market is not paying up for that growth the way it does for some peers.
Conclusion
What keeps this at Hold is the tension between real operating improvement and weak cash conversion. Constellium has enough growth, margin recovery, and balance-sheet stability to avoid a bearish call, but the 0.6% FCF margin and $53.6M of levered free cash flow TTM tell me the recovery has not yet translated into the kind of cash generation that would justify a Buy. I would raise my rating more towards a Buy if EBITDA stayed above $325M for another quarter and free cash flow moved closer to $100M, because that would show the Q2 2026 step-down was temporary and that the business is starting to compound cash rather than just earnings. I would move from Hold to Sell if the next two quarters show EBITDA slipping below $300M and free cash flow staying near breakeven, because that would mean the current 4.2x EV/EBITDA multiple is being paid for earnings that are not converting into cash. A drop in operating margin toward the mid-7% range would also matter, since on this revenue base every 1 point of margin loss is roughly $96M of annual operating profit, enough to slow deleveraging and weaken the buyback case. My final view is that the bear case is more likely to show up first if execution slips, but the current numbers are still good enough to keep the stock in Hold territory rather than forcing a Sell.
What to Watch Next
- EBITDA above $325M for another quarter — would support moving the rating toward Buy.
- Free cash flow near $100M — would show the recovery is turning into cash.
- Operating margin holding near 9% — would confirm the margin rebound is sticking.
- EBITDA below $300M for two quarters — would argue for a lower rating.
- Free cash flow staying near breakeven — would weaken the buyback case and raise downside risk.
What’s your take? I rated Constellium (CSTM) HOLD above — but the goal here is to get this right, not just to publish an opinion. What would you add to this analysis, or which risk or catalyst do you think I’m under- or over-weighting? Tell me in the comments.
Sources
- SEC 10-K Annual Report — filed 2026-02-25
- SEC 8-K Filing (2026-05-21)
- SEC 8-K Filing (2026-04-29)
- SEC 8-K Filing (2026-03-12)
- SEC 8-K Filing (2026-02-18)
- SEC Form 4 Insider Transaction (2026-06-08)
- SEC Form 4 Insider Transaction (2026-06-01)
- SEC Form 4 Insider Transaction (2026-05-18)
- SEC 10-K Annual Report — FY2026
- SEC 10-K Annual Report — FY2025
Data sourced from Yahoo Finance and SEC EDGAR. Not investment advice.
Leave a Comment