
Expected price range
Each range is a ~68% statistical band built from the stock’s own 1-year realised volatility (36% annualised), centred on a path that closes a quarter of the gap to our fair-value midpoint by 3 months and half by 6 months. Starting price $478 (close 2026-10-16). This is an illustration of where our view and normal volatility point, not a forecast, price target or investment advice; the stock can move outside it.
| Company | Oct 25 | Nov 25 | Dec 25 | Jan 26 | Feb 26 | Mar 26 | Apr 26 | May 26 | Jun 26 | Jul 26 | Aug 26 | Sep 26 | 12-Mo |
|---|---|---|---|---|---|---|---|---|---|---|---|---|---|
| MPC | +1% | -0% | -16% | +8% | +13% | +23% | +2% | +1% | +3% | +24% | +18% | +6% | +109% |
| VLO | -0% | +5% | -8% | +11% | +13% | +21% | +2% | -3% | +6% | +21% | +15% | +8% | +132% |
| XOM | +1% | +2% | +4% | +18% | +9% | +11% | -9% | -5% | -6% | +14% | +4% | +1% | +49% |
| PSX | +0% | +1% | -6% | +11% | +8% | +18% | -2% | -1% | -4% | +25% | +17% | +4% | +93% |
| CVX | +2% | -3% | +1% | +16% | +7% | +11% | -7% | -5% | -9% | +19% | +6% | -1% | +37% |
| BP | +2% | +4% | -4% | +9% | +4% | +21% | +1% | -11% | -12% | +22% | -4% | +3% | +34% |
Source: Yahoo Finance monthly adjusted close.
Quick Thesis
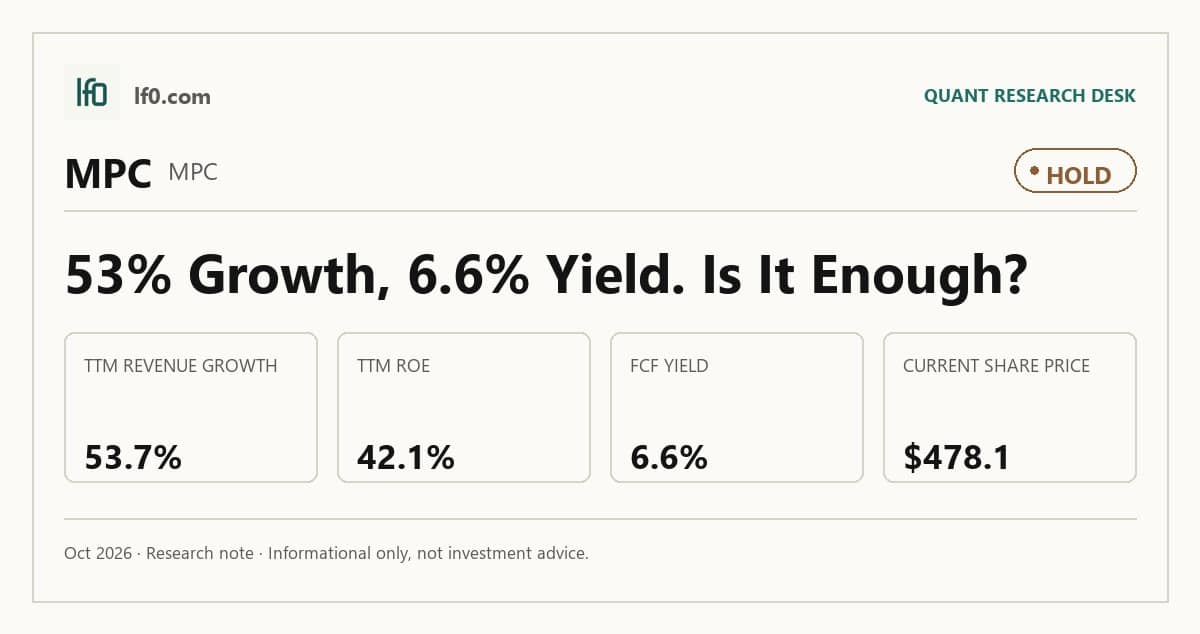
- Rated hold — the stock already discounts strong 2026 earnings and cash generation.
- Strongest support: $9.2B TTM levered free cash flow and 13.6% operating margin.
- Main risk: $34.3B of debt, with net debt/EBITDA at 1.7x.
- Valuation is fair to slightly expensive at 10.9x EV/EBITDA and a 6.6% FCF yield.
- I would turn more constructive if EBITDA stays above $8B for another quarter.
Executive Summary
Rating: HOLD | MPC
Measured from adjusted close on n/a to 2026-10-16. Sell ratings are correct when the stock falls; Hold is tracked as a +/-10% range. Daily-close data, not intraday. Calls are tracked for 182 days from publication, then frozen as a final record.
I would put my rating as a Hold because Marathon Petroleum’s earnings power is strong, but the shares already reflect much of that improvement. Q2 2026 revenue reached $52B and EBITDA rose to $8.2B, which shows the business can still generate substantial cash at scale, yet the stock at $478.1 sits near the 52-week high of $485.2 and above the $442.3 analyst mean target. In my view, that leaves too little valuation cushion for a Buy.
The key question is whether the Q2 step-up is durable. I would become more constructive if MPC can keep EBITDA above $8B for another quarter and hold levered free cash flow near the current $9.2B TTM run rate, because that would show the recent earnings strength is not just a temporary margin spike.
Company Profile
Marathon Petroleum is an integrated downstream and midstream energy company with three segments: Refining & Marketing, Midstream, and Renewable Diesel. It refines about 3.0 million barrels per day across 13 refineries in the Gulf Coast, Mid-Continent, and West Coast regions, then sells gasoline, distillates, asphalt, propane, and other products through wholesale channels, branded jobbers, direct dealers, exports, and long-term supply contracts. It also owns the general partner of MPLX, a master limited partnership formed in 2012, and about 64% of MPLX common units.
The company’s structure matters because it links refining, logistics, and midstream cash flow in one system. That integration gives MPC more ways to move product, manage outages, and capture margin than a stand-alone refiner would have.
Economic Moat
Business Model
The most defensible part of Marathon Petroleum’s business is the integrated refining and logistics network. According to its SEC filings, the company combines about 3.0 million barrels per day of refining capacity with one of the largest terminal operations in the United States and one of the largest private domestic fleets of inland petroleum product barges. I feel that a competitor would struggle to copy that system quickly because the value is not just the refineries, but the connected network that moves intermediate products between Gulf Coast, Mid-Continent, and West Coast assets to optimize yields and keep units running through partial shutdowns.
The wholesale and branded distribution footprint adds another layer of durability. As of December 31, 2025, MPC had 7,882 brand jobber outlets in 40 states, the District of Columbia, and Mexico, plus 1,162 direct dealer locations mainly under the ARCO brand. The renewable diesel platform also matters, with the Dickinson, North Dakota facility at 184 million gallons per year and the Martinez Renewables joint venture at 730 million gallons per year, including pretreatment capabilities. I view those assets as harder to duplicate than a standalone refinery because they tie together feedstock access, compliance credits, and distribution through the same network.
Business & Operating Risks
Volatile refining margins are the clearest company-specific risk because Marathon Petroleum’s operating results, cash flows, growth rate, asset carrying values, and ability to execute share repurchases and pay its dividend are all highly dependent on the margins it realizes on refined products. The filing is explicit that feedstock and product prices can move independently, that the company buys feedstocks weeks before it sells refined products, and that lower margins, including renewable diesel margins, may force it to cut output, capital spending, buybacks, and dividends. That risk is already visible in the numbers here because the equity case depends on spread conditions staying favorable.
Regulatory pressure on transportation fuels is the second major risk. The 10-K points to Advanced Clean Cars I, Advanced Clean Cars II, Advanced Clean Trucks, EPA vehicle standards, and the possibility that greater adoption of electric, hybrid, and alternative-fuel vehicles could reduce demand for liquid transportation fuels. It also flags Renewable Identification Numbers and Low Carbon Fuel Standard credits as volatile compliance costs, with no regulatory method for verifying the validity of most RINs sold on the open market. In my view, this is a slower-moving threat than margin volatility, but it still matters because it can erode demand and raise compliance expense over time.
California-specific intervention is the third risk. California’s Senate Bill No. 2 and Assembly Bill No. 1 authorize a maximum gross gasoline refining margin, financial penalties above that cap, turnaround and maintenance oversight, and minimum inventory requirements for transportation fuels. Marathon also discloses that the California Energy Commission adopted orders in August 2025 on both margin oversight and minimum inventory proceedings, so this is not theoretical. The risk does not break the moat, but it does put pressure on the California refining and renewable diesel assets that help support it.
The disclosed risks threaten the moat mainly through margin regulation and policy pressure, not through the loss of the integrated network itself.
Management Discussion & Analysis
Management is actively reshaping the portfolio toward midstream growth and balance-sheet-supported flexibility. In 2025 it closed the $2.4B Northwind Midstream acquisition, the $703M BANGL purchase plus an earnout of up to $275M, and the $235M Whiptail Midstream deal, while also selling the Rockies assets for $980M in cash and the 49.9% TAMH stake for $427M. That mix says capital is being recycled into Permian-to-Gulf Coast natural gas and NGL value chains, which supports a longer-duration cash flow base, but it also means investors should read the 2025 activity as expansion rather than deleveraging.
The 2026 capital investment outlook of about $1.5B for MPC, excluding MPLX, plus $2.7B for MPLX reinforces that management is still prioritizing growth projects, refinery optimization, and export capacity. The refining narrative is more constructive than the 2024 version because 2025 refining and marketing adjusted EBITDA rose to $6.1B from $5.7B, but the company is still leaning on a favorable crack-spread backdrop and lower crude costs rather than a structural step-up in unit economics. Share repurchases also remain aggressive, with $3.4B spent in 2025 and $4.4B still authorized, which signals confidence in cash generation while keeping the capital structure active.
Management is responding to the risks above by adding liquidity and shifting the asset mix, but the margin and policy risks themselves remain live.
Recent Events
The most important recent development is the April 7, 2026 refinancing of Marathon Petroleum’s revolving credit lines. MPC replaced its prior facility with a new $5B unsecured revolver that runs to April 7, 2031, and MPLX also put in place a new $2.5B five-year revolver on the same date. Both facilities were signed with no borrowings outstanding, so this is not a rescue financing; it strengthens liquidity and extends maturity walls.
The April 29, 2026 annual meeting was less constructive on governance change. Shareholders re-elected the board and approved executive pay, but rejected both declassification and supermajority elimination because neither amendment cleared the required 80% threshold. In my view, that keeps governance protections intact and slows any structural simplification.
MPC’s FY2025 results and Q1 2026 earnings release did not add a new strategic catalyst beyond the liquidity upgrade. Recent events modestly strengthen the balance-sheet side of the moat, but they do not change the core operating thesis.
Financial Analysis
Growth
MPC — Financial Growth (Quarterly, USD Mil)
| Metric | 2025-06-30 | 2025-09-30 | 2025-12-31 | 2026-03-31 | 2026-06-30 |
|---|---|---|---|---|---|
| REVENUE (USD Mil) | 33,799 | 34,809 | 32,574 | 34,200 | 51,994 |
| EBIT (USD Mil) | 2,221 | 2,744 | 2,751 | 1,420 | 7,381 |
| EBITDA (USD Mil) | 3,010 | 3,585 | 3,579 | 2,229 | 8,219 |
| NET INCOME (USD Mil) | 1,216 | 1,370 | 1,535 | 511 | 5,138 |
| DILUTED EPS | 4 | 4.5 | 5.1 | 1.7 | 17.7 |
Source: Yahoo Finance — Quarterly Financial Statements
Revenue moved from $33.8B in Q2 2025 to $34.8B in Q3 2025, then $32.6B in Q4 2025, before rising to $34.2B in Q1 2026 and jumping to $52B in Q2 2026. That is a 53.0% year-over-year increase in Q2 2026, and the step-up is consistent with stronger realized refining margins and Midstream growth from the Northwind Midstream and BANGL acquisitions. EBITDA rose to $8.2B in Q2 2026 from $3B a year earlier, so operating leverage is working rather than just top-line inflation.
The Q1 2026 dip to $34.2B looks like a pause, not a break in the trend. More importantly, the revenue and EBITDA rebound supports the moat thesis above: the integrated system is still translating scale into earnings when spreads cooperate.
Profitability
MPC — Profitability (TTM)
| Metric | TTM |
|---|---|
| Operating Margin (TTM) | 13.6% |
| Net Margin (TTM) | 5.5% |
| Return on Assets (TTM) | 8.7% |
| Return on Equity (TTM) | 42.1% |
| Gross Margin (TTM) | 12.8% |
| EBITDA Margin (TTM) | 10.0% |
Source: Yahoo Finance — Trailing Twelve Months (TTM)
TTM operating margin was 13.6%, gross margin was 12.8%, and EBITDA margin was 10.0%, which shows Marathon Petroleum is already profitable at the operating level and is converting most of its gross profit into pre-depreciation earnings. The narrow 0.8 percentage point gap between gross and operating margin suggests opex is controlled, so the business is not relying on extreme scale leverage to stay profitable.
TTM net margin was 5.5%, which is lower than operating margin because interest, taxes, and other below-operating items still take a meaningful bite out of earnings. TTM ROA was 8.7% and TTM ROE was 42.1%, and that wide gap tells me equity returns are being amplified by leverage as well as by asset efficiency. The key point is that profitability is strong enough to support the balance sheet, but not so strong that leverage stops mattering.
Valuation
MPC — Valuation Multiples
| Metric | Value |
|---|---|
| Current Share Price (USD) | 478.1 |
| Market Cap (USD Mil) | 139,566 |
| Enterprise Value (USD Mil) | 167,421 |
| Trailing P/E | 16.6 |
| Forward P/E | 8.5 |
| Price/Sales (TTM) | 0.9 |
| Price/Book (mrq) | 7.1 |
| EV/Revenue | 1.1 |
| EV/EBITDA | 10.9 |
| Beta (5Y Monthly) | 0.54 |
| FCF Yield % (TTM) | 6.6% |
| Forward EPS (USD) | 55.9 |
| Analyst Target Price – Low (USD) | 236 |
| Analyst Target Price – Mean (USD) | 442.3 |
| Analyst Target Price – High (USD) | 560 |
| # Analyst Opinions | 18 |
Source: Yahoo Finance
Marathon Petroleum’s primary valuation anchor is 10.9x EV/EBITDA, with EV/Revenue at 1.1x and Price/Sales at 0.9x. At a current share price of $478.1, the market is paying for a refining and midstream platform that can keep generating double-digit EBITDA on a normalized basis. The 6.6% FCF yield and 1.7x net debt/EBITDA show the equity is still cash-generative and not balance-sheet constrained, so the multiple is pricing in durable cash conversion rather than a one-cycle spike.
The trailing P/E is 16.6x, while forward P/E falls to 8.5x on $55.9 of forward EPS, which implies the market expects earnings to normalize sharply higher from the latest run rate. Price/book is 7.1x, so investors are paying for asset earnings power rather than liquidation value, and beta of 0.5 fits a stock the market views as less volatile than the broader market. With 18 analyst opinions, the consensus target range of $236 to $560 brackets the current price, so my fair-value range is not far from where the stock already trades. On the analysis here, I would put fair value roughly in the $430-$520 range, which sits inside the analyst band but below the high end because I weight the leverage and cycle risk more heavily than the consensus appears to. That range also implies the market is already discounting a strong earnings base, not a deep rerating.
Leverage
MPC — Leverage & Coverage (Quarterly)
| Metric | Value |
|---|---|
| Total Debt/Equity % (mrq) | 133.3 |
| Current Ratio (mrq) | 1.2 |
| Total Debt (mrq, USD Mil) | 34,292 |
| Operating Cash Flow (TTM, USD Mil) | 17,126 |
| Levered Free Cash Flow (TTM, USD Mil) | 9,249.4 |
| Net Debt/EBITDA (TTM) | 1.7 |
| FCF Margin % (TTM) | 6.0% |
Source: Yahoo Finance — Quarterly Financial Statements
Marathon Petroleum’s leverage is manageable, not stretched. Total debt/equity was 133.3%, current ratio was 1.2, and total debt was $34.3B, which means the balance sheet is debt-heavy but still liquid enough to meet near-term obligations without immediate stress. Operating cash flow was $17.1B and levered free cash flow was $9.2B, so cash generation is covering debt service and leaving room for buybacks, capex, or debt reduction.
Net debt/EBITDA was 1.7x and FCF margin was 6.0%, which tells me EBITDA is converting into cash at a respectable rate, although not so strongly that leverage becomes a clear competitive advantage. The large absolute debt load matters, but the ratio profile explains why the balance sheet can look heavy in dollars and still remain serviceable in leverage terms.
Insider Activity
The insider transaction record I see here is net selling, with 9 open-market sales versus 2 open-market purchases over the 2025-01-02 to 2026-06-04 window. The selling is concentrated, led by Henschen Michael A II and Hessling Ricky D., so this is not broad-based across the full insider group, but it still leaves insiders as net sellers. I read that as a mildly bearish signal rather than a decisive one.
Comparable Analysis
Growth
| Company | Revenue TTM (USD Mil) | Revenue Growth YoY % | EBITDA TTM (USD Mil) | Diluted EPS TTM |
|---|---|---|---|---|
| MPC | 154,146 | 53.7% | 15,397 | 28.9 |
| VLO | 132,430 | 51.7% | 13,379 | 24 |
| XOM | 361,060 | 44.1% | 67,937 | 7.8 |
| PSX | 152,167 | 53.1% | 9,925 | 17.5 |
| CVX | 209,384 | 53.5% | 50,662 | 10.4 |
| BP | 215,465 | 48.2% | 39,198 | 2 |
Source: Yahoo Finance
MPC’s revenue growth of 53.7% TTM and diluted EPS of 28.9 lead the group, versus VLO at 51.7% and 24, PSX at 53.1% and 17.5, CVX at 53.5% and 10.4, XOM at 44.1% and 7.8, and BP at 48.2% and 2.0. That is a real earnings lead, so MPC’s growth profile is justified rather than merely cyclical noise.
Valuation
| Company | Current Share Price (USD) | Trailing P/E | Forward P/E | EV/Revenue | EV/EBITDA | Price/Sales (TTM) | Price/Book (mrq) | Market Cap (USD Mil) | Enterprise Value (USD Mil) | Beta (5Y Monthly) | FCF Yield % (TTM) | Forward EPS | Analyst Target Price – Low | Analyst Target Price – Mean | Analyst Target Price – High | # Analyst Opinions |
|---|---|---|---|---|---|---|---|---|---|---|---|---|---|---|---|---|
| MPC | 478.1 | 16.6 | 8.5 | 1.1 | 10.9 | 0.9 | 7.1 | 139,566 | 167,421 | 0.54 | 6.6% | 55.9 | 236 | 442.3 | 560 | 18 |
| VLO | 444.7 | 18.5 | 9.4 | 1 | 10.1 | 1 | 5.1 | 128,044 | 134,786 | 0.59 | 6.6% | 47.4 | 238 | 406.6 | 496 | 19 |
| XOM | 179 | 23 | 15.1 | 2.1 | 11.4 | 2 | 2.8 | 735,950 | 774,461 | 0.21 | 2.8% | 11.9 | 142 | 175.6 | 200 | 22 |
| PSX | 293.2 | 16.8 | 9.8 | 0.9 | 13.6 | 0.8 | 3.7 | 116,981 | 134,644 | 0.70 | 3.9% | 30 | 173 | 280.5 | 345 | 19 |
| CVX | 225 | 21.7 | 14.8 | 2.3 | 9.4 | 2.1 | 2.3 | 441,341 | 475,561 | 0.52 | 5.0% | 15.2 | 175 | 227.9 | 253 | 24 |
| BP | 50.2 | 24.5 | 9.1 | 0.8 | 4.2 | 0.6 | 8.9 | 129,320 | 164,788 | -0.20 | 10.0% | 5.5 | 41 | 52.2 | 73 | 19 |
Source: Yahoo Finance
MPC trades at 10.9x EV/EBITDA and 1.1x EV/Revenue, versus VLO at 10.1x and 1.0x, PSX at 13.6x and 0.9x, CVX at 9.4x and 2.3x, XOM at 11.4x and 2.1x, and BP at 4.2x and 0.8x. Its 6.6% FCF yield is close to VLO’s 6.6% and above XOM’s 2.8%, while the $478.1 share price sits near the 52-week high of $485.2 and above the $442.3 analyst mean target. I think the market is paying for MPC’s stronger earnings base, but not at a deep discount.
Profitability
| Company | Operating Margin (TTM) | Net Margin (TTM) | Return on Assets (TTM) | Return on Equity (TTM) | Gross Margin (TTM) | EBITDA Margin (TTM) |
|---|---|---|---|---|---|---|
| MPC | 13.6% | 5.5% | 8.7% | 42.1% | 12.8% | 10.0% |
| VLO | 12.3% | 5.4% | 10.6% | 27.6% | 16.1% | 10.1% |
| XOM | 15.9% | 9.1% | 5.5% | 12.6% | 29.8% | 18.8% |
| PSX | 8.5% | 4.7% | 6.0% | 23.5% | 13.1% | 6.5% |
| CVX | 21.9% | 9.8% | 5.9% | 12.2% | 44.3% | 24.2% |
| BP | 13.1% | 2.5% | 5.0% | 8.9% | 28.3% | 18.2% |
Source: Yahoo Finance
MPC’s operating margin of 13.6% and EBITDA margin of 10.0% trail XOM’s 15.9% and 18.8%, but they exceed VLO’s 12.3% and 10.1%, PSX’s 8.5% and 6.5%, and BP’s 13.1% and 18.2% on operating and EBITDA measures. Gross margin at 12.8% is below VLO’s 16.1% and far below XOM’s 29.8%, which points to a cost-of-revenue advantage that is real but not dominant.
Leverage
| Company | Total Debt/Equity % (mrq) | Current Ratio (mrq) | Total Debt (mrq, USD Mil) | Operating Cash Flow TTM (USD Mil) | Free Cash Flow TTM (USD Mil) | Net Debt/EBITDA (TTM) | FCF Margin % (TTM) |
|---|---|---|---|---|---|---|---|
| MPC | 133.3 | 1.2 | 34,292 | 17,126 | 9,249.4 | 1.7 | 6.0% |
| VLO | 40.1 | 1.6 | 11,349 | 10,908 | 8,416.4 | 0.3 | 6.4% |
| XOM | 15.9 | 1.1 | 42,368 | 59,727 | 20,671 | 0.5 | 5.7% |
| PSX | 62.9 | 1.3 | 20,565 | 8,925 | 4,545.4 | 1.7 | 3.0% |
| CVX | 19 | 1.3 | 37,075 | 45,321 | 21,934 | 0.6 | 10.5% |
| BP | 95.1 | 1.3 | 72,693 | 29,106 | 12,878.9 | 0.9 | 6.0% |
Source: Yahoo Finance
MPC’s debt/equity ratio of 133.3% is higher than VLO’s 40.1%, XOM’s 15.9%, PSX’s 62.9%, CVX’s 19.0%, and BP’s 95.1%, but its net debt/EBITDA is only 1.7x, versus PSX at 1.7x, BP at 0.9x, CVX at 0.6x, XOM at 0.5x, and VLO at 0.3x. The gap says MPC is using leverage more aggressively than the integrated majors, yet the 6.0% FCF margin and $9.2B of TTM free cash flow show that the leverage is still serviceable.
Conclusion
I would put my rating as a Hold because the strongest part of the thesis is already visible in the numbers, while the main risk is that the current earnings run rate may not persist. Q2 2026 EBITDA of $8.2B and levered free cash flow of $9.2B show the business can still produce cash at scale, but the stock at $478.1 already sits near the 52-week high of $485.2 and above the $442.3 analyst mean target. That leaves me constructive on the business and cautious on the shares.
I would raise my rating more toward a Buy if MPC can keep EBITDA above $8B for another quarter and hold free cash flow near the current $9.2B TTM run rate, because that would confirm the Q2 2026 step-up was not just a temporary margin spike. If that cash generation persists, the company could keep buying back stock at the current pace and still reduce net debt/EBITDA from 1.7x, which would make the equity look more like a self-funded compounder than a cyclical refiner.
I would move from Hold to Sell if refining margins slip enough to pull EBITDA back toward the $3B to $3.6B quarterly range seen in late 2025, because that would cut annual cash generation sharply and make the current valuation harder to defend. A drop of that size would also pressure the 6.0% FCF margin and slow the pace of buybacks, which means the stock would lose the main support keeping it above a pure cycle multiple.
Weighing both paths, I think the bull case is more likely to show up first, but the market has already priced in a good part of it. That leaves me cautious on the shares because the next leg higher needs another quarter of earnings strength rather than just the hope of one.
What to Watch Next
- EBITDA above $8B again — would support moving the rating toward Buy.
- Levered free cash flow near $9.2B — would confirm the current cash run rate.
- Net debt/EBITDA below 1.7x — would show buybacks are not weakening the balance sheet.
- Refining margins back near the $3B–$3.6B EBITDA quarter range — would pressure the rating lower.
- FCF margin holding near 6.0% — would keep the valuation support intact.
What’s your take? I rated Marathon Petroleum (MPC) HOLD above — but the goal here is to get this right, not just to publish an opinion. What would you add to this analysis, or which risk or catalyst do you think I’m under- or over-weighting? Tell me in the comments.
Sources
- SEC 10-K Annual Report — filed 2026-02-26
- SEC 8-K Filing (2026-05-05)
- SEC 8-K Filing (2026-05-01)
- SEC 8-K Filing (2026-04-13)
- SEC 8-K Filing (2026-02-03)
- SEC Form 4 Insider Transaction (2026-06-08)
- SEC Form 4 Insider Transaction (2026-05-15)
- SEC Form 4 Insider Transaction (2026-05-04)
- SEC 10-K Annual Report — FY2026
- SEC 10-K Annual Report — FY2025
- SEC 10-K Annual Report — FY2024
- SEC 10-K Annual Report — FY2023
- SEC 10-K Annual Report — FY2022
Data sourced from Yahoo Finance and SEC EDGAR. Not investment advice.
Leave a Comment