
| Company | Oct 25 | Nov 25 | Dec 25 | Jan 26 | Feb 26 | Mar 26 | Apr 26 | May 26 | Jun 26 | Jul 26 | Aug 26 | Sep 26 | 12-Mo |
|---|---|---|---|---|---|---|---|---|---|---|---|---|---|
| SBLK | +1% | +6% | -3% | +19% | +15% | -11% | +9% | +8% | -7% | +15% | +11% | -5% | +69% |
| CMRE | +3% | +25% | +3% | +6% | +5% | -4% | -1% | -7% | -9% | +12% | -2% | -4% | +25% |
| DAC | +1% | +7% | -4% | +10% | +15% | -5% | +7% | +5% | -2% | +17% | +7% | +2% | +76% |
| ZIM | +14% | +33% | +4% | +4% | +31% | -6% | +0% | -11% | +11% | -3% | +9% | +7% | +124% |
| NMM | +9% | +11% | -4% | +14% | +21% | -6% | +7% | -4% | +1% | +15% | +9% | +2% | +100% |
| MATX | +2% | +8% | +13% | +30% | +4% | -1% | +6% | +4% | +6% | +5% | +11% | -2% | +125% |
Source: Yahoo Finance monthly adjusted close.
Quick Thesis
- Rated Hold — Star Bulk already prices in a freight recovery that still needs to prove durable.
- Strongest point: 97% scrubber coverage and 1.4x net debt/EBITDA support the equity.
- Biggest risk: spot-rate volatility can quickly reverse cash generation.
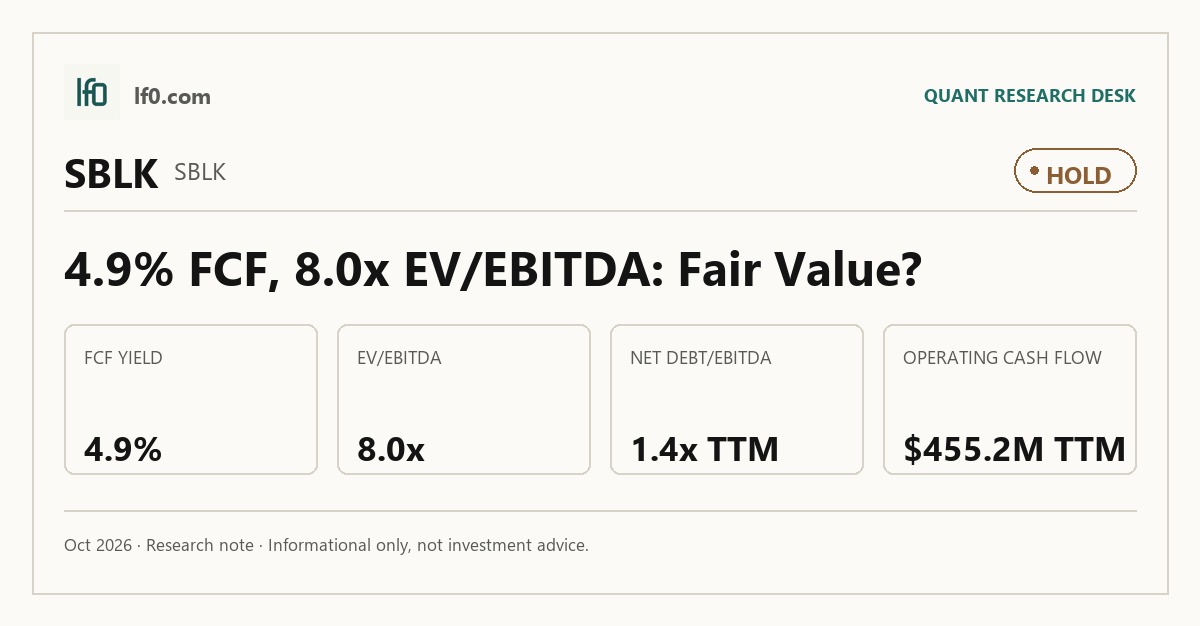
- Valuation is fair, not cheap: 8.0x EV/EBITDA and 4.9% FCF yield.
- I would move more constructive if quarterly EBITDA stays above $180M.
Executive Summary
Rating: HOLD | SBLK
We’ll begin tracking this call’s performance since publication once sufficient adjusted-close data is available.
I would put my rating as a Hold because Star Bulk’s earnings power is real, but the stock already discounts a good part of the recovery in freight and cash flow. The latest quarter showed $357.4M of revenue and $195.9M of EBITDA, which confirms operating leverage, yet the business still depends on spot charter rates that can turn quickly. In my view, the key question is not whether the fleet can earn money today; it is whether that earnings level can hold long enough to justify a higher multiple. I would raise my rating more toward a Buy if quarterly EBITDA stays above $180M for two more quarters, because that would show the current run rate is durable rather than a one-quarter spike.
Company Profile
Star Bulk Carriers Corp. owns and operates a dry bulk fleet that carries iron ore, grain, bauxite, fertilizers, steel products, and other bulk commodities on worldwide routes. The company was incorporated in the Marshall Islands in 2006 and began operations in 2007 with its first vessel. As of February 25, 2026, the fleet totaled 141 vessels and 14.0 million deadweight tons, with eight newbuild Kamsarmax vessels due in 2026 and a pending 16-vessel Diana acquisition that would lift the fleet to 157 ships and 15.9 million deadweight tons if completed. Star Bulk is listed on Nasdaq under SBLK and finances the fleet with a mix of debt and equity.
Economic Moat
Business Model
The scrubber-fitted, in-house managed fleet is the clearest structural advantage here. A competitor would need both capital and time to match the 136 of 141 vessels, or 97%, fitted with exhaust gas cleaning systems as of February 25, 2026, while also building the operating discipline to run a large dry bulk fleet at scale. I feel that this is hard to replicate quickly because the benefit is not just hardware; it also comes from Star Bulk Management Inc., Star Bulk (Hellas) Inc., Starbulk S.A., Eagle Ship Management (Hellas) LLC, and Eagle Ship Management LLC controlling chartering, technical work, crewing, maintenance, and compliance in-house. The company also has 61 vessels with energy-saving devices installed and 13 more planned for 2026, plus 90% onboard telemetry coverage as of December 31, 2025, which supports fuel efficiency and charterer appeal.
Business & Operating Risks
The most material disclosed risk is charter-rate volatility because the company earns principally in the spot market, and the filing is explicit that future spot rates may not be sufficient to operate the vessels profitably. That risk is already visible in the numbers: 2025 charter rates fell from 2024 levels, even though the Baltic Dry Index still averaged 17.4% above the decade average, so a softer rate backdrop can hit earnings before the cycle turns weak. Geopolitical disruption is the next issue because it has already moved from disclosure to operating reality, with the Star Gwyneth struck near the Strait of Hormuz in March 2026 and earlier war-related disruptions in the Black Sea and Red Sea. The disclosed risks do not directly undermine the scrubber-and-scale moat; they mainly test how much cash flow that moat can generate through a volatile freight cycle.
Management Discussion & Analysis
Management is signaling a capital-allocation reset rather than an expansion push, and that is the right response to the rate and geopolitical risks above. Cash and cash equivalents were $488.5M at December 31, 2025, while long-term bank loans and lease financing fell to $843.4M from $1B a year earlier, so the balance sheet is being de-risked even as the fleet stays capital intensive. The company also entered five new senior secured credit facilities in 2025 and a $130M ESUN Facility for post-delivery financing of five Kamsarmax vessels under construction, which keeps liquidity intact but does not eliminate leverage risk. Dividends declared fell to $0.30 in 2025 from $2.50 in 2024, while share repurchases rose to $98.1M from $25.3M, so capital returns are now more selective and tied to market conditions.
Recent Events
The April 9, 2024 Eagle merger was the most important recent corporate event because it expanded the fleet and deepened the operating platform. The transaction added 52 dry bulk Supramax and Ultramax vessels, and the August 1, 2024 conversion of Eagle’s 5.00% Convertible Senior Notes into 5,971,284 shares of Star Bulk common stock simplified the capital structure. More recently, the company agreed in March 2026 to buy 16 vessels from Diana Shipping Inc., which would further scale the fleet if completed. I see that as a positive for the moat only if the added tonnage comes without a disproportionate increase in leverage or execution risk.
Financial Analysis
Growth
SBLK — Financial Growth (Quarterly, USD Mil)
| Metric | 2025-03-31 | 2025-06-30 | 2025-09-30 | 2025-12-31 | 2026-03-31 | 2026-06-30 |
|---|---|---|---|---|---|---|
| REVENUE (USD Mil) | — | 247.4 | 263.9 | 300.6 | 281.2 | 357.4 |
| EBIT (USD Mil) | — | 18.9 | 36.3 | 81.3 | 70.6 | 156.1 |
| EBITDA (USD Mil) | — | 61.5 | 78.1 | 122.2 | 110.2 | 195.9 |
| NET INCOME (USD Mil) | — | 0 | 18.5 | 65.2 | 58.5 | 144.9 |
| DILUTED EPS | 0 | 0 | 0.2 | — | 0.5 | 1.3 |
Source: Yahoo Finance — Quarterly Financial Statements
Revenue accelerated from $247.4M in Q2 2025 to $357.4M in Q2 2026, a 44.5% year-over-year increase, after $263.9M in Q3 2025 and $300.6M in Q4 2025. EBITDA rose from $61.5M to $195.9M over the same period, while net income climbed from $0.039M in Q2 2025 to $144.9M in Q2 2026. The step-up from $281.2M in Q1 2026 to $357.4M in Q2 2026 looks like a spot-rate upswing in dry bulk shipping, which fits the charter-mix flexibility described above. Growth is a bull signal because earnings are outpacing revenue and the latest quarter shows clear operating leverage.
Profitability
SBLK — Profitability (TTM)
| Metric | TTM |
|---|---|
| Operating Margin (TTM) | 39.7% |
| Net Margin (TTM) | 23.9% |
| Return on Assets (TTM) | 5.4% |
| Return on Equity (TTM) | 11.7% |
| Gross Margin (TTM) | 47.3% |
| EBITDA Margin (TTM) | 41.4% |
Source: Yahoo Finance — Trailing Twelve Months (TTM)
TTM gross margin of 47.3%, EBITDA margin of 41.4%, operating margin of 39.7%, and net margin of 23.9% show a business that is already profitable at the operating level and converting a large share of revenue into cash earnings. The 7.6-point gap between gross and operating margin points to meaningful vessel operating, crewing, and administrative costs, but not a broken cost structure; it is the normal burden of running a capital-intensive shipping fleet. EBITDA margin sitting 1.7 points above operating margin means depreciation and amortisation are real, but not overwhelming relative to the earnings base. TTM ROA of 5.4% and ROE of 11.7% indicate solid returns, with the ROE roughly double ROA, so leverage is amplifying returns rather than creating them from weak operations. That margin profile is consistent with the operating-control advantage described in the moat section, and it is the main reason the equity can support a premium to book value.
Valuation
SBLK — Valuation Multiples
| Metric | Value |
|---|---|
| Current Share Price (USD) | 29.7 |
| Market Cap (USD Mil) | 3,446 |
| Enterprise Value (USD Mil) | 3,995 |
| Trailing P/E | 11.6 |
| Forward P/E | 8.4 |
| Price/Sales (TTM) | 2.9 |
| Price/Book (mrq) | 1.3 |
| EV/Revenue | 3.3 |
| EV/EBITDA | 8 |
| Beta (5Y Monthly) | 0.76 |
| FCF Yield % (TTM) | 4.9% |
| Forward EPS (USD) | 3.5 |
| Analyst Target Price – Low (USD) | 33 |
| Analyst Target Price – Mean (USD) | 34.4 |
| Analyst Target Price – High (USD) | 38 |
| # Analyst Opinions | 5 |
Source: Yahoo Finance
Star Bulk trades at 3.3x EV/Revenue and 8.0x EV/EBITDA, with a trailing P/E of 11.6x and a forward P/E of 8.4x. The market is pricing in a business that can keep converting a 47.3% gross margin and 41.4% EBITDA margin into 3.52 of forward EPS, which is why the stock at 29.69 is not being valued like a distressed cyclical. Price to book is 1.3x, so the market is assigning value to the fleet and earnings power above liquidation value, but the 4.9% FCF yield keeps me from calling it cheap on cash flow alone. Analyst coverage is real at five opinions, and the $33 to $38 target range sits above the current price; my own fair-value range is roughly $28 to $34, which sits slightly below the $34.4 mean because I weight spot-rate cyclicality and leverage more heavily than the consensus appears to. On the EPS side, the latest run rate supports roughly $3.3 to $3.8 of annualized earnings, which is close to the 3.52 forward EPS estimate and implies the stock is not obviously cheap relative to peers on a like-for-like earnings basis. Overall, valuation reads as fair rather than discounted.
Leverage
SBLK — Leverage & Coverage (Quarterly)
| Metric | Value |
|---|---|
| Total Debt/Equity % (mrq) | 46.9 |
| Current Ratio (mrq) | 1.9 |
| Total Debt (mrq, USD Mil) | 1,179 |
| Operating Cash Flow (TTM, USD Mil) | 455.2 |
| Levered Free Cash Flow (TTM, USD Mil) | 169.8 |
| Net Debt/EBITDA (TTM) | 1.4 |
| FCF Margin % (TTM) | 14.1% |
Source: Yahoo Finance — Quarterly Financial Statements
Total debt was $1.2B in mrq, with Total Debt/Equity of 46.9% and a current ratio of 1.9x. Operating cash flow was $455.2M TTM, levered free cash flow was $169.8M TTM, net debt/EBITDA was 1.4x, and FCF margin was 14.1%. Total cash was $499.6M mrq, so the balance sheet has enough liquidity to absorb a weaker freight market without immediate funding stress. EBITDA is converting into cash reasonably well, but the spread between $455.2M of operating cash flow and $169.8M of levered free cash flow shows that capex and other cash uses still take a meaningful bite out of earnings quality. In my view, this is manageable leverage rather than balance-sheet strain, which is why the stock can work if freight stays constructive.
Insider Activity
The insider transaction record is one-sided: 11 open-market sales and 0 open-market purchases in the 2026-03-31 to 2026-06-01 window. The activity is concentrated, with Nikolaos Reskos accounting for most of the selling, while Charis Plakantonaki and Raffaele Zagari add smaller sales. I read that as a mild negative because there is no offsetting purchase activity to signal conviction at current prices.
Comparable Analysis
LF0 has published standalone analyses of these peers: Danaos (DAC) (rated Hold).
Growth
| Company | Revenue TTM (USD Mil) | Revenue Growth YoY % | EBITDA TTM (USD Mil) | Diluted EPS TTM |
|---|---|---|---|---|
| SBLK | 1,203 | 44.5% | 497.8 | 2.5 |
| CMRE | 857.4 | -4.0% | 546.4 | 2.6 |
| DAC | 1,055.1 | 4.7% | 675 | 29.6 |
| ZIM | 6,439.1 | 8.9% | 466.8 | 1.1 |
| NMM | 1,479.7 | 25.2% | 835.9 | 15.3 |
| MATX | 3,459.2 | 16.7% | 674.6 | 14.9 |
Source: Yahoo Finance
Revenue growth of 44.5% TTM is well above CMRE at -4.0% and DAC at 4.7%, and it also exceeds ZIM at 8.9%, NMM at 25.2%, and MATX at 16.7%. SBLK’s growth is the strongest in the group on a pure top-line basis, so the premium is justified only if investors believe the pace is repeatable rather than a cycle peak.
Valuation
| Company | Current Share Price (USD) | Trailing P/E | Forward P/E | EV/Revenue | EV/EBITDA | Price/Sales (TTM) | Price/Book (mrq) | Market Cap (USD Mil) | Enterprise Value (USD Mil) | Beta (5Y Monthly) | FCF Yield % (TTM) | Forward EPS | Analyst Target Price – Low | Analyst Target Price – Mean | Analyst Target Price – High | # Analyst Opinions |
|---|---|---|---|---|---|---|---|---|---|---|---|---|---|---|---|---|
| SBLK | 29.7 | 11.6 | 8.4 | 3.3 | 8 | 2.9 | 1.3 | 3,446 | 3,995 | 0.76 | 4.9% | 3.5 | 33 | 34.4 | 38 | 5 |
| CMRE | 15 | 5.7 | 5.4 | 3.5 | 5.4 | 2.1 | 0.8 | 1,818 | 2,963 | 0.97 | -12.8% | 2.8 | 19 | 20 | 21 | 2 |
| DAC | 164.5 | 5.6 | 6.7 | 2.8 | 4.4 | 2.8 | 0.7 | 2,994 | 2,973 | 0.86 | 0.1% | 24.5 | 155 | 164.5 | 174 | 2 |
| ZIM | 30 | 26.1 | 4.5 | 1.1 | 15.6 | 0.6 | 0.9 | 3,614 | 7,292 | 1.16 | 27.4% | 6.7 | 16.5 | 27.8 | 36 | 4 |
| NMM | 90.8 | 5.9 | 4.8 | 3.1 | 5.5 | 1.8 | 0.7 | 2,626 | 4,622 | 1.05 | -6.2% | 18.8 | 96 | 103 | 111 | 4 |
| MATX | 222.9 | 15 | 13.3 | 2.1 | 10.8 | 1.9 | 2.4 | 6,666 | 7,263 | 1.30 | 2.2% | 16.8 | 255 | 263.8 | 270 | 4 |
Source: Yahoo Finance
SBLK’s FCF yield is 4.9% TTM, above CMRE at -12.8% and NMM at -6.2%, but below ZIM at 27.4%, DAC at 0.1%, and MATX at 2.2%, which says it is not the cheapest shipper on cash generation even though it is one of the few with positive free cash flow. On EV/Revenue, SBLK at 3.3x sits above DAC at 2.8x, ZIM at 1.1x, and MATX at 2.1x, but near CMRE at 3.5x and NMM at 3.1x; that looks fair rather than cheap given SBLK’s 8.4x forward P/E versus CMRE at 5.4x and DAC at 6.7x. Using the peer EV/Revenue range of 1.1x to 3.5x on SBLK’s $1.2B TTM revenue gives an implied enterprise value of about $1.4B to $4.2B, or roughly $7.0 to $31.3 per share after netting $1.2B debt and $0.5B cash against 116.1M shares, which brackets the current 29.69 price. That range is consistent with a market that is paying for the earnings rebound, not for a deep discount.
Profitability
| Company | Operating Margin (TTM) | Net Margin (TTM) | Return on Assets (TTM) | Return on Equity (TTM) | Gross Margin (TTM) | EBITDA Margin (TTM) |
|---|---|---|---|---|---|---|
| SBLK | 39.7% | 23.9% | 5.4% | 11.7% | 47.3% | 41.4% |
| CMRE | 47.0% | 39.5% | 6.7% | 16.0% | 69.8% | 63.7% |
| DAC | 48.4% | 51.3% | 6.4% | 14.1% | 70.8% | 64.0% |
| ZIM | 8.4% | 2.2% | 2.1% | 3.6% | 31.0% | 7.2% |
| NMM | 38.8% | 30.3% | 5.1% | 13.2% | 90.3% | 56.5% |
| MATX | 16.1% | 13.4% | 6.9% | 17.2% | 23.0% | 19.5% |
Source: Yahoo Finance
SBLK’s operating margin of 39.7%, net margin of 23.9%, gross margin of 47.3%, and EBITDA margin of 41.4% trail CMRE’s 47.0%, 39.5%, 69.8%, and 63.7%, and DAC’s 48.4%, 51.3%, 70.8%, and 64.0%, but they are far ahead of ZIM’s 8.4%, 2.2%, 31.0%, and 7.2% and MATX’s 16.1%, 13.4%, 23.0%, and 19.5%. The gap looks structural rather than temporary: SBLK’s margins are strong for a dry-bulk operator, but the peer set shows that container and diversified shipping names with better rate environments and asset mix can still post materially higher margins.
Leverage
| Company | Total Debt/Equity % (mrq) | Current Ratio (mrq) | Total Debt (mrq, USD Mil) | Operating Cash Flow TTM (USD Mil) | Free Cash Flow TTM (USD Mil) | Net Debt/EBITDA (TTM) | FCF Margin % (TTM) |
|---|---|---|---|---|---|---|---|
| SBLK | 46.9 | 1.9 | 1,179 | 455.2 | 169.8 | 1.4 | 14.1% |
| CMRE | 65.6 | 1.6 | 1,504.4 | 467.9 | -232.1 | 2 | -27.1% |
| DAC | 29.8 | 9.3 | 1,210.7 | 715.6 | 4.5 | 0 | 0.4% |
| ZIM | 136.8 | 1.2 | 5,312.6 | 1,660.8 | 991.5 | 7.9 | 15.4% |
| NMM | 68.6 | 1.5 | 2,465.2 | 540.1 | -161.7 | 2.4 | -10.9% |
| MATX | 25.8 | 0.9 | 716.4 | 584.1 | 147.1 | 0.9 | 4.2% |
Source: Yahoo Finance
Debt/equity of 46.9% and net debt/EBITDA of 1.4x are better than CMRE at 65.6% and 2.0x, and far better than ZIM at 136.8% and 7.9x, but worse than DAC at 29.8% and 0.0x and MATX at 25.8% and 0.9x. SBLK’s 14.1% FCF margin is solid, yet DAC’s near-zero net debt and MATX’s lower leverage show that the market can own shipping exposure with less balance-sheet risk, which caps how much of a valuation premium SBLK should command.
Conclusion
I would put my rating as a Hold because Star Bulk already reflects a lot of the freight recovery in its 8.4x forward P/E and 4.9% free cash flow yield, while the business still depends on spot charter rates that can swing quickly. The fleet’s 97% scrubber coverage and 1.4x net debt to EBITDA support the equity, but they do not remove the fact that earnings are still tied to a volatile rate cycle.
The most credible bull case is that charter rates stay firm enough for EBITDA to hold near the recent run rate, with the 2026 vessel additions and the Diana acquisition lifting scale without a matching jump in leverage. If EBITDA stays around the current annualized pace implied by the latest quarter, roughly $780M, then net debt to EBITDA would remain near 1.4x even after the newbuild deliveries, and that would leave room for buybacks and dividends to keep supporting per-share value. I would raise my rating more toward a Buy if the company can show two more quarters of EBITDA above $180M, because that would confirm the latest freight strength is not just a one-quarter spike.
The most credible bear case is that spot rates roll over and the company’s cash generation falls faster than the balance sheet can absorb. If EBITDA slips back toward the $110M to $120M quarterly range seen in early 2026, annualized EBITDA would fall by roughly $260M versus the latest quarter run rate, which would quickly push leverage higher and narrow dividend flexibility. I would move from Hold to Sell if net debt to EBITDA moved above 2.0x, because that would mean the fleet is no longer carrying a comfortable cushion through the cycle and the equity would be leaning too hard on a rate rebound.
Weighing both sides, I think the bear case is more likely to show up first because shipping rates usually turn before the market fully prices it in. The stock can work if freight stays constructive, but the current valuation already gives Star Bulk credit for that outcome, so I do not see enough margin of safety to be more aggressive than Hold.
What to Watch Next
- Quarterly EBITDA above $180M — would support raising the rating toward Buy.
- Net debt/EBITDA above 2.0x — would argue the balance sheet cushion is thinning.
- Spot charter rates holding near the latest run rate — would support the earnings base.
- Diana acquisition closing without a leverage jump — would strengthen the moat and scale case.
- FCF yield staying near 5% or better — would confirm the stock is not becoming expensive on cash generation.
What’s your take? I rated Star Bulk Carriers (SBLK) HOLD above — but the goal here is to get this right, not just to publish an opinion. What would you add to this analysis, or which risk or catalyst do you think I’m under- or over-weighting? Tell me in the comments.
Sources
- SEC Form 4 Insider Transaction (2026-06-03)
- SEC Form 4 Insider Transaction (2026-05-22)
- SEC Form 4 Insider Transaction (2026-05-20)
Data sourced from Yahoo Finance and SEC EDGAR. Not investment advice.
Leave a Comment