
Executive Summary
Rating: HOLD | EZPW
Measured from adjusted close on 2026-07-13 to 2026-10-09. Sell ratings are correct when the stock falls; Hold is tracked as a +/-10% range. Daily-close data, not intraday. Calls are tracked for 182 days from publication, then frozen as a final record.
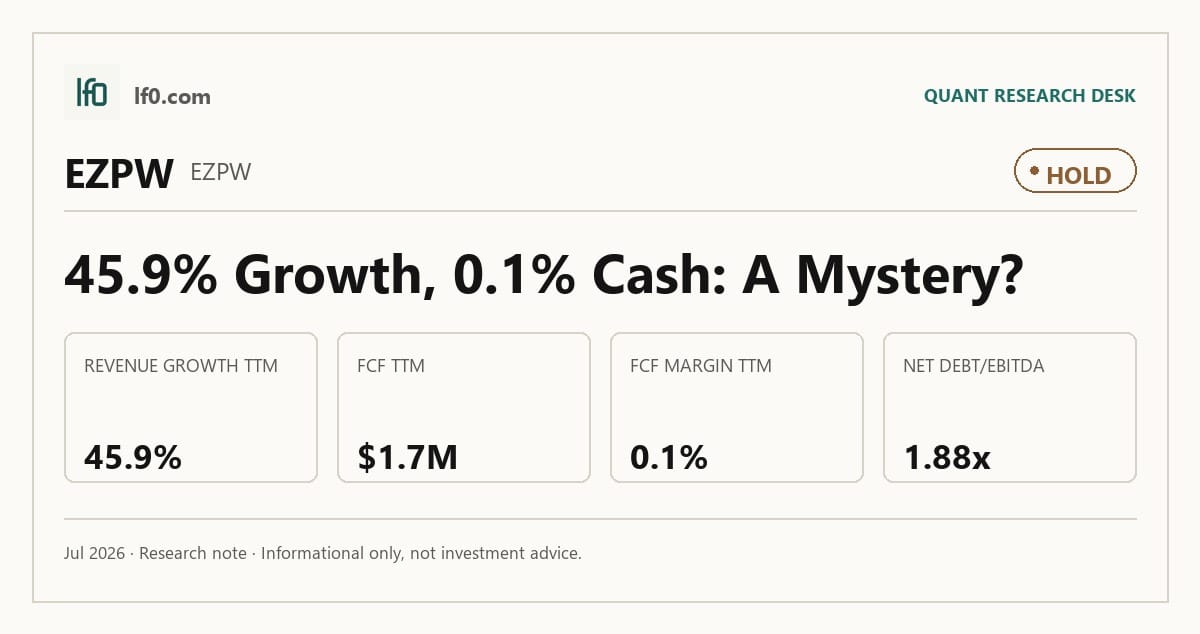
I would put my rating as a Hold because EZCORP is growing fast enough to justify a premium, but the stock already discounts much of that improvement while free cash flow remains almost nonexistent at $1.7M TTM. Revenue grew $446.9M year over year in Q1 2026 to $446.9M, and EBITDA rose to $83.4M, so the operating trend is real; the issue is that cash conversion has not yet caught up. In my view, the key tension is whether that earnings growth can turn into durable cash before the 2025 convertible maturity forces a more expensive refinancing. I would raise my rating more towards a Buy if free cash flow margin moves above 5.0%, meaning the business is finally funding growth and debt service with real surplus cash.
Company Profile
EZCORP, Inc. is a Delaware corporation headquartered in Austin, Texas, and listed on Nasdaq under EZPW. It operates a pawn and consumer lending platform across the U.S. and Latin America, earning revenue mainly from pawn service charges on outstanding loans, merchandise sales of forfeited or purchased pre-owned goods, and jewelry scrapping. At September 30, 2024, the company operated 1,279 locations, and it also owns 43.7% of Cash Converters International Limited and holds a preferred interest in Founders 1, LLC, which controls Simple Management Group and 102 pawn stores. EZCORP’s equity is non-voting Class A common stock, which matters because the operating story is being built on store growth and collateral turnover rather than on shareholder control.
Economic Moat
Business Model
The hardest part of EZCORP’s model to copy quickly is the store network itself. The company’s 1,279 locations at September 30, 2024, plus more than 8,000 team members and 5.4 million EZ+ Rewards members, create local density that a new entrant would need years to replicate through site selection, licensing, hiring, and customer trust. I think that physical footprint is the core advantage because pawn remains a neighborhood business, and the digital EZ+ tools for pawn transactions, layaways, and loyalty rewards add convenience without replacing the branch network. That store density also helps explain why the company can keep scaling revenue and EBITDA together: the moat is operational, not just promotional.
Business & Operating Risks
The biggest disclosed risk is regulatory change, because EZCORP’s model depends on laws that can force store closures, product changes, or direct operating limits. According to the risk factors in its SEC 10-K, adverse legislation could lead the company to close or consolidate stores, and non-compliance could bring fines, penalties, or suspension of operations. That risk is most acute in Texas and Florida, where more than 63.0% of U.S. pawn stores were located at September 30, 2024, so a rule change in either state would hit a large share of the base. Gold price sensitivity, crime, firearms exposure, and cyber risk are also material, but they do not appear to threaten the store-network advantage itself; they threaten earnings volatility and compliance costs around it.
Management Discussion & Analysis
Management is still leaning into growth rather than balance-sheet repair, and that is the right read on the filing. The company expects cash flows from operations and cash on hand to fund operations, debt service, repurchases, strategic investments, and planned de novo growth through fiscal 2025, while also acknowledging that the May 2025 convertible maturity may require refinancing through new debt, equity, convertible securities, or a new credit facility. I read that as disciplined but not conservative: management is comfortable using internal liquidity to keep expanding, yet the refinancing overhang is still live. The $50M repurchase authorization, of which $26M had been used for 2,845,548 shares by September 30, 2024, reinforces that capital is being returned even as the company modernizes systems and spends on growth. The Presta Dinero acquisition agreement in Mexico fits the same pattern, and it shows management is still willing to add stores before the capital structure is fully de-risked.
Recent Events
The most important recent event is the September 11, 2024 agreement to buy 53 pawn stores in Mexico from Presta Dinero, S.A. de C.V. That deal extends the Latin America footprint and supports the same cross-border scale advantage described above, so I view it as moat-positive if integration is disciplined. The other 8-Ks are mostly routine earnings releases and board re-election items, which tells me the strategic picture has not changed much outside the Mexico transaction. In my view, the event flow is constructive but not transformative: it adds scale, yet it does not solve the refinancing question or materially change the operating model.
Financial Analysis
Growth
EZPW — Financial Growth (Quarterly, USD Mil)
| Metric | 2025-03-31 | 2025-06-30 | 2025-09-30 | 2025-12-31 | 2026-03-31 |
|---|---|---|---|---|---|
| REVENUE (USD Mil) | 306.3 | 311 | 336.8 | 382 | 446.9 |
| EBIT (USD Mil) | 37.7 | 43.2 | 44.4 | 67.3 | 73.8 |
| EBITDA (USD Mil) | 45.7 | 51.2 | 52.6 | 76.1 | 83.4 |
| NET INCOME (USD Mil) | 25.4 | 26.5 | 26.7 | 44.3 | 49.1 |
| DILUTED EPS | 0.3 | 0.3 | 0.3 | 0.6 | 0.6 |
Source: Yahoo Finance — Quarterly Financial Statements
Revenue accelerated across the last five quarters, rising from $306.3M in Q1 2025 to $446.9M in Q1 2026, a 45.9% increase that shows EZPW is still expanding rather than merely cycling. EBITDA rose from $45.7M to $83.4M over the same span, which is faster than revenue and tells me operating leverage is improving as the base scales. That matters for the moat because the store network only becomes more valuable if incremental volume can be absorbed without a matching jump in overhead. The latest quarter also showed the strongest step-up in the series, which makes the growth trend look more durable than a one-quarter spike.
Profitability
EZPW — Profitability (TTM)
| Metric | TTM |
|---|---|
| Operating Margin (TTM) | 15.2% |
| Net Margin (TTM) | 9.9% |
| Return on Assets (TTM) | 6.4% |
| Return on Equity (TTM) | 14.8% |
| Gross Margin (TTM) | 58.6% |
| EBITDA Margin (TTM) | 16.1% |
Source: Yahoo Finance — Trailing Twelve Months (TTM)
TTM gross margin was 58.6%, EBITDA margin was 16.1%, operating margin was 15.2%, and net margin was 9.9%. The 43.4-point spread between gross and operating margin shows EZCORP keeps most of its revenue after direct costs, but the store and corporate expense base still absorbs a meaningful share of gross profit. TTM ROA was 6.4% and ROE was 14.8%, so equity returns are being helped by leverage rather than by exceptional asset productivity. I would watch for operating margin moving above 15.2% and net margin closing toward it, because that would show more of each dollar of gross profit is reaching shareholders.
Valuation
EZPW — Valuation Multiples
| Metric | Value |
|---|---|
| Market Cap (USD Mil) | 2,097 |
| Enterprise Value (USD Mil) | 2,565 |
| Trailing P/E | 18.4 |
| Forward P/E | 15.9 |
| Price/Sales (TTM) | 1.4 |
| Price/Book (mrq) | 1.9 |
| EV/Revenue | 1.7 |
| EV/EBITDA | 10.8 |
| Beta (5Y Monthly) | 0.64 |
| FCF Yield % (TTM) | 0.1% |
| Forward EPS (USD) | 2.1 |
| Analyst Target Price – Low (USD) | 35 |
| Analyst Target Price – Mean (USD) | 40.6 |
| Analyst Target Price – High (USD) | 45 |
| # Analyst Opinions | 5 |
Source: Yahoo Finance
EZCORP trades at 1.7x EV/revenue and 10.8x EV/EBITDA, with a trailing P/E of 18.4x and a forward P/E of 15.9x. On my read, that is not a distressed multiple for a business with 45.9% revenue growth and 16.1% EBITDA margin, but it is also not a full growth-stock valuation. I would put fair value in a range of roughly $35-$45 per share, which is close to the analyst target range of $35 low, $40.6 mean, and $45 high across 5 opinions. That sits slightly above the current implied price and tells me the market is already giving credit for the growth step-up, but not for a major re-rating. Forward EPS is $2.14, so the stock is being priced on the assumption that earnings keep compounding; if cash conversion stays weak, that assumption becomes harder to defend.
Leverage
EZPW — Leverage & Coverage (Quarterly)
| Metric | Value |
|---|---|
| Total Debt/Equity % (mrq) | 70.1 |
| Current Ratio (mrq) | 4.7 |
| Total Debt (mrq, USD Mil) | 800.2 |
| Operating Cash Flow (TTM, USD Mil) | 173.7 |
| Levered Free Cash Flow (TTM, USD Mil) | 1.7 |
| Net Debt/EBITDA (TTM) | 1.9 |
| FCF Margin % (TTM) | 0.1% |
Source: Yahoo Finance — Quarterly Financial Statements
EZCORP’s leverage is manageable, not stretched. Total debt/equity was 70.1% mrq, current ratio was 4.7x mrq, and total debt was $800.2M mrq, while cash was $354.2M mrq, so the near-term liquidity buffer is solid. Net debt/EBITDA was 1.9x TTM, which is moderate, but levered free cash flow was only $1.7M TTM and FCF margin was 0.1% TTM, so EBITDA is converting to cash very weakly after capex, interest, and working capital needs. That is the key cross-check against the valuation: the stock can look reasonable on earnings multiples, yet the cash profile leaves little room for execution error or a more expensive refinancing.
Insider Activity
The insider record is one-sided, with 8 open-market sales and no open-market purchases across the 2025-03-13 to 2026-06-05 window. Multiple directors sold shares, and that weakens the alignment signal because insiders are reducing exposure while outside shareholders remain fully exposed. I would not overread any single sale, but the pattern is not what I want to see when free cash flow is still thin and refinancing risk is still in the background.
Comparable Analysis
Growth
| Company | Revenue TTM (USD Mil) | Revenue Growth YoY % | EBITDA TTM (USD Mil) | Diluted EPS TTM |
|---|---|---|---|---|
| EZPW | 1,476.7 | 45.9% | 237.6 | 1.9 |
| FCFS | 3,876.3 | 25.7% | 731.1 | 8 |
| OPFI | 340 | -2.2% | — | 2 |
| OPRT | 727.5 | 1.3% | — | 0.4 |
| WRLD | 584.8 | 7.3% | 103.3 | 6.9 |
| PRG | 2,483.5 | 11.1% | 412.9 | 3.9 |
Source: Yahoo Finance
EZPW’s revenue grew 45.9% TTM to $1.5B, which is faster than FCFS at 25.7%, WRLD at 7.3%, PRG at 11.1%, OPRT at 1.3%, and OPFI at -2.2%. EBITDA TTM was $237.6M, versus $731.1M at FCFS and $412.9M at PRG, so EZPW is smaller but growing faster than the more mature names. I think that growth premium is justified only if the company keeps converting scale into cash, because the leverage profile does not leave much room for a growth miss.
Valuation
| Company | Trailing P/E | Forward P/E | EV/Revenue | EV/EBITDA | Price/Sales (TTM) | Price/Book (mrq) | Market Cap (USD Mil) | Enterprise Value (USD Mil) | Beta (5Y Monthly) | FCF Yield % (TTM) | Forward EPS | Analyst Target Price – Low | Analyst Target Price – Mean | Analyst Target Price – High | # Analyst Opinions |
|---|---|---|---|---|---|---|---|---|---|---|---|---|---|---|---|
| EZPW | 18.4 | 15.9 | 1.7 | 10.8 | 1.4 | 1.9 | 2,097 | 2,564 | 0.64 | 0.1% | 2.1 | 35 | 40.6 | 45 | 5 |
| FCFS | 27.4 | 17.5 | 3.1 | 16.5 | 2.5 | 4.2 | 9,583 | 12,063 | 0.53 | 2.0% | 12.5 | 220 | 240.5 | 252 | 4 |
| OPFI | 4.7 | 4.3 | 3.8 | — | 4 | 3.3 | 1,360 | 1,305 | 1.77 | — | 2.2 | 11 | 14 | 16 | 3 |
| OPRT | 15.4 | 3.2 | 3.9 | — | 0.4 | 0.7 | 276 | 2,862 | 1.23 | — | 1.9 | 6 | 8.5 | 11 | 5 |
| WRLD | 29 | 14.1 | 2.6 | 15 | 1.6 | 2.7 | 927 | 1,548 | 1.14 | 1.6% | 14.1 | 141 | 141 | 141 | 1 |
| PRG | 11.3 | 8.3 | 1.1 | 6.4 | 0.7 | 2.3 | 1,772 | 2,639 | 1.78 | 84.0% | 5.3 | 45 | 50.4 | 60 | 7 |
Source: Yahoo Finance
EZPW trades at 1.7x EV/revenue, 18.4x trailing P/E, 15.9x forward P/E, and 1.4x price/sales, versus FCFS at 3.1x, 27.4x, 17.5x, and 2.5x; WRLD at 2.6x, 29.0x, 14.1x, and 1.6x; PRG at 1.1x, 11.3x, 8.3x, and 0.7x; OPRT at 3.9x, 15.4x, 3.2x, and 0.4x; and OPFI at 3.8x, 4.7x, 4.3x, and 4.0x. On FCF yield, EZPW’s 0.1% is far below FCFS at 2.0%, WRLD at 1.6%, and PRG at 84.0%, which tells me the stock is not cheap on cash generation even if the headline multiples look mid-pack. A $1 investment one year ago would be worth $2.47 in EZPW, versus $1.66 in FCFS, $0.71 in OPFI, $0.86 in OPRT, $1.14 in WRLD, and $1.47 in PRG, so the market has already rewarded EZPW for the growth and earnings step-up. That outperformance is harder to justify if FCF stays near zero.
Profitability
| Company | Operating Margin (TTM) | Net Margin (TTM) | Return on Assets (TTM) | Return on Equity (TTM) | Gross Margin (TTM) | EBITDA Margin (TTM) |
|---|---|---|---|---|---|---|
| EZPW | 15.2% | 9.9% | 6.4% | 14.8% | 58.6% | 16.1% |
| FCFS | 16.7% | 9.1% | 7.8% | 16.3% | 58.6% | 18.9% |
| OPFI | 44.9% | 19.4% | 26.5% | 62.1% | 100.0% | — |
| OPRT | 2.5% | 2.5% | 0.6% | 4.7% | 95.1% | — |
| WRLD | 33.0% | 5.9% | 5.7% | 8.8% | 67.8% | 17.7% |
| PRG | 14.7% | 6.0% | 13.8% | 17.6% | 34.8% | 16.6% |
Source: Yahoo Finance
EZPW’s gross margin of 58.6% matches FCFS and trails WRLD at 67.8%, while its EBITDA margin of 16.1% is slightly below FCFS at 18.9% and WRLD at 17.7%. Operating margin of 15.2% and net margin of 9.9% are close to FCFS at 16.7% and 9.1%, which points to a scale and operating-cost gap rather than a pricing problem. ROE of 14.8% and ROA of 6.4% are respectable, but they do not stand out against FCFS at 16.3% and 7.8%, so EZPW is competitive rather than best-in-class on returns.
Leverage
| Company | Total Debt/Equity % (mrq) | Current Ratio (mrq) | Total Debt (mrq, USD Mil) | Operating Cash Flow TTM (USD Mil) | Free Cash Flow TTM (USD Mil) | Net Debt/EBITDA (TTM) | FCF Margin % (TTM) |
|---|---|---|---|---|---|---|---|
| EZPW | 70.1 | 4.7 | 800.2 | 173.7 | 1.7 | 1.9 | 0.1% |
| FCFS | 113.6 | 4.8 | 2,610.9 | 612.9 | 190.6 | 3.4 | 4.9% |
| OPFI | 86.1 | 6.2 | 295.2 | 408.3 | — | — | — |
| OPRT | 685.8 | 60 | 2,717.7 | 416.2 | — | — | — |
| WRLD | 188.4 | 14.6 | 661.2 | 259.4 | 14.8 | 6.3 | 2.5% |
| PRG | 120.9 | 4.8 | 936.1 | 296.7 | 1,489.9 | 2.1 | 60.0% |
Source: Yahoo Finance
EZPW’s debt/equity of 70.1% is below FCFS at 113.6%, WRLD at 188.4%, PRG at 120.9%, and far below OPRT at 685.8%, while net debt/EBITDA of 1.9x is also lighter than FCFS at 3.4x, WRLD at 6.3x, and PRG at 2.1x. That lower leverage supports flexibility, but EZPW’s FCF margin of 0.1% is much thinner than FCFS at 4.9% and PRG at 60.0%, so balance-sheet safety is coming more from cash on hand than from strong free cash conversion. In other words, the market is paying a modest multiple for a business that has better leverage than several peers, but not the cash generation to deserve a premium on that basis alone.
Conclusion
I would put my rating as a Hold because the bull case is visible in the numbers, but it is not yet strong enough to outrun the cash-flow and refinancing risk. Revenue growth of 45.9% and EBITDA growth to $83.4M show the pawn network is still scaling, and that is the main reason the stock has already rerated. The problem is that levered free cash flow is only $1.7M TTM and FCF margin is 0.1%, so the business is still not turning that growth into meaningful surplus cash. I would raise my rating more towards a Buy if free cash flow margin moves above 5.0%, meaning the company is funding growth and debt service with real excess cash rather than accounting earnings.
The bear case is straightforward: if the 2025 convertible maturity has to be refinanced at a meaningfully higher cost, or if revenue growth falls back into the low double digits for two straight quarters, the current valuation would look much less forgiving. I would also get more cautious if the Mexico acquisition closes but does not lift EBITDA margin above 16.1%, because that would mean added scale is not improving unit economics. Weighing both sides, I think the market is already giving EZCORP credit for the growth story, while the cash conversion still needs to prove itself. That is why I stay at Hold rather than moving higher today.
What’s your take? I rated EZCORP (EZPW) HOLD above — but the goal here is to get this right, not just to publish an opinion. What would you add to this analysis, or which risk or catalyst do you think I’m under- or over-weighting? Tell me in the comments.
Sources
- SEC 10-K Annual Report — filed 2024-11-13
- SEC 8-K Filing (2024-11-13)
- SEC 8-K Filing (2024-09-11)
- SEC 8-K Filing (2024-07-31)
- SEC 8-K Filing (2024-05-01)
- SEC 8-K Filing (2024-03-28)
- SEC 8-K Filing (2024-01-31)
- SEC Form 4 Insider Transaction (2026-06-08)
- SEC Form 4 Insider Transaction (2026-05-21)
- SEC Form 4 Insider Transaction (2026-05-13)
- SEC 10-K Annual Report — FY2024
- SEC 10-K Annual Report — FY2023
- SEC 10-K Annual Report — FY2022
- SEC 10-K Annual Report — FY2021
- SEC 10-K Annual Report — FY2020
Data sourced from Yahoo Finance and SEC EDGAR. Not investment advice.
Leave a Comment