| Company | Jul 25 | Aug 25 | Sep 25 | Oct 25 | Nov 25 | Dec 25 | Jan 26 | Feb 26 | Mar 26 | Apr 26 | May 26 | Jun 26 | 12-Mo |
|---|---|---|---|---|---|---|---|---|---|---|---|---|---|
| RCAT | +14% | +8% | +16% | +9% | -34% | +7% | +70% | -14% | +12% | -10% | +24% | -27% | +46% |
| AVAV | -6% | -10% | +30% | +17% | -24% | -13% | +15% | -9% | -27% | +7% | +6% | -20% | -42% |
| KTOS | +26% | +12% | +39% | -1% | -16% | -0% | +36% | -16% | -18% | -11% | +2% | -22% | +7% |
| ONDS | +10% | +176% | +32% | -17% | +23% | +24% | +6% | -3% | -10% | +11% | +32% | -38% | +329% |
| DPRO | +64% | -6% | +67% | +35% | -33% | -5% | +5% | -10% | -25% | +10% | +39% | -27% | +71% |
Source: Yahoo Finance monthly adjusted close.
Executive Summary
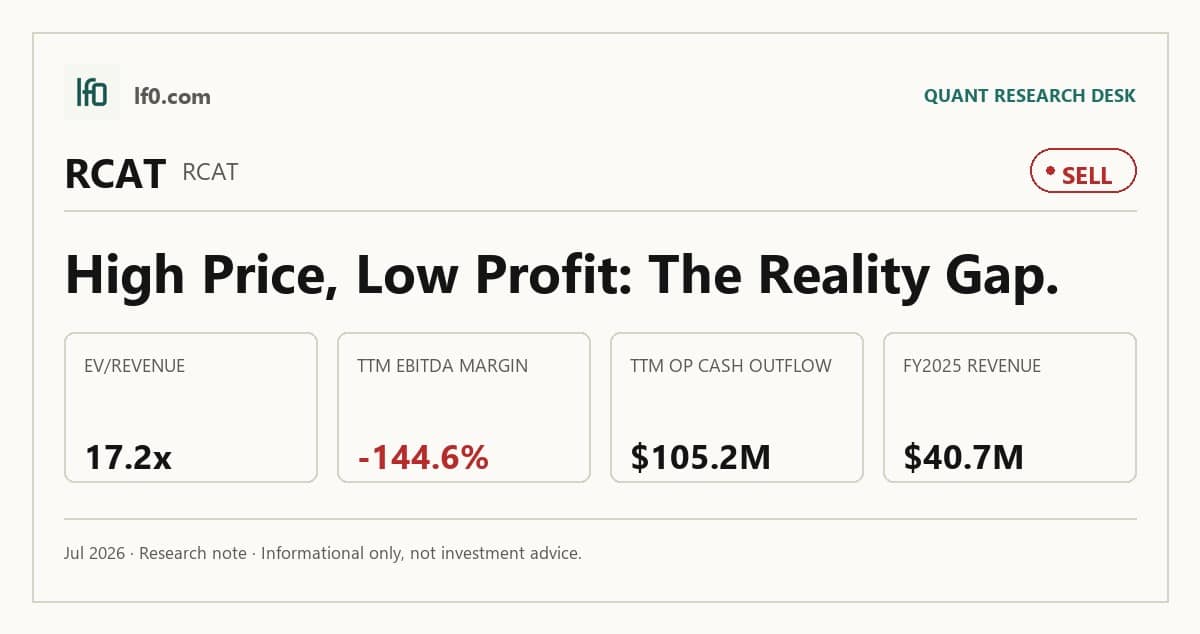
Rating: SELL | RCAT
Measured from adjusted close on 2026-07-22 to 2026-10-21. Sell ratings are correct when the stock falls; Hold is tracked as a +/-10% range. Daily-close data, not intraday. Calls are tracked for 182 days from publication, then frozen as a final record.
I would put my rating as a Sell because Red Cat is still funding growth with dilution while the operating model remains cash consuming, and the current valuation already prices in a much cleaner earnings path than the numbers show. FY2025 revenue of $40.7M was real progress, but TTM operating cash flow of $-105.2M and FCF margin of -163.4% tell me the business is not yet converting the SRR program into self-funding scale, so the stock is being asked to do too much before the economics have caught up. I would raise my rating more towards a Buy if quarterly revenue can hold above $20M for two consecutive quarters, meaning the SRR ramp is becoming repeatable rather than lumpy, and if gross margin moves materially above 7.5%, which would signal better absorption of fixed manufacturing costs.
Company Profile
Red Cat Holdings Inc. provides drone and robotic systems for defense, national security, and commercial users. The company sells small unmanned aircraft systems, uncrewed surface vessels, related software, and support services tied mainly to government and public safety programs. It operates as one segment and had 244 full-time employees at December 31, 2025. Manufacturing is centered in Salt Lake City, Torrance, and Valdosta, with additional production through third-party plants in the U.S., Asia, and other regions. The common stock trades on Nasdaq under RCAT.
Economic Moat
Business Model
In my view, Red Cat’s moat is not scale; it is qualification. Teal Drones’ AS9100 certification, achieved in July 2025, is the hardest element for a well-funded competitor to replicate quickly because it covers design, manufacturing, and maintenance across the product lifecycle. That certification matters because it turns quality control into a procurement filter for defense and public safety buyers. The U.S. Army Short Range Reconnaissance Program of Record selection in November 2024 adds program-level validation, while UAVPatent Corp.’s 34 issued patents and 13 pending patents provide a second layer of protection. Blue UAS certification, the FAA authorization to operate without broadcasting Remote ID through January 31, 2028, and the FCC Covered List changes in December 2025 and January 2026 all reinforce the domestic compliance edge.
Business & Operating Risks
The main disclosed risk is financing dependence. Red Cat has incurred net losses since inception, reported an accumulated deficit of $196.8M at December 31, 2025, and warns that it may need additional capital to fund expanding operations until profitability arrives. Customer demand is also volatile because purchase orders can be canceled or delayed on short notice, and the company cannot rely on long-term commitments. Execution risk remains high given lengthy product development cycles, a material weakness in internal control over financial reporting, and reliance on sole-source suppliers for critical components. These risks do not yet break the moat itself, but they do threaten the company’s ability to turn its qualification advantage into durable earnings before dilution and cash burn erode the equity story.
Management Discussion & Analysis
Management is responding to those risks by funding the business aggressively, but it is still leaning on capital markets rather than operating cash flow. Red Cat raised $30M in April 2025, $46.8M in June 2025, and $172.5M in September 2025, which extends runway but also confirms dilution remains part of the model. The filing links FY2025 revenue of $40.7M to scaling drone deliveries under the SRR program, so the top line is still concentrated in one defense channel. Gross profit of $1.3M in the 2025 period, or about 3.2% of revenue, shows the manufacturing base is not yet absorbing overhead the way a stronger moat would imply. The company is spending heavily on R&D and sales, which is rational for a platform buildout, but the $89.1M of operating cash outflow means management has not yet converted the moat into self-funding scale.
Recent Events
The May 12, 2026 equity offering, which closed on May 14 and raised about $225M before fees, is the clearest sign that management is still using the market to finance growth. That strengthens the balance sheet, but it also tells me the company is not yet at the point where the moat funds itself. The May 19 closing of Quaze Technologies, paid partly in 1.9M shares with up to $5M of earnout stock tied to integration, revenue, and gross margin thresholds, is more strategic because it broadens the product set into uncrewed surface systems. A $9.5M U.S. Army purchase order for Teal Drones on May 8 reinforces the defense pipeline and supports the moat thesis, but the recent events also show that qualification wins still need to be converted into repeatable economics.
Financial Analysis
Growth
RCAT — Financial Growth (Quarterly, USD Mil)
| Metric | 2025-03-31 | 2025-06-30 | 2025-09-30 | 2025-12-31 | 2026-03-31 |
|---|---|---|---|---|---|
| REVENUE (USD Mil) | 1.6 | 3.2 | 9.6 | 26.2 | 15.5 |
| EBIT (USD Mil) | -12.5 | -12.6 | -17.5 | -23.9 | -27.3 |
| EBITDA (USD Mil) | -11.9 | -12.1 | -17 | -23.3 | -26.5 |
| NET INCOME (USD Mil) | -23.1 | -13.3 | -16 | -19.7 | -26.6 |
| DILUTED EPS | -0.3 | -0.1 | -0.2 | -0.2 | -0.2 |
Source: Yahoo Finance — Quarterly Financial Statements
Revenue accelerated sharply in FY2025, then turned choppy in the first quarter of 2026. FY2025 revenue of $40.7M was up 128% from FY2024, which is consistent with the SRR ramp management has been describing. Quarterly revenue rose from $1.6M in Q1 2025 to $26.2M in Q4 2025 before easing to $15.5M in Q1 2026, so the growth profile still looks program-driven rather than smooth. That matters because the moat described above can support a premium only if the revenue base becomes repeatable, not just episodic.
Profitability
RCAT — Profitability (TTM)
| Metric | TTM |
|---|---|
| Operating Margin (TTM) | -176.5% |
| Net Margin (TTM) | -138.4% |
| Return on Assets (TTM) | -29.8% |
| Return on Equity (TTM) | -56.4% |
| Gross Margin (TTM) | 7.5% |
| EBITDA Margin (TTM) | -144.6% |
Source: Yahoo Finance — Trailing Twelve Months (TTM)
RCAT’s gross margin is 7.5%, operating margin is -176%, EBITDA margin is -145%, and net margin is -138%, all far below AVAV’s 25.3%, 2.8%, 9.8%, and -13.4%, KTOS’s 22.9%, 1.8%, 5.7%, and 2.1%, and ONDS’s 44.9% gross margin. The gap looks structural rather than temporary because RCAT’s gross margin is already well below peers, which means the issue is not just overhead scale but the economics of what it sells. That is the clearest sign that the moat has not yet translated into peer-quality profitability.
Valuation
RCAT — Valuation Multiples
| Metric | Value |
|---|---|
| Market Cap (USD Mil) | 1,303 |
| Enterprise Value (USD Mil) | 936 |
| Forward P/E | -23.8 |
| Price/Sales (TTM) | 23.9 |
| Price/Book (mrq) | 4.4 |
| EV/Revenue | 17.2 |
| EV/EBITDA | -11.9 |
| Beta (5Y Monthly) | 1.30 |
| FCF Yield % (TTM) | -6.8% |
| Forward EPS (USD) | -0.4 |
| Analyst Target Price – Low (USD) | 20 |
| Analyst Target Price – Mean (USD) | 22 |
| Analyst Target Price – High (USD) | 25 |
| # Analyst Opinions | 6 |
Source: Yahoo Finance
RCAT trades at 17.2x EV/Revenue and 23.9x Price/Sales, above AVAV at 3.9x, KTOS at 5.5x, ONDS at 24.3x EV/Revenue, and DPRO at 1.9x. On FCF Yield, RCAT is -6.84%, worse than AVAV at -3.3%, KTOS at -1.2%, ONDS at -0.4%, and DPRO at -12.8%, so the stock is not being supported by cash generation. With Forward EPS at -0.36 versus AVAV at 4.5, KTOS at 1.1, ONDS at 0.0, and DPRO at -0.5, I feel the market is already giving RCAT credit for a recovery that still needs to show up in earnings. The valuation premium is therefore tied to the same growth and qualification thesis discussed above, but the lack of cash conversion makes that premium hard to defend.
Leverage
RCAT — Leverage & Coverage (Quarterly)
| Metric | Value |
|---|---|
| Total Debt/Equity % (mrq) | 5.8 |
| Current Ratio (mrq) | 11 |
| Total Debt (mrq, USD Mil) | 13.8 |
| Net Debt/EBITDA (TTM) | 1.5 |
| FCF Margin % (TTM) | -163.4% |
Source: Yahoo Finance — Quarterly Financial Statements
RCAT’s debt/equity is 5.8%, lower than AVAV’s 19.0% and close to KTOS’s 5.4%, but its net debt/EBITDA is 1.5x versus AVAV at 1.0x and KTOS at -15.8x, so cash does not fully offset the earnings shortfall. The current ratio of 11.0x and cash per share of $1.07 help near-term liquidity, yet negative FCF margin of -163.4% and FCF of $-89.2M TTM mean the balance sheet is a runway, not a source of value. Compared with peers, the leverage profile is not the problem by itself; the problem is that weak cash conversion leaves little room for execution error.
Insider Activity
The insider record here is limited to option exercises and tax withholding, with no open-market purchases or sales in the 2025-01-03 to 2026-04-30 window. I read that as neutral rather than informative. There is no clear alignment signal from voluntary insider buying, but there is also no evidence of insider selling pressure.
Comparable Analysis
Growth
| Company | Revenue TTM (USD Mil) | Revenue Growth YoY % | EBITDA TTM (USD Mil) | Diluted EPS TTM |
|---|---|---|---|---|
| RCAT | 54.6 | 849.1% | -78.9 | -0.8 |
| AVAV | 1,976.8 | 133.3% | 194.6 | -5.4 |
| KTOS | 1,415.2 | 22.6% | 81.2 | 0.2 |
| ONDS | 96.6 | 1,079.9% | -74.6 | 0.1 |
| DPRO | 8.5 | 49.4% | -24.6 | -0.7 |
Source: Yahoo Finance
RCAT’s revenue growth was 849.1% TTM on $54.6M of sales, versus AVAV at 133.3% on $2B, KTOS at 22.6% on $1.4B, ONDS at 1,079.9% on $96.6M, and DPRO at 49.4% on $8.5M. The growth rate is eye-catching, but the absolute base is still small, so the market is paying for early-stage momentum rather than proven scale. That is why the growth comparison supports interest in the name, but not yet confidence in the earnings path.
Valuation
| Company | Forward P/E | EV/Revenue | EV/EBITDA | Price/Sales (TTM) | Price/Book (mrq) | Market Cap (USD Mil) | Enterprise Value (USD Mil) | Beta (5Y Monthly) | FCF Yield % (TTM) | Forward EPS | Analyst Target Price – Low | Analyst Target Price – Mean | Analyst Target Price – High | # Analyst Opinions |
|---|---|---|---|---|---|---|---|---|---|---|---|---|---|---|
| RCAT | -23.8 | 17.2 | -11.9 | 23.9 | 4.4 | 1,303 | 936 | 1.30 | -6.8% | -0.4 | 20 | 22 | 25 | 6 |
| AVAV | 33.6 | 3.9 | 39.6 | 3.9 | 1.7 | 7,711 | 7,707 | 1.40 | -3.3% | 4.5 | 166 | 231.7 | 326 | 19 |
| KTOS | 45 | 5.5 | 95.6 | 6.5 | 2.7 | 9,200 | 7,761 | 1.07 | -1.2% | 1.1 | 60 | 109.3 | 150 | 21 |
| ONDS | -265 | 24.3 | -31.4 | 46.9 | 3.5 | 4,530 | 2,347 | 2.69 | -0.4% | 0 | 16 | 19.8 | 25 | 8 |
| DPRO | -9.3 | 1.9 | -0.7 | 19.8 | 1.5 | 168 | 16 | 3.73 | -12.8% | -0.5 | 8.8 | 11.5 | 13.7 | 6 |
Source: Yahoo Finance
Profitability
| Company | Operating Margin (TTM) | Net Margin (TTM) | Return on Assets (TTM) | Return on Equity (TTM) | Gross Margin (TTM) | EBITDA Margin (TTM) |
|---|---|---|---|---|---|---|
| RCAT | -176.5% | -138.4% | -29.8% | -56.4% | 7.5% | -144.6% |
| AVAV | 2.8% | -13.4% | -1.3% | -10.0% | 25.3% | 9.8% |
| KTOS | 1.8% | 2.1% | 0.6% | 1.2% | 22.9% | 5.7% |
| ONDS | -85.1% | 251.9% | -4.2% | 42.9% | 44.9% | -77.3% |
| DPRO | -329.3% | -296.4% | -18.5% | -32.0% | 19.1% | -289.9% |
Source: Yahoo Finance
Leverage
| Company | Total Debt/Equity % (mrq) | Current Ratio (mrq) | Total Debt (mrq, USD Mil) | Net Debt/EBITDA (TTM) | FCF Margin % (TTM) |
|---|---|---|---|---|---|
| RCAT | 5.8 | 11 | 13.8 | 1.5 | -163.4% |
| AVAV | 19 | 4.3 | 834.8 | 1 | -12.7% |
| KTOS | 5.4 | 5.6 | 185.4 | -15.8 | -7.5% |
| ONDS | 1.5 | 10.9 | 16.7 | 19.5 | -16.2% |
| DPRO | 0.1 | 30.6 | 0.2 | 6.1 | -253.4% |
Source: Yahoo Finance
Conclusion
I would put my rating as a Sell because the key tension is still unresolved: Red Cat has a real defense qualification moat, but the numbers have not yet shown that moat turning into durable cash generation. The company has the right strategic assets, and the SRR program is clearly moving revenue, but TTM operating margin of -176%, net margin of -138%, and FCF margin of -163.4% tell me the economics are still too weak for the current valuation.
I would move from Sell toward Buy if quarterly revenue can stay above $20M for two consecutive quarters, meaning the SRR ramp is repeatable, and if gross margin moves materially above 7.5%, which would show the manufacturing base is absorbing fixed costs instead of adding to them. A positive operating margin would be the real inflection point because it would show the business is finally earning enough on each sale to cover its overhead.
I would move from Sell to Strong Sell if quarterly revenue slips back below $10M while operating cash outflow remains near the current pace, because that would tell me the recent ramp was not durable and the company would be burning cash without enough scale to justify repeated equity raises. Another financing before operating cash flow turns positive would also be a clear warning sign, since it would confirm dilution is still the bridge rather than a temporary tool.
For now, I think the bear case is more likely to show up first. The stock can work if the SRR program keeps compounding and margins improve quickly, but until that shows up in the reported numbers, I would stay with Sell.
What’s your take? I rated Red Cat Holdings (RCAT) SELL above — but the goal here is to get this right, not just to publish an opinion. What would you add to this analysis, or which risk or catalyst do you think I’m under- or over-weighting? Tell me in the comments.
Sources
- SEC 10-K Annual Report — filed 2026-03-19
- SEC 8-K Filing (2026-05-20)
- SEC 8-K Filing (2026-05-18)
- SEC 8-K Filing (2026-05-14)
- SEC 8-K Filing (2026-05-11)
- SEC 8-K Filing (2026-05-07)
- SEC 8-K Filing (2026-03-31)
- SEC Form 4 Insider Transaction (2026-05-11)
- SEC Form 4 Insider Transaction (2026-05-04)
- SEC Form 4 Insider Transaction (2026-05-04)
- SEC 10-K Annual Report — FY2026
- SEC 10-K Annual Report — FY2024
- SEC 10-K Annual Report — FY2023
- SEC 10-K Annual Report — FY2022
- SEC 10-K Annual Report — FY2021
Data sourced from Yahoo Finance and SEC EDGAR. Not investment advice.
Leave a Comment