| Company | Jul 25 | Aug 25 | Sep 25 | Oct 25 | Nov 25 | Dec 25 | Jan 26 | Feb 26 | Mar 26 | Apr 26 | May 26 | Jun 26 | 12-Mo |
|---|---|---|---|---|---|---|---|---|---|---|---|---|---|
| MYRG | +7% | -3% | +11% | +5% | +3% | -3% | +14% | +8% | +5% | +43% | +15% | +8% | +176% |
| FIX | +31% | +0% | +17% | +17% | +1% | -4% | +22% | +25% | -3% | +33% | -1% | +8% | +270% |
| FLR | +11% | -28% | +3% | +16% | -12% | -8% | +17% | +13% | -11% | +14% | -14% | +14% | +2% |
| EME | +17% | -1% | +5% | +4% | -9% | -1% | +18% | +1% | +2% | +21% | -7% | +0% | +55% |
| MTZ | +11% | -4% | +17% | -4% | +5% | +2% | +11% | +24% | +8% | +22% | -4% | +10% | +144% |
| PRIM | +21% | +26% | +16% | +3% | -11% | -2% | +19% | +2% | -5% | +27% | -31% | -21% | +28% |
Source: Yahoo Finance monthly adjusted close.
Executive Summary
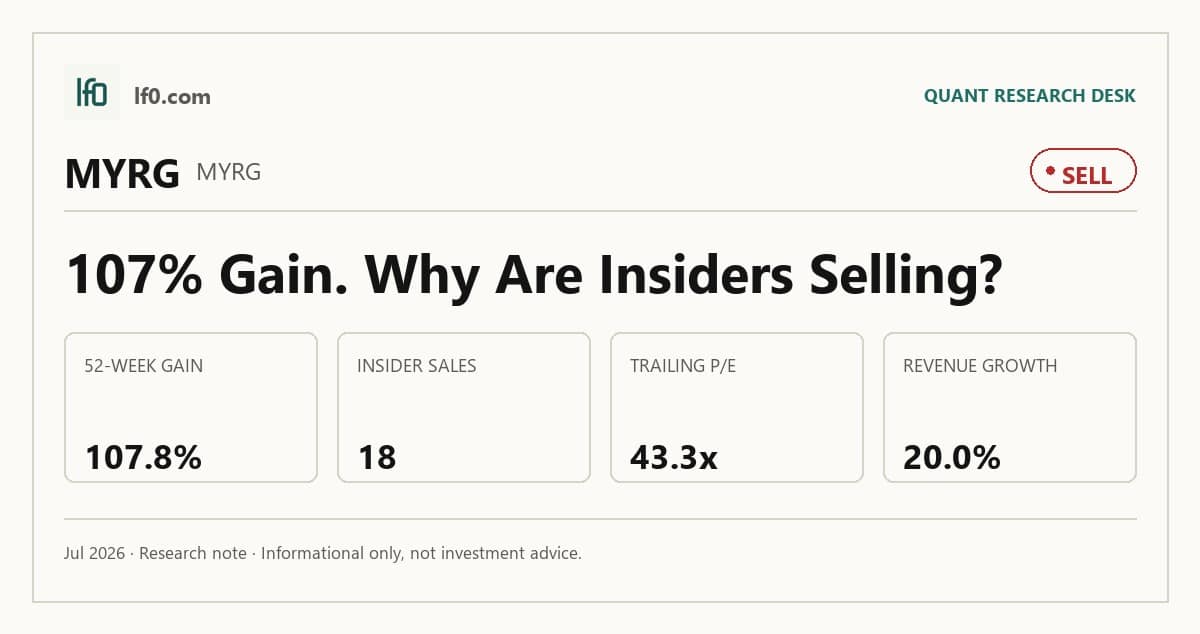
Rating: SELL | MYRG
Measured from adjusted close on 2026-07-17 to 2026-10-16. Sell ratings are correct when the stock falls; Hold is tracked as a +/-10% range. Daily-close data, not intraday. Calls are tracked for 182 days from publication, then frozen as a final record.
I would put my rating as a Sell because the stock already discounts a strong operating run while the filing still shows a business exposed to project execution risk and insider selling. MYR Group has delivered $1B revenue growth in the latest quarter and a 6.0% TTM free cash flow margin, but those gains now sit against 23.4x EV/EBITDA and 43.3x trailing P/E, which leaves little room for a miss. In my view, the key question is not whether the business is improving; it is whether that improvement is durable enough to justify the current multiple. I would turn more constructive only if revenue stays above $1B per quarter and EBITDA remains above $80M, because that would show the higher base is still compounding rather than flattening.
Company Profile
MYR Group Inc. is a holding company for specialty electrical construction businesses. Through its subsidiaries, it provides design, engineering, procurement, construction, upgrade, maintenance, and repair services for electric utility infrastructure and commercial and industrial customers in the United States and Canada.
The company operates through two segments: Transmission and Distribution, or T&D, and Commercial and Industrial, or C&I. T&D accounted for 54.7% of FY2025 revenue, while C&I contributed 45.3%, so the business is split between utility grid work and nonresidential electrical contracting. MYR Group is headquartered in Thornton, Colorado, and trades on Nasdaq under MYRG.
Economic Moat
Business Model
MYR Group’s moat comes from scale in technically demanding electrical infrastructure work. It describes itself as one of the largest U.S. contractors serving the T&D sector, and that matters because large transmission and distribution jobs require bonding capacity, specialized labor, and a mobile fleet of trucks, cranes, digger derricks, and other equipment that smaller contractors cannot assemble quickly. I feel that combination is hard to replicate within a few years because a new entrant would need not only equipment, but also surety relationships, field crews, and a project record that qualifies it for the same work.
The company also benefits from a base of multi-year master service agreements, or MSAs, in T&D. Those contracts support repeat maintenance, upgrade, and emergency restoration work, which gives MYR a steadier revenue base than a pure one-off project contractor. That recurring layer is important because it helps offset the lumpiness of large transmission awards and ties the moat to execution, not just to bidding scale.
Business & Operating Risks
The main disclosed risk is project execution on fixed-price and unit-price work. According to the risk factors in MYR Group’s SEC 10-K, delays can come from design issues, customer-provided materials, permits, weather, government shutdowns, and labor inefficiency, and missed schedules can trigger extra costs or liquidated damages. For a contractor with percentage-of-completion accounting, that is not boilerplate: a bad estimate can hurt both margin and timing in the same quarter.
Customer demand and funding risk are also material. The filing warns that inflation, tariffs, higher interest rates, recessionary conditions, and tighter customer financing can reduce spending on MYR’s services. Labor shortages, safety incidents, wildfire exposure, and cyber risk add another layer of pressure. I do not think these risks break the moat itself, but they do threaten the execution advantage that moat depends on, because the edge only matters if the company can staff, price, and deliver the work without a costly miss.
Management Discussion & Analysis
Management is responding to those risks by keeping the balance sheet flexible and pushing growth through both organic bidding and acquisitions. The company repurchased 639,207 shares in 2025 at a weighted-average price of $117.33, spent $94.4M on capital expenditures, and used only $408.3M of its $490M revolving credit facility as of year-end 2025. That tells me management is not under liquidity stress, even while it keeps investing in fleet and working capital.
The 2026 outlook is constructive but delayed. Management expects continued bidding on large transmission projects and more distribution opportunities, but it also says major awards signed in 2026 may not contribute much to 2026 results because construction would not begin until 2027 or later. That is an important distinction: the company is addressing the project pipeline risk, but the earnings payoff still depends on conversion timing, not just on demand rhetoric.
Recent Events
The most important recent event is the May 27, 2026 agreement to acquire Valley Holdings I, Inc. and its subsidiaries for about $328M, subject to regulatory approval and other closing conditions. Valley is a full-service electrical contractor based in Everett, Washington, so this is a direct expansion of MYR’s operating footprint rather than a financial transaction. In my view, the deal strengthens the moat if integration goes well, because it adds scale in a fragmented market and broadens the company’s customer base.
The related press release and investor presentation show that management is actively preparing the market for the acquisition, which suggests the deal is central to the near-term strategy. The funding mix includes cash and revolver borrowings, so the transaction also tests capital allocation discipline. I see the recent filings as supportive of the moat thesis, but the real question is whether MYR can absorb the new platform without weakening execution.
Financial Analysis
Growth
MYRG — Financial Growth (Quarterly, USD Mil)
| Metric | 2025-03-31 | 2025-06-30 | 2025-09-30 | 2025-12-31 | 2026-03-31 |
|---|---|---|---|---|---|
| REVENUE (USD Mil) | 833.6 | 900.3 | 950.4 | 973.5 | 1,000.4 |
| EBIT (USD Mil) | 34.2 | 39.3 | 46.2 | 47.3 | 64.7 |
| EBITDA (USD Mil) | 50.4 | 55.6 | 62.9 | 64.5 | 82.4 |
| NET INCOME (USD Mil) | 23.3 | 26.5 | 32.1 | 36.5 | 46.8 |
| DILUTED EPS | 1.4 | 1.7 | 2 | 2.3 | 3 |
Source: Yahoo Finance — Quarterly Financial Statements
Revenue rose from $833.6M in Q1 2025 to $1B in Q1 2026, a 20.0% increase, while EBITDA climbed from $50.4M to $82.4M and net income from $23.3M to $46.8M. That is the kind of operating leverage I want to see in a contractor, because the business is not just growing sales; it is converting more of each revenue dollar into profit.
The quarterly progression also fits the moat discussion above. A broader T&D and C&I footprint should help smooth project timing, and the current growth pattern suggests that scale is still translating into earnings. I would not call it effortless, though: the step-up is good enough to support the thesis, but it still needs clean execution to hold.
Profitability
MYRG — Profitability (TTM)
| Metric | TTM |
|---|---|
| Operating Margin (TTM) | 6.4% |
| Net Margin (TTM) | 3.7% |
| Return on Assets (TTM) | 7.6% |
| Return on Equity (TTM) | 22.7% |
| Gross Margin (TTM) | 12.1% |
| EBITDA Margin (TTM) | 6.8% |
Source: Yahoo Finance — Trailing Twelve Months (TTM)
TTM operating margin was 6.4%, net margin was 3.7%, gross margin was 12.1%, and EBITDA margin was 6.8%. Those are respectable margins for a contractor, but they also show how little room there is between project cost and overhead. The spread from gross margin to EBITDA margin is only 5.2 percentage points, so the business is not bloated, yet it is still exposed if project estimates slip.
Returns are solid rather than exceptional. Return on assets was 7.6% TTM and return on equity was 22.7%, which tells me the company is earning decent returns on capital, helped in part by its balance-sheet structure. That matters for the thesis because the growth story is only worth paying for if it keeps showing up in margin and return metrics, not just in revenue.
Valuation
MYRG — Valuation Multiples
| Metric | Value |
|---|---|
| Market Cap (USD Mil) | 6,112 |
| Enterprise Value (USD Mil) | 6,108 |
| Trailing P/E | 43.3 |
| Forward P/E | 29.1 |
| Price/Sales (TTM) | 1.6 |
| Price/Book (mrq) | 8.7 |
| EV/Revenue | 1.6 |
| EV/EBITDA | 23.4 |
| Beta (5Y Monthly) | 1.31 |
| FCF Yield % (TTM) | 3.7% |
| Forward EPS (USD) | 13.5 |
| Analyst Target Price – Low (USD) | 295 |
| Analyst Target Price – Mean (USD) | 445.5 |
| Analyst Target Price – High (USD) | 564 |
| # Analyst Opinions | 6 |
Source: Yahoo Finance
MYR Group trades at 1.6x EV/revenue, 23.4x EV/EBITDA, 43.3x trailing P/E, and 29.1x forward P/E. On my read, that is a full valuation for a contractor with 6.8% EBITDA margin and 3.7% net margin, even if the company is growing faster than several peers. The 3.7% FCF yield is not weak, but it is not enough to make the stock look cheap on its own.
I would put fair value in a range of about $360-$470 per share based on the operating profile here, with the lower end reflecting the leverage to execution risk and the upper end reflecting the company’s stronger growth and balance sheet. That range sits around the analyst mean target of $446, which tells me the Street is broadly aligned with my view even if the stock already trades near the richer end of that band. Forward EPS of 13.5 looks reasonable against the current margin profile, but it is not so high relative to peers that it justifies a large premium by itself.
I would also note that the market is paying for earnings quality, not liquidation value. With a market cap of $6.11B and book value per share of 45.15, the stock is valued on the assumption that the current margin base can hold and improve, which is why the valuation and profitability sections have to be read together.
Leverage
MYRG — Leverage & Coverage (Quarterly)
| Metric | Value |
|---|---|
| Total Debt/Equity % (mrq) | 8.8 |
| Current Ratio (mrq) | 1.3 |
| Total Debt (mrq, USD Mil) | 61.5 |
| Operating Cash Flow (TTM, USD Mil) | 328 |
| Levered Free Cash Flow (TTM, USD Mil) | 227.8 |
| Net Debt/EBITDA (TTM) | -0.4 |
| FCF Margin % (TTM) | 6.0% |
Source: Yahoo Finance — Quarterly Financial Statements
The balance sheet is a clear strength. Total debt was $61.52M, debt to equity was 8.8%, current ratio was 1.3x, and net debt to EBITDA was -0.4x TTM, which means cash exceeds debt on a net basis. Operating cash flow was $328M TTM and levered free cash flow was $227.8M TTM, so the company is converting earnings into cash rather than relying on financing.
That said, I would not overstate the fortress aspect. The liquidity cushion is healthy, but it is not so large that a major project overrun or acquisition misstep would be irrelevant. The balance sheet supports the thesis, yet the thesis still depends on execution.
Insider Activity
The insider tape is negative. The transaction record shows 8 open-market sales in early June 2026 and no open-market purchases in the sample provided, which is enough for me to say insiders are not signaling conviction at these prices. With insider ownership at 1.85%, alignment is already limited, so the recent selling matters more as a sentiment signal than as a governance issue.
Comparable Analysis
Growth
| Company | Revenue TTM (USD Mil) | Revenue Growth YoY % | EBITDA TTM (USD Mil) | Diluted EPS TTM |
|---|---|---|---|---|
| MYRG | 3,824.7 | 20.0% | 261.3 | 9.1 |
| FIX | 10,135.7 | 1.0% | 1,736.3 | 34.6 |
| FLR | 15,184 | -8.0% | -353 | 2.2 |
| EME | 17,747.3 | 19.7% | 1,850.8 | 29.8 |
| MTZ | 15,280.2 | 34.5% | 1,202.4 | 5.7 |
| PRIM | 7,486.7 | -5.4% | 465.9 | 4.5 |
Source: Yahoo Finance
MYRG’s 20.0% revenue growth is ahead of FLR at -8.0% and PRIM at -5.4%, close to EME at 19.7%, and below MTZ at 34.5%. FIX is only at 1.0%, so MYRG sits in the stronger half of the group on growth, which supports a premium but does not make it a clear leader.
Valuation
| Company | Trailing P/E | Forward P/E | EV/Revenue | EV/EBITDA | Price/Sales (TTM) | Price/Book (mrq) | Market Cap (USD Mil) | Enterprise Value (USD Mil) | Beta (5Y Monthly) | FCF Yield % (TTM) | Forward EPS | Analyst Target Price – Low | Analyst Target Price – Mean | Analyst Target Price – High | # Analyst Opinions |
|---|---|---|---|---|---|---|---|---|---|---|---|---|---|---|---|
| MYRG | 43.3 | 29.1 | 1.6 | 23.4 | 1.6 | 8.7 | 6,112 | 6,108 | 1.31 | 3.7% | 13.5 | 295 | 445.5 | 564 | 6 |
| FIX | 47.9 | 30.6 | 6.1 | 35.4 | 5.8 | 90.4 | 58,403 | 61,398 | 1.66 | 1.9% | 54.2 | 1,910 | 2,064 | 2,200 | 7 |
| FLR | 22.6 | 15.1 | 0.3 | -12.4 | 0.5 | 2.4 | 6,902 | 4,393 | 1.23 | 5.0% | 3.3 | 40 | 52.4 | 64 | 8 |
| EME | 24.8 | 22.5 | 1.9 | 17.8 | 1.9 | 8.5 | 32,918 | 32,933 | 1.13 | 2.7% | 32.9 | 885 | 1,000.1 | 1,123 | 7 |
| MTZ | 58.1 | 30.1 | 1.9 | 24.5 | 1.7 | 7.8 | 26,314 | 29,448 | 1.77 | 0.1% | 11.1 | 240 | 481.7 | 581 | 19 |
| PRIM | 19.1 | 16.2 | 0.7 | 11.5 | 0.6 | 2.8 | 4,701 | 5,341 | 1.42 | 2.7% | 5.4 | 85 | 127.5 | 186 | 14 |
Source: Yahoo Finance
MYRG trades at 23.4x EV/EBITDA, 43.3x trailing P/E, 29.1x forward P/E, and 1.6x EV/revenue, versus EME at 17.8x EV/EBITDA and 1.9x EV/revenue, PRIM at 11.5x and 0.7x, and FLR at -12.4x and 0.3x. FIX is much richer on EV/revenue at 6.1x, but it also carries a stronger profitability profile, so the comparison is not apples to apples. MYRG’s 3.7% FCF yield is only middling, and that is why I do not see a valuation discount here.
The valuation gap makes more sense when paired with leverage. MYRG’s net debt/EBITDA of -0.4x is better than EME’s -0.2x and far better than MTZ’s 2.3x or PRIM’s 1.2x, so the market is paying for a cleaner balance sheet as well as for growth. Even so, the current multiple already reflects a lot of that advantage.
Profitability
| Company | Operating Margin (TTM) | Net Margin (TTM) | Return on Assets (TTM) | Return on Equity (TTM) | Gross Margin (TTM) | EBITDA Margin (TTM) |
|---|---|---|---|---|---|---|
| MYRG | 6.4% | 3.7% | 7.6% | 22.7% | 12.1% | 6.8% |
| FIX | 7.9% | 12.1% | 17.3% | 53.3% | 25.1% | 17.1% |
| FLR | -1.2% | 2.3% | -3.2% | 10.2% | -1.6% | -2.3% |
| EME | 8.7% | 7.5% | 11.8% | 39.2% | 19.3% | 10.4% |
| MTZ | 3.7% | 2.9% | 4.9% | 15.0% | 12.8% | 7.9% |
| PRIM | 1.9% | 3.3% | 5.5% | 15.9% | 10.4% | 6.2% |
Source: Yahoo Finance
MYRG’s 6.4% operating margin and 6.8% EBITDA margin are below EME’s 8.7% and 10.4%, but above MTZ’s 3.7% and 7.9% and well ahead of FLR’s negative margins. Return on equity of 22.7% and return on assets of 7.6% are solid, though still below FIX at 53.3% and 17.3%. I read that as decent capital efficiency rather than best-in-class efficiency.
Leverage
| Company | Total Debt/Equity % (mrq) | Current Ratio (mrq) | Total Debt (mrq, USD Mil) | Operating Cash Flow TTM (USD Mil) | Free Cash Flow TTM (USD Mil) | Net Debt/EBITDA (TTM) | FCF Margin % (TTM) |
|---|---|---|---|---|---|---|---|
| MYRG | 8.8 | 1.3 | 61.5 | 328 | 227.8 | -0.4 | 6.0% |
| FIX | 45.5 | 1.2 | 303.9 | 1,663.1 | 1,099.8 | 0.1 | 10.8% |
| FLR | 36.3 | 1.8 | 1,071 | 9 | 345.1 | 7.4 | 2.3% |
| EME | 13.4 | 1.3 | 516.5 | 1,194.2 | 891.5 | -0.2 | 5.0% |
| MTZ | 88 | 1.3 | 3,019.9 | 566.2 | 12.6 | 2.3 | 0.1% |
| PRIM | 55.1 | 1.3 | 928 | 281.6 | 128.2 | 1.2 | 1.7% |
Source: Yahoo Finance
MYRG is the cleanest balance sheet in the group on a net basis, with 8.8% debt to equity, 1.3x current ratio, and -0.4x net debt to EBITDA. FIX has more debt but also stronger cash generation, while MTZ and PRIM carry much heavier leverage and weaker free cash flow margins. That is why MYRG deserves some valuation support, but not enough to erase the premium already embedded in the stock.
Conclusion
I would put my rating as a Sell because the core tension is now valuation versus execution, and the market is already paying for a lot of the good news. MYR Group has real strengths: 20.0% revenue growth, a 6.8% EBITDA margin, and net cash on the balance sheet. But the stock also trades at 23.4x EV/EBITDA and 29.1x forward P/E, which leaves little margin for error if project timing slips or the Valley acquisition takes longer to integrate than expected.
I would move this closer to a Buy if revenue can stay above $1B per quarter, EBITDA can hold above $80M, and free cash flow remains positive, because that would show the higher base is converting into durable earnings power rather than a short-lived spike. I would move lower if revenue growth falls below 10% for two straight quarters or if EBITDA margin slips back toward the mid-5% area, since that would tell me the current re-rating is running ahead of the underlying business. A large fixed-price project miss would be the clearest version of that bear case, because one overrun can erase a quarter’s profit in this business.
Weighing both sides, I think the downside case is easier to trigger than the upside case is to prove. The company can still compound from here, but at this valuation I want another clean quarter or two before I would pay up for it.
What’s your take? I rated MYR Group (MYRG) SELL above — but the goal here is to get this right, not just to publish an opinion. What would you add to this analysis, or which risk or catalyst do you think I’m under- or over-weighting? Tell me in the comments.
Sources
- SEC 10-K Annual Report — filed 2026-02-25
- SEC 8-K Filing (2026-05-28)
- SEC 8-K Filing (2026-05-27)
- SEC 8-K Filing (2026-05-14)
- SEC 8-K Filing (2026-04-29)
- SEC 8-K Filing (2026-04-28)
- SEC 8-K Filing (2026-03-03)
- SEC Form 4 Insider Transaction (2026-06-04)
- SEC Form 4 Insider Transaction (2026-06-04)
- SEC Form 4 Insider Transaction (2026-06-02)
- SEC 10-K Annual Report — FY2026
- SEC 10-K Annual Report — FY2025
- SEC 10-K Annual Report — FY2024
- SEC 10-K Annual Report — FY2023
- SEC 10-K Annual Report — FY2022
Data sourced from Yahoo Finance and SEC EDGAR. Not investment advice.
Leave a Comment