
| Company | Jul 25 | Aug 25 | Sep 25 | Oct 25 | Nov 25 | Dec 25 | Jan 26 | Feb 26 | Mar 26 | Apr 26 | May 26 | Jun 26 | 12-Mo |
|---|---|---|---|---|---|---|---|---|---|---|---|---|---|
| KRP | +7% | -3% | -3% | -2% | -4% | -6% | +14% | +7% | +4% | +6% | +0% | -3% | +16% |
| VNOM | -1% | +7% | -4% | -2% | -1% | +6% | +10% | +10% | +2% | +5% | -7% | -7% | +18% |
| BSM | -4% | -1% | +8% | +0% | +9% | -5% | +11% | +4% | +0% | -5% | -3% | +3% | +17% |
| TPL | -8% | -4% | +0% | +1% | -8% | -0% | +21% | +51% | -9% | -7% | -11% | +12% | +25% |
| NRP | +7% | +2% | +1% | -1% | +2% | -1% | +9% | +7% | +0% | -2% | -11% | -7% | +5% |
| DMLP | -2% | -6% | +3% | -2% | -11% | +2% | +14% | +5% | +4% | +3% | -2% | -7% | -0% |
Source: Yahoo Finance monthly adjusted close.
Executive Summary
Rating: HOLD | KRP
Measured from adjusted close on 2026-07-17 to 2026-10-16. Sell ratings are correct when the stock falls; Hold is tracked as a +/-10% range. Daily-close data, not intraday. Calls are tracked for 182 days from publication, then frozen as a final record.
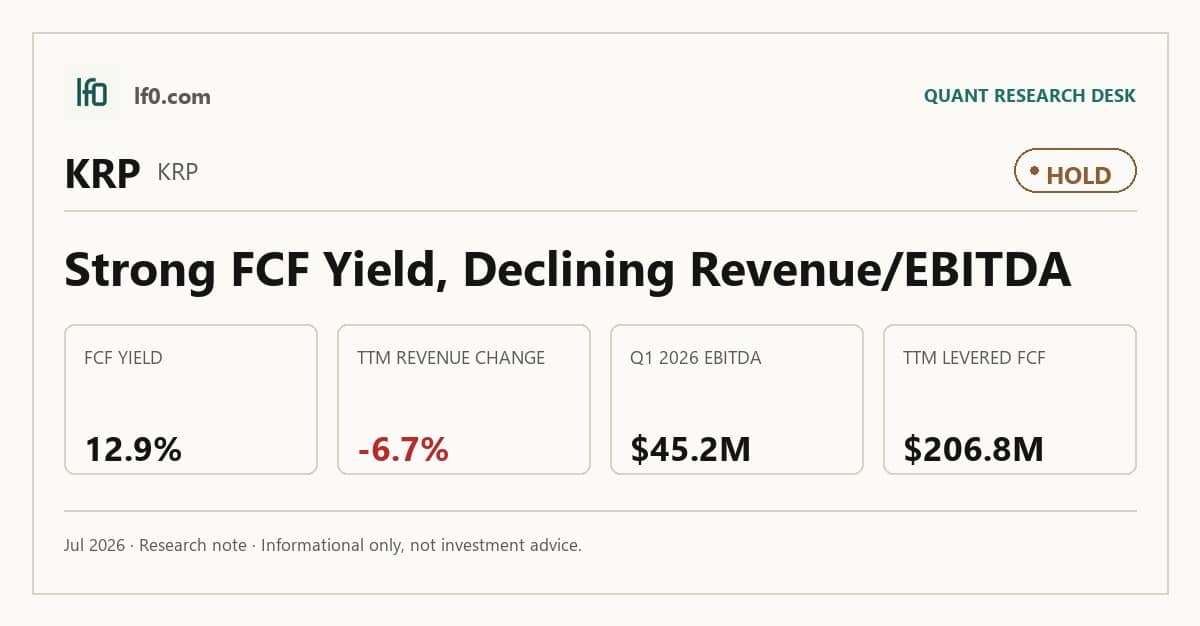
I would put my rating as a Hold because Kimbell Royalty Partners LP combines a structurally attractive royalty model with a recent step down in operating momentum, so the thesis is still intact but not yet strong enough for a higher call. The partnership’s edge is simple: it collects royalty income from acreage it does not have to drill, fund, or operate, which gives it a cost structure that is hard to replicate quickly. What keeps me cautious is that Q1 2026 EBITDA fell to $45.2M from $64.6M in Q4 2025, and that kind of swing tells me the cash stream is still exposed to commodity pricing and operator activity. I would raise my rating more towards a Buy if quarterly EBITDA moves back above $60M, because that would show the latest drop was a temporary reset rather than the new baseline.
Company Profile
Kimbell Royalty Partners LP is a Delaware limited partnership formed in 2015 to own and acquire mineral and royalty interests in oil and natural gas properties across the United States. It earns revenue from royalty payments on oil, natural gas and natural gas liquids production, net of post-production expenses and taxes, and it does not fund drilling, completion, lease operating or plugging and abandonment costs. The partnership went public in 2017 and elected to be taxed as a corporation for U.S. federal income tax purposes. As of December 31, 2025, it owned interests in approximately 123.0 million gross acres plus 4.7 million gross acres of overriding royalty interests across 28 states and every major onshore basin, with 54.0% of aggregate acres in the Permian Basin and Mid Continent. It is listed on the New York Stock Exchange under KRP and had $441.5M of borrowings outstanding under its $625M secured revolving credit facility.
Economic Moat
Business Model
The royalty stream is the hard-to-replicate part of the model. Kimbell receives a cost-free share of oil, natural gas and associated NGLs from acreage it does not have to drill, complete, operate or plug, so a well-funded competitor would need to buy a similar mineral position to copy the economics. In my view, that is the strongest structural feature because the company is paid as operators develop the acreage while it avoids the capital burden and operating risk that usually destroy returns in upstream energy. Secondary support comes from breadth and lease status: as of December 31, 2025, Kimbell owned mineral and royalty interests in approximately 123 million gross acres and overriding royalty interests in approximately 4.7 million gross acres, with over 99.0% of the acreage subject to its mineral and royalty interests leased and substantially all of those leases held by production. The portfolio also spans 28 states and every major onshore basin across the continental United States, including over 133,000 gross wells and over 53,000 wells in the Permian Basin, so the cash stream is diversified across many operators and basins rather than tied to one field. I also view the sponsor relationship as a practical sourcing edge, because the partnership has a right to participate in up to 50.0% of certain acquisitions tied to diligence work by its founders.
Five years ago, the business was already a royalty owner, but the footprint was much smaller and more concentrated. By 2024, the MB Minerals acquisition had added another asset package, and by 2025 the portfolio had broadened into the 123 million gross acre and 4.7 million gross acre platform disclosed today. That expansion means the model has moved from a deal-by-deal acreage builder to a much larger, basin-diversified royalty platform with more wells, more operators and more organic development optionality. The business is structurally stronger than it was five years ago because the asset base is larger, more leased and more diversified, even though the same dependence on third-party operators and commodity prices still limits control over the outcome. This is a bull signal for the investment thesis because the company now has more cost-free production exposure without adding operating intensity.
Business & Operating Risks
The most material disclosed risk is commodity price volatility, because all of Kimbell Royalty Partners’ revenue comes from royalty payments tied to the sale price of oil, natural gas and NGLs, and the 10-K says any substantial decline or prolonged period of low commodity prices would materially affect cash available for distribution. That is not abstract for this partnership: WTI was $57.3 per Bbl on December 31, 2025 and $62.5 per Bbl on February 17, 2026, while Henry Hub was $4.0 per MMBtu and then $3.1 per MMBtu over the same dates, so a weaker gas tape can hit distributable cash quickly. The second risk is operator dependence, which is more specific than generic competition because Kimbell receives revenue from approximately 1,300 operators and got about 47.1% of 2025 revenue from the top ten purchasers, with the top purchaser alone contributing 7.7% of revenue. The filing also warns that operators may drill fewer wells than expected, suspend production or file bankruptcy, and that royalty payments can be placed in suspense if title or ownership documentation is not satisfactory. Leverage and covenant pressure are the third major risk: the secured revolving credit facility has commitments up to $625M, requires a debt to EBITDAX ratio of not more than 3.5x and restricts distributions if that ratio exceeds 3.0x on a trailing twelve-month basis. In plain terms, if commodity prices weaken and EBITDAX falls, Kimbell can lose distribution flexibility exactly when unitholders would want it most. The disclosed risks do not directly threaten the royalty moat itself, but they do threaten the cash conversion that makes that moat valuable.
The risk profile has changed meaningfully over the last five years. In 2022, the 10-K still led with COVID-19 disruption and office-style operational restrictions, but that language has disappeared by 2026, which shows the company has moved past pandemic-specific risk. By contrast, the current filing adds much more explicit language around climate policy, the February 2026 EPA rescission of the 2009 Endangerment Finding, tariffs and cyber-attacks, all of which were far less prominent in earlier filings. The current filing also quantifies reserve decline more clearly, saying proved developed producing reserves have an average estimated yearly five-year decline rate of 13.5%, which is a sharper reminder that this is a depleting-asset business. One risk that has already materialized is impairment pressure: the company recorded $62.1M of oil and natural gas property impairment in 2024 and $18.2M in 2023, so the write-down language is no longer hypothetical.
Management Discussion & Analysis
Management is responding to the disclosed risks by extending liquidity and keeping leverage in check, but it is not eliminating commodity dependence. The Second Amended and Restated Credit Agreement, a revised reserve-based revolving credit facility, lifts the maximum principal amount to $1.5B, sets an initial borrowing base of $625M and pushes maturity to December 16, 2030, which tells me refinancing risk has been deferred rather than removed. The board also approved a quarterly cash distribution of $0.37 per common unit and allocated 25.0% of fourth-quarter 2025 available cash to repay $13.4M of revolver borrowings, so management is prioritizing a modest payout while still using cash to reduce leverage. That stance is consistent with the 2025 equity offering, which raised net proceeds of approximately 163.6M and helped fund the Boren acquisition, while the Boren acquisition itself consumed approximately $222.8M of capital in 2025. The gap in the narrative is that management frames acquisitions as accretive over the long term, yet 2025 interest expense rose to $34.5M from $26.7M in 2024 because of additional borrowings, so investors should not read the acquisition program as self-funding until cash flow clearly outpaces financing costs. The operating data support the idea that the portfolio is still expanding, with 2025 production of 9,402,348 Boe and 2025 oil, natural gas and NGL revenues of $317.5M, but the company is still leaning on commodity exposure and deal flow rather than a visible internal growth engine.
Management’s track record is mixed rather than cleanly reliable. In 2024’s 10-K, management said acquisitions would be an important part of growth and that they could be funded with cash, equity, borrowings or debt securities; 2025 confirmed that pattern through the Boren acquisition, the 2025 equity offering and heavier revolver use, so the financing playbook matched the prior narrative. By contrast, prior filings also emphasized that acquisitions would be accretive over the long term, but 2025 net income attributable to common units was $56M versus a loss of $8.8M in 2024, while interest expense climbed to $34.5M and the company still relied on a full valuation allowance on deferred tax assets. The CEO and CFO names appear unchanged in the provided filings, and the 2026 filing does not flag a leadership transition, which is a positive for continuity. Tone has generally stayed upbeat even through the 2024 impairment of $62.1M and the 2023 impairment of $18.2M, so I see a pattern of management leaning on acquisition-led optimism while the numbers remain highly exposed to commodity prices and financing costs.
Recent Events
The most significant development is the May 18, 2026 acquisition agreement for Mesa Visa Royalties, which adds mineral and royalty interests across the Delaware and Midland basins and is expected to close in Q2 2026 with a June 1, 2026 effective date. In my view, that strengthens Kimbell’s acreage footprint and extends its royalty base, which supports the structural advantage of owning diversified, low-operating-cost mineral interests rather than drilling capital itself.
The deal is also partly equity financed, with about 44M of cash and 6.9 million OpCo Common Units plus matching Class B Units issued to the sellers. I read that as disciplined but not free, because it preserves liquidity while still diluting existing holders, so the thesis improves only if the acquired reserves and undeveloped locations convert into durable production.
A second positive signal is the March 6, 2026 authorization of a $100M unit repurchase program, which runs through December 31, 2027. That tells me management is willing to recycle cash into the equity when it sees value, which is supportive for per-unit returns if commodity cash flows stay firm. The February 26, 2026 and May 7, 2026 filings were routine results updates, so the net 8-K signal is modestly constructive.
Financial Analysis
Growth
KRP — Financial Growth (Quarterly, USD Mil)
| Metric | 2025-03-31 | 2025-06-30 | 2025-09-30 | 2025-12-31 | 2026-03-31 |
|---|---|---|---|---|---|
| REVENUE (USD Mil) | 90.3 | 77.2 | 77.2 | 77.1 | 84.2 |
| EBITDA (USD Mil) | 64.8 | 68.3 | 60 | 64.6 | 45.2 |
| DILUTED EPS | 0.2 | 0 | 0.2 | 0.2 | 0 |
Source: Yahoo Finance — Quarterly Financial Statements
KRP’s revenue was $84.2M in Q1 2026, up 9.1% from $77.1M in Q1 2025, after a flat stretch in Q2 2025 to Q4 2025 at $77.2M, $77.2M and $77.1M. EBITDA moved less cleanly: it peaked at $68.3M in Q2 2025, slipped to $60M in Q3 2025 and $64.6M in Q4 2025, then fell to $45.2M in Q1 2026, so earnings are growing slower than revenue. I do not see a clean explanation for that latest step down in the figures shown here, which is worth flagging because the royalty model should normally convert commodity support into steadier cash generation. Growth is the weak spot in the thesis: revenue is still rising, but the latest quarter shows weaker operating conversion and less durable near-term momentum.
Profitability
KRP — Profitability (TTM)
| Metric | TTM |
|---|---|
| Operating Margin (TTM) | 18.8% |
| Net Margin (TTM) | 23.6% |
| Return on Assets (TTM) | 5.7% |
| Return on Equity (TTM) | 9.3% |
| Gross Margin (TTM) | 93.4% |
| EBITDA Margin (TTM) | 75.3% |
Source: Yahoo Finance — Trailing Twelve Months (TTM)
TTM gross margin was 93.4%, EBITDA margin was 75.3%, operating margin was 18.8% and net margin was 23.6%. The spread between gross and operating margin is wide, which tells me the core royalty revenue is highly efficient but the business still carries a meaningful layer of overhead and non-cash charges before earnings reach the bottom line. EBITDA margin staying far above operating margin also shows depreciation and amortization are material, so investors should weight cash generation more than accounting earnings here. ROA was 5.71% and ROE was 9.32%, a gap that suggests returns are helped by leverage rather than driven only by asset productivity. The company is profitable on a GAAP basis, but the latest quarterly earnings growth of -79.9% points to pressure rather than acceleration, so I would watch for operating margin and net margin to hold above their current TTM levels before calling the trend durable. This is a bear-leaning profitability profile because margins are positive, but the sharp earnings swing shows the path is not yet steady.
Valuation
KRP — Valuation Multiples
| Metric | Value |
|---|---|
| Market Cap (USD Mil) | 1,602 |
| Enterprise Value (USD Mil) | 2,075 |
| Trailing P/E | 32.3 |
| Forward P/E | 17.3 |
| Price/Sales (TTM) | 5.1 |
| Price/Book (mrq) | 2.8 |
| EV/Revenue | 6.6 |
| EV/EBITDA | 8.7 |
| Beta (5Y Monthly) | 0.28 |
| FCF Yield % (TTM) | 12.9% |
| Forward EPS (USD) | 0.9 |
| Analyst Target Price – Low (USD) | 16 |
| Analyst Target Price – Mean (USD) | 19 |
| Analyst Target Price – High (USD) | 23 |
| # Analyst Opinions | 5 |
Source: Yahoo Finance
Kimbell Royalty Partners LP screens as a cash-yield and income vehicle first, so the most decision-relevant anchor is FCF yield. Its FCF yield is 12.9%, which tells me the market is paying about 7.7x levered free cash flow for a royalty stream that is already converting 65.5% of revenue into free cash flow over the last year. That is not a distressed multiple, but it is also not a bargain if cash flow proves cyclical. The rest of the stack is mixed. Trailing P/E is 32.3x, while forward P/E falls to 17.3x on forward EPS of 0.86, so the market is pricing in a sharp earnings normalization rather than a flat run rate. Price/Sales is 5.07x and EV/Revenue is 6.57x, both rich for a royalty business unless investors expect sustained commodity support and high-margin production visibility. EV/EBITDA is 8.73x, which is reasonable only if EBITDA holds near current levels. Price/Book is 2.82x, and with book value per share of 5.263 against a derived share price of about $16.2, the stock trades at roughly 3.1x book, so buyers are paying well above asset value for cash flow durability. PEG ratio is 2.55x, which suggests the growth outlook is not cheap. On the analysis here, I would put fair value in a range of $16–$23, which sits inside the 5 covering firms; that tells me the market and the sell side are broadly aligned, even if I weight the slower growth profile a bit more heavily than the consensus appears to. The implied forward EPS range is roughly 0.86, which is close to the company’s own 0.86 and below the richer earnings power implied by peers such as TPL, so the stock is not being priced as if it has peer-leading earnings leverage. I see the valuation as neutral to slightly bear because the cash yield is attractive, but the multiple already gives credit for that durability.
Leverage
KRP — Leverage & Coverage (Quarterly)
| Metric | Value |
|---|---|
| Total Debt/Equity % (mrq) | 61.1 |
| Current Ratio (mrq) | 5.1 |
| Total Debt (mrq, USD Mil) | 445.6 |
| Operating Cash Flow (TTM, USD Mil) | 241.7 |
| Levered Free Cash Flow (TTM, USD Mil) | 206.7 |
| Net Debt/EBITDA (TTM) | 1.7 |
| FCF Margin % (TTM) | 65.5% |
Source: Yahoo Finance — Quarterly Financial Statements
Kimbell Royalty Partners LP has moderate leverage and solid liquidity. Total debt/equity was 61.13%, current ratio was 5.117 and total debt was $445.6M, so the balance sheet is not stretched and near-term liquidity looks comfortable. Operating cash flow was $241.7M and levered free cash flow was $206.7M, which shows strong cash conversion rather than EBITDA being trapped in working capital or capex. Net debt/EBITDA was 1.717x and FCF margin was 65.49%, both of which point to ample financial flexibility and a good ability to fund distributions without leaning on debt markets. I would not call this a fortress balance sheet, but it is strong enough that the leverage risk only becomes a real issue if commodity cash flows weaken sharply or a maturity window opens with materially higher rates. Overall, this is a bull signal for the balance sheet and cash flow profile, and it is the main reason the stock can absorb a weaker growth print without breaking the thesis.
Insider Activity
| Date | Insider | Role | Type | Shares | Price |
|---|---|---|---|---|---|
| 2026-03-23 | Rhynsburger Blayne | Controller | S | 6,609 | $14.5 |
| 2026-03-02 | Wynne Mitch S. | Director | S | 35,000 | $14.5 |
The insider transaction record I see here is one-sided: 0 open-market purchases and 5 open-market sales in the 2025-02-25 to 2026-03-23 window, so insiders were net sellers. The selling is not broad across many names in the open-market data, but it is enough to show no voluntary buying support, which weakens alignment with shareholders at the margin. Bear signal.
Comparable Analysis
Growth
| Company | Revenue TTM (USD Mil) | Revenue Growth YoY % | Diluted EPS TTM |
|---|---|---|---|
| KRP | 315.7 | -6.7% | 0.5 |
| VNOM | 1,578 | 109.1% | -0.6 |
| BSM | 410.2 | 8.5% | 1.3 |
| TPL | 839 | 20.8% | 7.3 |
| NRP | 193.8 | -15.3% | 8.5 |
| DMLP | 162.7 | 36.4% | 1.4 |
Source: Yahoo Finance
KRP’s revenue fell 6.7% TTM, while VNOM grew 109.1%, DMLP 36.4%, TPL 20.8%, BSM 8.5% and NRP declined 15.3%. That gap says KRP is not being rewarded for growth leadership, so any valuation premium has to come from cash generation and balance-sheet quality rather than top-line acceleration.
Valuation
| Company | Trailing P/E | Forward P/E | EV/Revenue | EV/EBITDA | Price/Sales (TTM) | Price/Book (mrq) | Market Cap (USD Mil) | Enterprise Value (USD Mil) | FCF Yield % (TTM) | Forward EPS | Analyst Target Price – Low | Analyst Target Price – Mean | Analyst Target Price – High | # Analyst Opinions |
|---|---|---|---|---|---|---|---|---|---|---|---|---|---|---|
| KRP | 32.3 | 17.3 | 6.6 | 8.7 | 5.1 | 2.8 | 1,602 | 2,075 | 12.9% | 0.9 | 16 | 19 | 23 | 5 |
| VNOM | — | 18.3 | 9.7 | 10.2 | 10.1 | 1.7 | 15,951 | 15,383 | -6.6% | 2.4 | 46 | 57.1 | 65 | 18 |
| BSM | 11.3 | 12.3 | 8.6 | 10.1 | 7.4 | 4 | 3,056 | 3,515 | 3.1% | 1.2 | 16 | 16 | 16 | 1 |
| TPL | 56.6 | 5.6 | 33.9 | 41.2 | 33.9 | 18.3 | 28,429 | 28,467 | -0.2% | 73.1 | 248 | 443.5 | 639 | 2 |
| NRP | 11.4 | 32.3 | 6.9 | 9 | 6.6 | 2.1 | 1,283 | 1,340 | 9.3% | 3 | — | — | — | — |
| DMLP | 19.6 | — | 7.8 | 9.2 | 8.1 | 4.4 | 1,314 | 1,276 | 7.1% | — | — | — | — | — |
Source: Yahoo Finance
KRP’s FCF yield is 12.9%, ahead of NRP’s 9.3%, DMLP’s 7.1%, BSM’s 3.1% and far above VNOM’s -6.6% and TPL’s -0.2%. KRP also trades at 6.6x EV/Revenue and 8.7x EV/EBITDA, versus VNOM at 9.7x and 10.2x, BSM at 8.6x and 10.1x, DMLP at 7.8x and 9.2x, NRP at 6.9x and 9.0x and TPL at 33.9x and 41.2x; on that basis, KRP looks cheaper than the growth leaders but not as cheap as its own 12.9% FCF yield suggests. Using peer EV/Revenue of 6.9x to 9.8x on KRP’s $315.7M revenue implies enterprise value of $2.2B to $3.1B, or about $17.7 to $27.0 per share after netting $445.6M of debt and $37.2M of cash and dividing by 98.7M shares, which brackets the current price and says the market is already giving some credit for cash flow. The reason I do not give KRP more credit on the multiple is that its leverage is still higher than the cleaner peers, so the valuation gap is not just about growth.
Profitability
| Company | Operating Margin (TTM) | Net Margin (TTM) | Return on Assets (TTM) | Return on Equity (TTM) | EBITDA Margin (TTM) |
|---|---|---|---|---|---|
| KRP | 18.8% | 23.6% | 5.7% | 9.3% | 75.3% |
| VNOM | 55.9% | -2.9% | 5.2% | -1.8% | 95.2% |
| BSM | 14.2% | 72.5% | 14.9% | 27.8% | 84.6% |
| TPL | 77.2% | 60.0% | 25.2% | 36.5% | 82.3% |
| NRP | 60.2% | 58.5% | 10.5% | 19.3% | 76.5% |
| DMLP | 49.5% | 40.9% | 13.2% | 21.5% | 85.6% |
Source: Yahoo Finance
KRP’s 93.4% gross margin and 75.3% EBITDA margin are below VNOM’s 100.0% and 95.2%, but above BSM’s 88.3% and 84.6%, DMLP’s 93.8% and 85.6%, NRP’s 88.0% and 76.5% and TPL’s 93.2% and 82.3%. The narrower gap at operating margin, where KRP is 18.8% versus VNOM’s 55.9%, BSM’s 14.2%, DMLP’s 49.5%, NRP’s 60.2% and TPL’s 77.2%, points to a scale and overhead disadvantage rather than a cost-of-revenue problem. ROE of 9.3% and ROA of 5.7% trail the stronger peers, which tells me KRP is profitable but not converting capital into returns as efficiently as the best names.
Leverage
| Company | Total Debt/Equity % (mrq) | Current Ratio (mrq) | Total Debt (mrq, USD Mil) | Operating Cash Flow TTM (USD Mil) | Free Cash Flow TTM (USD Mil) | Net Debt/EBITDA (TTM) | FCF Margin % (TTM) |
|---|---|---|---|---|---|---|---|
| KRP | 61.1 | 5.1 | 445.6 | 241.7 | 206.8 | 1.7 | 65.5% |
| VNOM | 15.5 | 6.2 | 1,603 | 1,180 | -1,046.6 | 1 | -66.3% |
| BSM | 17.4 | 2.3 | 187 | 307.9 | 95.5 | 0.5 | 23.3% |
| TPL | 1.2 | 4.2 | 18 | 551.2 | -56.1 | -0.3 | -6.7% |
| NRP | 10.1 | 2.1 | 63.7 | 164.4 | 119.7 | 0.2 | 61.8% |
| DMLP | 0.2 | 16.6 | 0.7 | 123 | 93.6 | -0.2 | 57.5% |
Source: Yahoo Finance
KRP’s debt/equity is 61.1% and net debt/EBITDA is 1.7x, versus VNOM at 15.5% and 1.0x, BSM at 17.4% and 0.5x, NRP at 10.1% and 0.2x and DMLP at 0.2% and net cash. KRP’s 65.5% FCF margin is stronger than VNOM’s -66.3% and BSM’s 23.3%, but the balance sheet is still more levered than the cleaner peers, so the stock deserves some discount to the least levered names even if the cash conversion is excellent. That leverage gap matters less than it would for a lower-margin business, because KRP’s royalty model throws off cash, but it still limits how much of the cash yield should be treated as permanent.
Conclusion
I would put my rating as a Hold because the key tension is between a durable royalty moat and a Q1 2026 earnings step down that has not yet been fully explained in the numbers. The asset base is still doing what it should: Kimbell collects royalty income without funding drilling or operating costs, and that structure is hard to copy quickly. But the latest quarter’s EBITDA of $45.2M, down from $64.6M in Q4 2025, tells me the cash stream is still sensitive to commodity pricing and operator activity, so I do not want to pay up as if the business has already de-risked.
I would raise my rating more towards a Buy if quarterly EBITDA moves back above $60M, because that would show the Q1 2026 dip was temporary and would put the business back near the Q2 2025 to Q4 2025 range. If that happens while net debt stays near 1.7x EBITDA, the distribution looks safer and the 12.9% FCF yield would start to look more like underappreciated cash durability than a cyclical warning. I would move from Hold to Sell if quarterly EBITDA falls below $45M for more than one quarter, because that would suggest the royalty stream is not cushioning price volatility as well as the current valuation assumes. The bigger downside trigger is leverage pressure: if net debt/EBITDA moves materially above 2.0x, the revolver covenant and distribution limits become more binding, and the payout path would tighten just as investors need flexibility most.
Weighing both sides, I still lean Hold because the royalty asset base is intact and the balance sheet at 1.7x net debt/EBITDA gives Kimbell enough room to absorb normal commodity swings. What keeps me from moving to Buy is that the latest earnings step down came before any clear evidence of a reacceleration, so I want one more quarter of stable EBITDA before giving the stock more credit.
What’s your take? I rated Kimbell Royalty Partners (KRP) HOLD above — but the goal here is to get this right, not just to publish an opinion. What would you add to this analysis, or which risk or catalyst do you think I’m under- or over-weighting? Tell me in the comments.
Sources
- SEC 10-K Annual Report — filed 2026-02-26
- SEC 8-K Filing (2026-05-19)
- SEC 8-K Filing (2026-05-07)
- SEC 8-K Filing (2026-03-09)
- SEC 8-K Filing (2026-02-26)
- SEC Form 4 Insider Transaction (2026-03-24)
- SEC Form 4 Insider Transaction (2026-03-05)
- SEC Form 4 Insider Transaction (2026-03-05)
- SEC 10-K Annual Report — FY2026
- SEC 10-K Annual Report — FY2025
- SEC 10-K Annual Report — FY2024
- SEC 10-K Annual Report — FY2023
- SEC 10-K Annual Report — FY2022
Data sourced from Yahoo Finance and SEC EDGAR. Not investment advice.
Leave a Comment