
| Company | Jul 25 | Aug 25 | Sep 25 | Oct 25 | Nov 25 | Dec 25 | Jan 26 | Feb 26 | Mar 26 | Apr 26 | May 26 | Jun 26 | 12-Mo |
|---|---|---|---|---|---|---|---|---|---|---|---|---|---|
| SANM | +19% | +1% | -2% | +19% | +14% | -4% | -6% | +10% | -17% | +68% | +19% | -3% | +159% |
| JBL | +2% | -8% | +6% | +2% | -5% | +8% | +4% | +12% | +0% | +27% | +8% | +6% | +77% |
| FLEX | -0% | +8% | +8% | +8% | -5% | +2% | +4% | -0% | +4% | +40% | +65% | +7% | +225% |
| PLXS | -6% | +7% | +6% | -3% | +2% | +3% | +36% | -3% | +4% | +24% | +7% | +12% | +122% |
| CLS | +28% | -3% | +27% | +40% | -0% | -14% | -5% | -1% | +1% | +45% | -6% | -5% | +134% |
| TTMI | +16% | -6% | +29% | +17% | +4% | -2% | +42% | +6% | -7% | +62% | +10% | +8% | +358% |
Source: Yahoo Finance monthly adjusted close.
Executive Summary
Rating: HOLD | SANM
Measured from adjusted close on 2026-07-16 to 2026-10-14. Sell ratings are correct when the stock falls; Hold is tracked as a +/-10% range. Daily-close data, not intraday. Calls are tracked for 182 days from publication, then frozen as a final record.
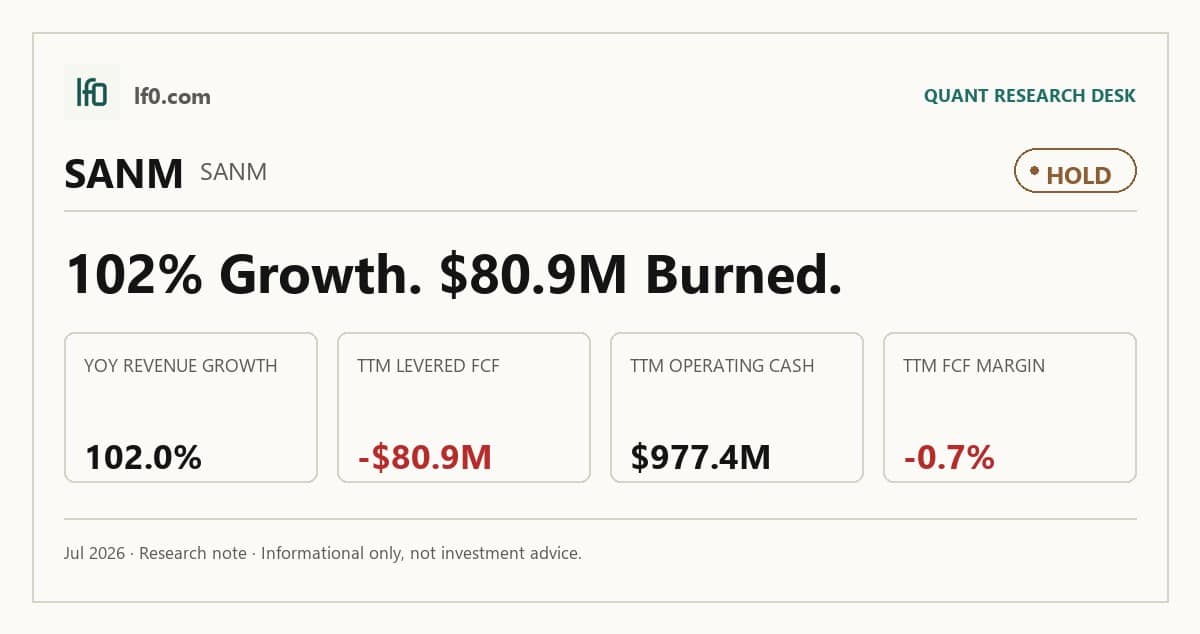
I would put my rating as a Hold because Sanmina’s revenue growth is real, but the company is still not turning that scale into durable free cash flow. Q1 2026 revenue reached $4B, up 102.2% year over year, yet levered free cash flow remained negative at $80.9M TTM and FCF margin was -0.7%, so the rerating case is still ahead of the cash conversion case. In my view, the key question is whether the higher-value mix can lift EBITDA margin from 6.7% TTM toward 8.0% or better; that would be the first sign that growth is becoming self-funding rather than just larger.
Company Profile
Sanmina Corp. is a global electronics manufacturing services provider that earns revenue from integrated manufacturing solutions, components, products, repair, logistics, and aftermarket services for original equipment manufacturers. Integrated Manufacturing Solutions generated about 80% of fiscal 2024 revenue through printed circuit board assembly, high-level assembly, and direct order fulfillment, while Components, Products and Services generated about 20% through advanced printed circuit boards, optical and radio frequency products, storage platforms, defense systems, and 42Q cloud manufacturing software.
Founded in 1980, Sanmina is headquartered in San Jose, California and listed on Nasdaq under SANM. It serves industrial, medical, defense and aerospace, automotive, communications networks, and cloud infrastructure customers across 21 countries on four continents. The company’s major OEM supply agreements typically run 3 to 5 years, which gives it a recurring-program base, but those contracts generally do not require minimum volumes.
Economic Moat
Business Model
The most defensible part of Sanmina’s model is its end-to-end manufacturing stack. It combines product design and engineering, component manufacturing, high-level assembly and test, direct order fulfillment, logistics, and after-market support in one operating model. In my view, that breadth is hard to replicate within 3 years because a competitor would need to rebuild customer engineering relationships, qualify factories across regions, and assemble the same supply-chain and regulatory capabilities across industrial, medical, defense and aerospace, automotive, and communications networks.
Sanmina also has a second layer of advantage in its vertically integrated component set, including printed circuit boards, backplanes, cable assemblies, precision machined parts, optical, RF, and microelectronics modules. Its global supply-chain management system runs on a single enterprise resource planning platform at substantially all manufacturing locations, which gives customers traceability across the product life cycle. That matters because it lets Sanmina sell more content per program and keep switching costs high once a customer has qualified the platform.
The business has become more specialized over time. The footprint is still 21 countries, but the portfolio is now more explicitly tied to mission-critical, regulated end markets, and the higher-value CPS businesses have moved Sanmina beyond pure assembly into design, proprietary components, storage, defense, and cloud-based manufacturing software. I feel that this evolution strengthens the moat because the company is following technology content upward rather than staying in low-complexity work.
Business & Operating Risks
The biggest disclosed risk is customer concentration and end-market cyclicality. Sales to the ten largest customers have historically represented approximately half of net sales, and the company realizes a substantial portion of revenue from communications equipment customers. A loss of, or pricing pressure from, any one of those large accounts could substantially reduce revenue and net income, and the 2024 demand reset in communications equipment shows that risk is already visible in results.
Supply-chain fragility is the second major overhang. Shortages of capacitors, resistors, and discrete semiconductors, along with dependence on a limited number of sole-source suppliers, can delay shipments, raise inventories, and reduce operating cash flow. Tariffs on components imported from China and on products manufactured in China and then imported into the U.S. add another layer of margin pressure if customers do not absorb the cost.
International operations and regulatory exposure also matter because the substantial majority of net sales come from non-U.S. operations. The filing names China, India, Israel, Malaysia, Mexico, and Thailand as countries where the company has already experienced work stoppages and similar disruptions, while the defense business adds export-control, government-contracting, and anti-corruption exposure. The risks do not directly break the moat, but they do test the operating discipline that the end-to-end model depends on.
Management Discussion & Analysis
Management is responding to those risks with capital discipline and a push toward higher-value manufacturing. The company repurchased $254M of common stock in 2024, ended the year with $626M of cash and $786M available under its revolving credit facility, and repaid only $22M of long-term debt. That tells me the board is preserving flexibility rather than forcing a balance-sheet repair.
At the same time, management continues to invest in factory automation, process improvements, robotics, and artificial intelligence. The problem is that the 2024 numbers only partly support that narrative: net sales fell 15.3% to $7.6B as communications-network customers absorbed finished-goods inventory, while gross margin improved only to 8.5% from 8.3%. The strategy is directionally right, but the operating results still show that inventory digestion and end-market weakness are overpowering the efficiency push.
The Indian joint venture, Sanmina SCI India Private Limited, remains strategically important because its $200M cash balance is not available for general corporate purposes. That limits the amount of liquidity investors should mentally assign to the parent, even though the consolidated balance sheet looks comfortable.
Recent Events
The most important governance change was the October 23, 2024 bylaw amendment, disclosed on October 29, 2024, which raised the threshold for shareholders to force a special meeting to an aggregate net long position of at least 50% of voting power. In my view, that strengthens management’s control over the agenda and makes activist pressure harder to organize, which slightly weakens the governance case for outside holders.
The December 9, 2024 approval of the fiscal 2025 Corporate Bonus Plan, disclosed on December 12, 2024, is more constructive. The plan ties incentive pay to revenue, non-GAAP operating margin, and cash flow from operations, with no payout if minimum performance is missed, so it aligns management with the same metrics investors care about.
The November 29, 2024 controller transition, effective December 2, 2024, looks like a planned handoff rather than disruption. Vishnu Gangaswamy Venkatesh replacing Brent Billinger as Global Controller and Chief Accounting Officer leaves the investment case materially unchanged.
Financial Analysis
Growth
SANM — Financial Growth (Quarterly, USD Mil)
| Metric | 2025-03-31 | 2025-06-30 | 2025-09-30 | 2025-12-31 | 2026-03-31 |
|---|---|---|---|---|---|
| REVENUE (USD Mil) | 1,984.1 | 2,041.6 | 2,096.4 | 3,189.7 | 4,013.3 |
| EBIT (USD Mil) | 93.4 | 96.4 | 78.5 | 86.3 | 163.3 |
| EBITDA (USD Mil) | 121.6 | 126.2 | 108.2 | 125.8 | 210.4 |
| NET INCOME (USD Mil) | 64.2 | 68.6 | 48.1 | 49.3 | 93.6 |
| DILUTED EPS | 1.2 | 1.3 | 0.9 | 0.9 | 1.7 |
Source: Yahoo Finance — Quarterly Financial Statements
Revenue rose from $2B in Q1 2025 to $4B in Q1 2026, up 102.2% year over year, after a steady build through the middle of the year and then a sharp step-up in late 2025. EBITDA increased to $210.4M from $121.6M a year earlier, so the business is growing faster at the top line than at the cash-earnings line. That gap matters because it tells me the current growth is real, but not yet fully converting into operating leverage.
Net income reached $93.6M in Q1 2026 and diluted EPS was 1.7, both well above the prior-year quarter. The step-up is encouraging, but I would want to see it persist for more than one quarter before treating it as a new run rate.
Profitability
SANM — Profitability (TTM)
| Metric | TTM |
|---|---|
| Operating Margin (TTM) | 5.7% |
| Net Margin (TTM) | 2.3% |
| Return on Assets (TTM) | 4.8% |
| Return on Equity (TTM) | 11.0% |
| Gross Margin (TTM) | 8.5% |
| EBITDA Margin (TTM) | 6.7% |
Source: Yahoo Finance — Trailing Twelve Months (TTM)
TTM operating margin was 5.7%, gross margin was 8.5%, and EBITDA margin was 6.7%, which shows Sanmina is profitable but still running on thin spreads. The 3.2-point gap between gross margin and operating margin points to a lean cost structure rather than strong pricing power. Net margin was 2.3%, so below-the-line items still absorb most of the profit.
Return on assets was 4.8% TTM and return on equity was 11.0%, which is acceptable but not exceptional. The ROE-to-ROA spread suggests leverage is helping equity returns more than operating efficiency is, and that is consistent with the modest margin profile above.
Valuation
SANM — Valuation Multiples
| Metric | Value |
|---|---|
| Market Cap (USD Mil) | 11,112 |
| Enterprise Value (USD Mil) | 12,142 |
| Trailing P/E | 44 |
| Forward P/E | 15.9 |
| Price/Sales (TTM) | 1 |
| Price/Book (mrq) | 4.6 |
| EV/Revenue | 1.1 |
| EV/EBITDA | 16.1 |
| Beta (5Y Monthly) | 1.56 |
| FCF Yield % (TTM) | -0.7% |
| Forward EPS (USD) | 13 |
| Analyst Target Price – Low (USD) | 185 |
| Analyst Target Price – Mean (USD) | 223.8 |
| Analyst Target Price – High (USD) | 280 |
| # Analyst Opinions | 4 |
Source: Yahoo Finance
Sanmina trades at 1.1x EV/revenue and 16.1x EV/EBITDA, with a forward P/E of 15.9x and a trailing P/E of 44x. On the analysis here, I would put fair value in a range of $185–$280, which is the same as the current analyst target band, so I am not fighting consensus on the equity value itself. What I do disagree with is the implied quality of the earnings stream: the market is paying for a cleaner FY2026 profit profile than the cash flow data yet supports.
Forward EPS is $13, and that implies the current multiple is anchored to a meaningful earnings recovery rather than a depressed base. I would describe that as fair to slightly rich on cash conversion, because the stock is not expensive on sales, but it is not cheap enough on free cash flow to call it a clear bargain. The valuation case is therefore tied to margin expansion, not just revenue growth.
Leverage
SANM — Leverage & Coverage (Quarterly)
| Metric | Value |
|---|---|
| Total Debt/Equity % (mrq) | 92.7 |
| Current Ratio (mrq) | 1.7 |
| Total Debt (mrq, USD Mil) | 2,419.9 |
| Operating Cash Flow (TTM, USD Mil) | 977.3 |
| Levered Free Cash Flow (TTM, USD Mil) | -80.9 |
| Net Debt/EBITDA (TTM) | 1.1 |
| FCF Margin % (TTM) | -0.7% |
Source: Yahoo Finance — Quarterly Financial Statements
Total debt was $2.4B mrq and total debt/equity was 92.7%, while the current ratio was 1.7. That is manageable, but it is not a balance sheet with much excess flexibility. Operating cash flow was $977.3M TTM, yet levered free cash flow was negative $80.9M and FCF margin was -0.7%, so capex and working capital are still absorbing the earnings lift.
Net debt/EBITDA was 1.1x, which keeps refinancing risk contained for now. The issue is not solvency; it is self-funding. Until free cash flow turns positive, leverage is a support, not a catalyst.
Insider Activity
The insider tape is clearly net selling. The most visible transactions came from the CEO, CFO, a director, and multiple executives, and the sale prices were generally above the current implied share price. I read that as a weak alignment signal rather than a decisive thesis breaker, but it does matter when the stock is already up sharply.
Comparable Analysis
Growth
| Company | Revenue TTM (USD Mil) | Revenue Growth YoY % | EBITDA TTM (USD Mil) | Diluted EPS TTM |
|---|---|---|---|---|
| SANM | 11,340.9 | 102.3% | 755.4 | 4.7 |
| JBL | 33,590 | 11.8% | 2,397 | 8 |
| FLEX | 27,914 | 16.9% | 2,060 | 2.3 |
| PLXS | 4,310.3 | 18.7% | 299.7 | 6.8 |
| CLS | 13,789.3 | 52.8% | 1,380.3 | 8.2 |
| TTMI | 3,103.7 | 30.4% | 438.9 | 1.8 |
Source: Yahoo Finance
Sanmina’s revenue growth was 102.3% TTM, far above JBL at 11.8%, FLEX at 16.9%, PLXS at 18.7%, CLS at 52.8%, and TTMI at 30.4%. That growth rate is impressive, but it also comes off a smaller $11.3B revenue base than JBL’s $33.6B, so the market should not treat the percentage alone as proof of superior scale. SANM’s diluted EPS of 4.7 TTM is solid, but not enough by itself to justify a growth premium.
Valuation
| Company | Trailing P/E | Forward P/E | EV/Revenue | EV/EBITDA | Price/Sales (TTM) | Price/Book (mrq) | Beta (5Y Monthly) | FCF Yield % (TTM) | Forward EPS | Analyst Target Price – Low | Analyst Target Price – High | # Analyst Opinions |
|---|---|---|---|---|---|---|---|---|---|---|---|---|
| SANM | 44 | 15.9 | 1.1 | 16.1 | 1 | 4.6 | 1.56 | -0.7% | 13 | 185 | 280 | 4 |
| JBL | 40 | 19.1 | 1.1 | 15 | 1 | 25.3 | 1.28 | 3.6% | 16.7 | 365 | 482 | 9 |
| FLEX | 55.2 | 18.6 | 1.8 | 23.9 | 1.7 | 9.2 | 1.63 | 1.8% | 6.9 | 80 | 203 | 10 |
| PLXS | 37.2 | 26.8 | 1.6 | 22.6 | 1.6 | 4.6 | 0.88 | 0.3% | 9.5 | 258 | 330 | 4 |
| CLS | 40.6 | 22.3 | 2.8 | 28.3 | 2.8 | 18.3 | 1.51 | 1.7% | 15 | 360 | 550 | 18 |
| TTMI | 78.1 | 26.6 | 5 | 35.4 | 4.8 | 8.1 | 2.10 | -0.4% | 5.4 | 205 | 220 | 4 |
Source: Yahoo Finance
SANM’s EV/revenue of 1.1x matches JBL and sits below FLEX at 1.8x, PLXS at 1.6x, CLS at 2.8x, and TTMI at 5x. Forward P/E is 15.9x, below JBL at 19.1x, FLEX at 18.6x, PLXS at 26.8x, CLS at 22.3x, and TTMI at 26.6x, which tells me the stock is not demanding on earnings but is still not backed by strong cash conversion. On a $1 invested basis, SANM would be worth $2.01 over 1 year, versus $1.46 for JBL, $2.50 for FLEX, $1.89 for PLXS, $2.09 for CLS, and $3.14 for TTMI; that performance is good, but it has already been recognized in the share price. The market is paying for SANM’s growth, yet the leverage and cash-flow profile do not support a much higher multiple than peers with cleaner conversion.
Profitability
| Company | Operating Margin (TTM) | Net Margin (TTM) | Return on Assets (TTM) | Return on Equity (TTM) | Gross Margin (TTM) | EBITDA Margin (TTM) |
|---|---|---|---|---|---|---|
| SANM | 5.7% | 2.3% | 4.8% | 11.0% | 8.5% | 6.7% |
| JBL | 5.2% | 2.6% | 5.0% | 65.9% | 9.2% | 7.1% |
| FLEX | 5.7% | 3.2% | 4.7% | 17.3% | 9.4% | 7.4% |
| PLXS | 5.3% | 4.4% | 4.3% | 13.2% | 10.1% | 7.0% |
| CLS | 6.6% | 7.0% | 10.7% | 52.5% | 12.0% | 10.0% |
| TTMI | 8.6% | 6.3% | 4.9% | 11.4% | 21.0% | 14.1% |
Source: Yahoo Finance
SANM’s gross margin was 8.5% TTM, below JBL at 9.2%, FLEX at 9.4%, PLXS at 10.1%, CLS at 12%, and TTMI at 21%. EBITDA margin of 6.7% also trails JBL at 7.1%, FLEX at 7.4%, PLXS at 7%, CLS at 10%, and TTMI at 14.1%, so the company is not yet turning scale into best-in-class economics. ROE was 11% and ROA was 4.8%, which is steadier than the more levered peer profiles, but it is not a premium return profile.
Leverage
| Company | Total Debt/Equity % (mrq) | Current Ratio (mrq) | Total Debt (mrq, USD Mil) | Operating Cash Flow TTM (USD Mil) | Free Cash Flow TTM (USD Mil) | Net Debt/EBITDA (TTM) | FCF Margin % (TTM) |
|---|---|---|---|---|---|---|---|
| SANM | 92.7 | 1.7 | 2,419.9 | 977.4 | -80.9 | 1.1 | -0.7% |
| JBL | 297.1 | 1 | 3,943 | 1,857 | 1,211.6 | 1.1 | 3.6% |
| FLEX | 86.8 | 1.4 | 4,465 | 1,685 | 839.9 | 1 | 3.0% |
| PLXS | 18 | 1.5 | 267.7 | 172 | 22.6 | -0.1 | 0.5% |
| CLS | 44.9 | 1.3 | 941.7 | 885.5 | 646.9 | 0.4 | 4.7% |
| TTMI | 57.1 | 1.9 | 1,049.3 | 324.3 | -55 | 1.4 | -1.8% |
Source: Yahoo Finance
SANM’s debt/equity was 92.7%, below JBL at 297.1% and above FLEX at 86.8%, PLXS at 18%, CLS at 44.9%, and TTMI at 57.1%. Net debt/EBITDA of 1.1x is reasonable, but FCF margin of -0.7% is weaker than JBL at 3.6%, FLEX at 3%, PLXS at 0.5%, and CLS at 4.7%. That combination matters because the company’s growth is not yet funding itself, so the balance sheet is helping the equity case more than the operating cash flow is.
Conclusion
I would put my rating as a Hold because the main tension is between strong revenue growth and weak cash conversion. Sanmina has already shown that it can grow fast, but the latest numbers still show negative levered free cash flow, a 6.7% EBITDA margin, and broad insider selling, so the rerating is not yet backed by enough internal cash generation.
I would raise my rating more toward a Buy if quarterly revenue can stay above $4B while EBITDA margin moves to 8% or better, because that would show the higher-value mix is finally translating into cash. I would also want to see levered free cash flow turn positive for two straight quarters, since that would tell me the business is becoming self-funding rather than relying on accounting earnings and balance-sheet capacity.
I would move from Hold to Sell if revenue growth falls back below 20% year over year for two straight quarters, or if gross margin slips below 8%, because then the current valuation would be paying for a growth profile that is no longer there. Continued heavy insider selling would add to that concern, especially if it coincides with another quarter of negative free cash flow.
My final view is that the bear case is more likely to show up first because the stock already discounts a cleaner cash-flow path than the company has yet delivered. I am not bearish enough to call it a Sell, but I would wait for proof that the Q1 2026 margin and earnings step-up can persist into cash before getting more constructive.
What’s your take? I rated Sanmina (SANM) HOLD above — but the goal here is to get this right, not just to publish an opinion. What would you add to this analysis, or which risk or catalyst do you think I’m under- or over-weighting? Tell me in the comments.
Sources
- SEC 10-K Annual Report — filed 2024-11-27
- SEC 8-K Filing (2024-12-12)
- SEC 8-K Filing (2024-11-29)
- SEC 8-K Filing (2024-11-04)
- SEC 8-K Filing (2024-10-29)
- SEC 8-K Filing (2024-07-29)
- SEC 8-K Filing (2024-05-30)
- SEC Form 4 Insider Transaction (2026-06-01)
- SEC Form 4 Insider Transaction (2026-05-28)
- SEC Form 4 Insider Transaction (2026-05-12)
- SEC 10-K Annual Report — FY2024
- SEC 10-K Annual Report — FY2023
- SEC 10-K Annual Report — FY2022
- SEC 10-K Annual Report — FY2021
- SEC 10-K Annual Report — FY2020
Data sourced from Yahoo Finance and SEC EDGAR. Not investment advice.
Leave a Comment